You can learn a lot from your airplane’s report card
Jack owns a 2016 Cirrus SR22 with a Garmin Perspective glass cockpit—basically a G1000 on steroids. His MFD records tons of data on an SD card—CHTs, EGTs, oil pressure and temperature, MAP, RPM, fuel flow, altitude, TAS, electrical bus voltages and current, even GPS coordinates—and Jack regularly uploads this data to my company’s SavvyAnalysis platform.
Once uploaded, Jack’s data is automatically scanned by a sophisticated machine-learning algorithm for evidence of failing exhaust valves. Whenever Jack requests it, selected flights are scrutinized by Savvy’s team of professional data analysts who prepare a comprehensive report on the health of Jack’s engine and the appropriateness of his powerplant management procedures.
In addition, Jack receives regular “report cards” that graphically shows how his SR22 stacks up when compared to a “cohort” of more than 1,500 other normally aspirated Cirrus SR22s that followed by SavvyAnalysis. Jack’s report cards display numerous parameters related to performance, efficiency, longevity and health of his aircraft and its engine, and essentially “grades them on the curve” to show Jack how his aircraft is stacking up when compared to the other aircraft in his cohort.
How Am I Doing?
In late 2020, Jack was reviewing his most recent report card. Its first section focused on the cruise phase of his flights:
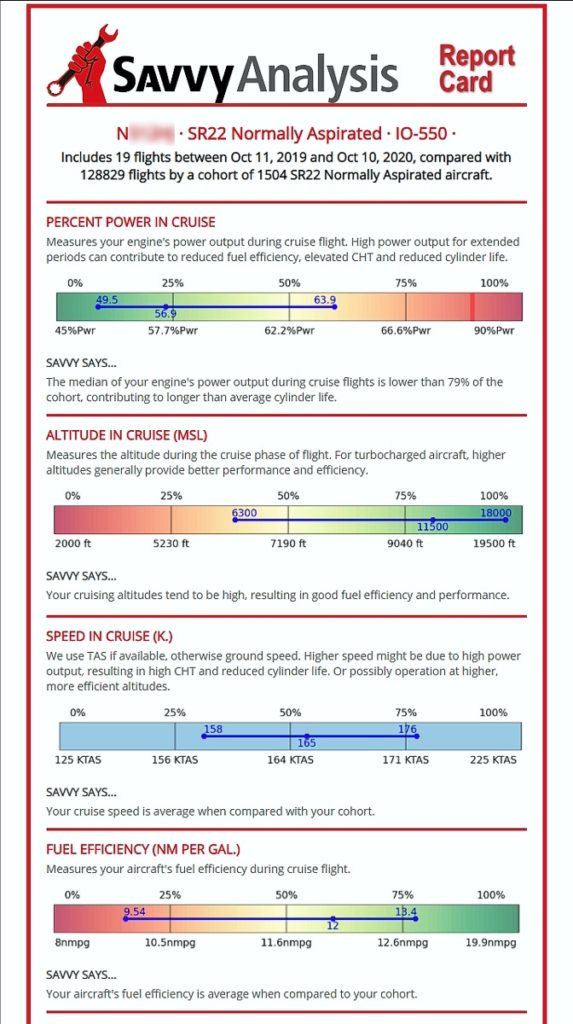
Jack’s conclusion was that his numbers looked pretty darn good. The repot card showed that Jack had been operating at relatively modest cruise power settings (50%-64%), primarily because he habitually cruised at relatively high altitudes—a median of 11,500’ MSL and occasionally as high as FL180. These high cruise altitudes allowed him to achieve better than average cruise speeds (158-176 KTAS, median 165 KTAS) and achieve better than average fuel efficiency (9.5 to 13.4 nm/gallon, median 12 nm/gallon). Not too shabby!
Too Hot in the Climb
But, as Jack read further down his airplane’s report card, he spotted something that got his attention:
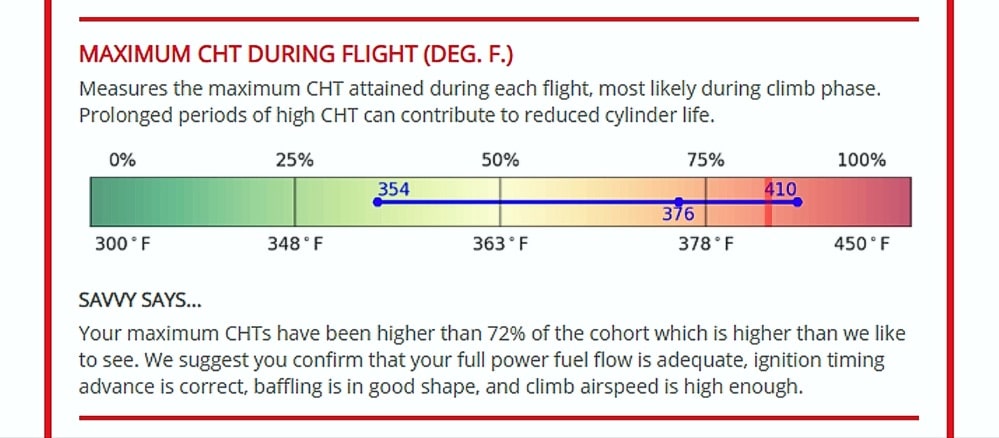
The maximum CHT during the climb phase was uncomfortably warm: median 376°F and maximum of 410°F—waaay too hot for a Cirrus! The SR22 has an exceptionally efficient engine cooling system, and it’s unusual to see CHTs much above about 360°F in these airplanes. Jack’s climb CHTs were definitely unusual, and not in a good way.
The report card said diplomatically: “Your maximum CHTs have been higher than 75% of the cohort, higher than we like to see. We suggest you confirm that your full power fuel flow is adequate, ignition timing advance is correct, baffling is in good shape, and climb airspeed is high enough.”
Jack’s first thought was that he might have a problem with engine cooling baffles that were missing or mispositioned, a common cause of high CHTs. However, the section of the report card that showed maximum CHT spread in cruise….
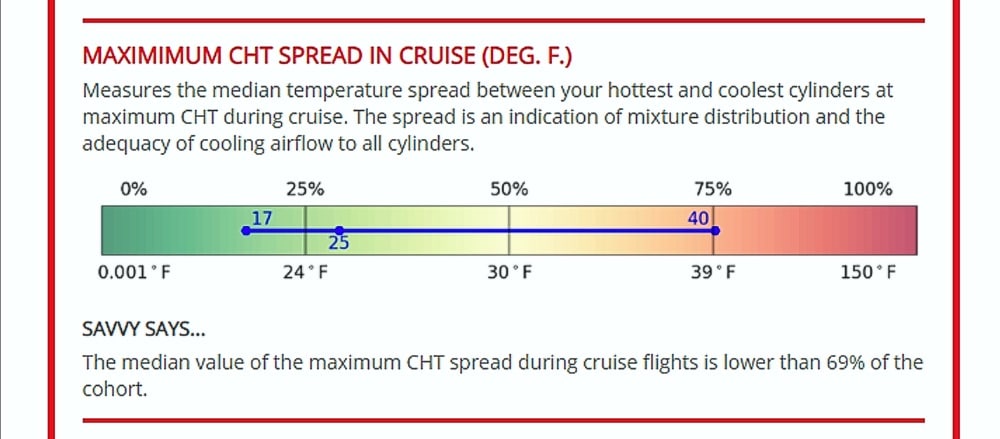
…made it clear that Jack’s cooling system was actually in tip-top shape. The CHT spread measures the difference between the hottest and coolest CHT—the smaller the spread, the better. Jack’s CHT spread was exceptionally tight, better than 69% of the cohort. So the problem must be something other than cooling baffles.
Not Enough Fuel Flow
Another section of Jack’s report card analyzed maximum fuel flow, which normally occurs during takeoff and initial climb. Sure enough, Jack’s report card clearly showed that his maximum fuel flow was less than it ought to be:
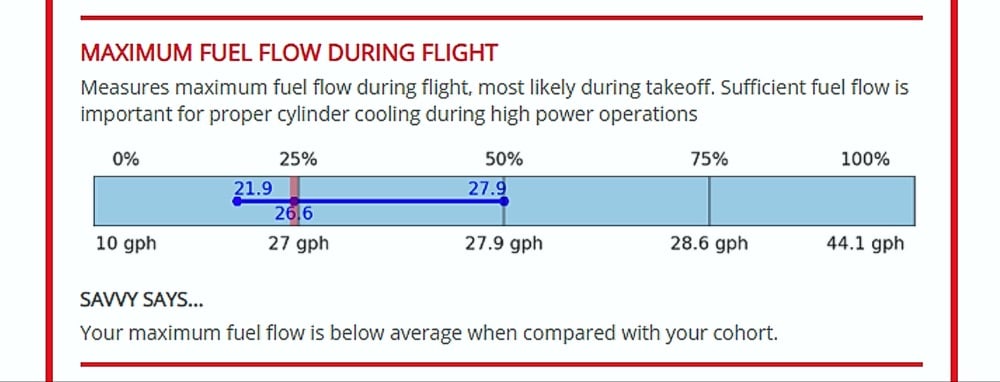
Jack’s median takeoff fuel flow was only 26.6 GPH—a whopping 1.3 GPH less than the cohort average of 27.9 GPH. (Actually, we prefer to see takeoff FF for these engines adjusted to 28.0-28.5 GPH.) Jack’s inadequate fuel flow could certainly make a big difference in engine cooling during climb.
When Did This Start?
Jack hadn’t really noticed these high CHTs in climb until he saw the report card. Naturally, he wondered how long this had been going on. To find out, he turned to his airplane’s trend report that offers longitudinal analysis of critical parameters over time:
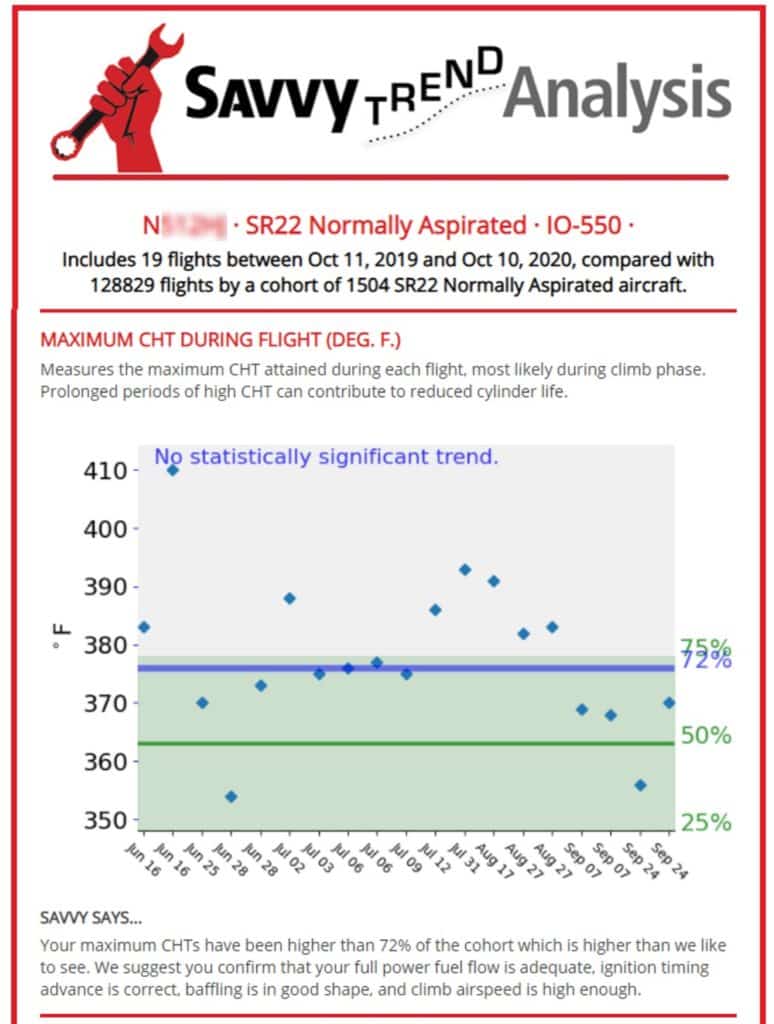
The trend report showed that the high climb CHTs had been going on for months. The highest recorded CHT of 410°F (yikes!) took place in mid-June, and all the flights from mid-July to late August had CHTs that were uncomfortably warm. Starting in September, the CHTs started to decrease sharply—most likely correlated with the onset of cooler weather.
Another Unwelcome Trend
While looking at the trend report, another thing caught Jack’s eye:
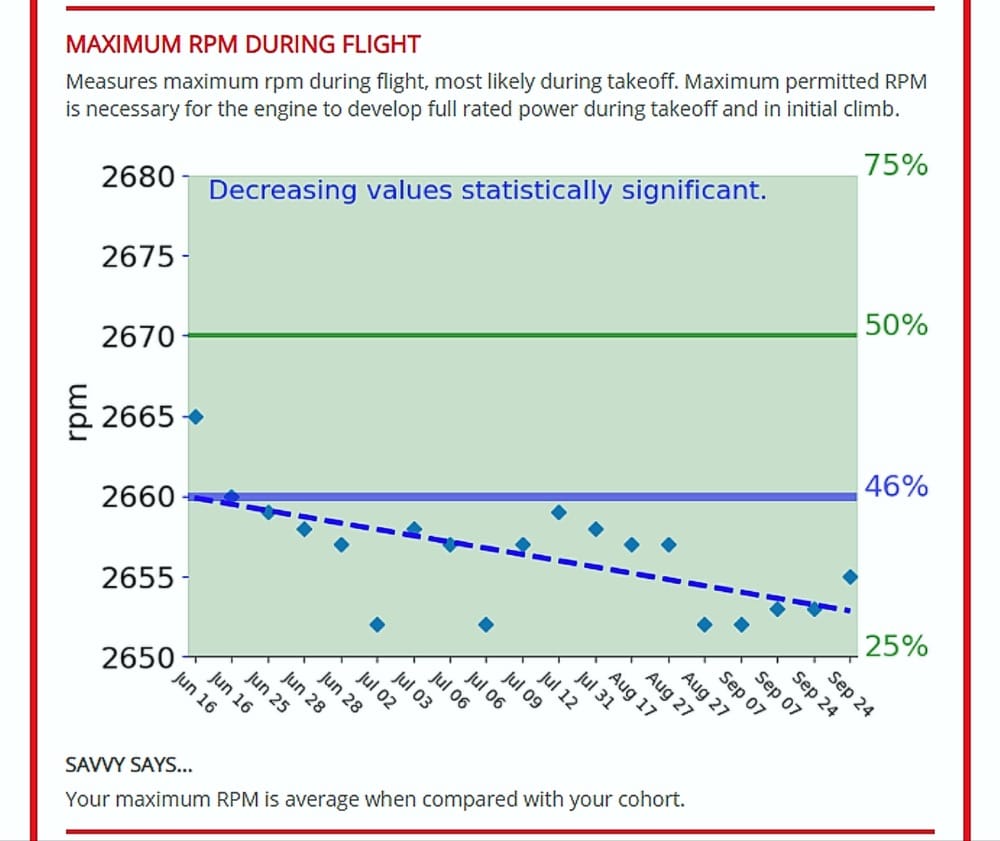
The report showed a statistically significant downtrend in takeoff RPM for Jack’s airplane. Jack’s Continental IO-550-N engine requires 2,700 RPM to achieve its maximum rated takeoff power of 310 hp. We start getting concerned if the airplane can’t make at least 2,680 RPM. Jack’s trend report showed that his takeoff RPM was around 2,660 in mid-June and drifted down to nearly 2,650 by mid-September—considerably out of tolerance and representing a loss of 5-10 horsepower.
Jack made a note to have his shop adjust the takeoff fuel flow to 28.0-28.5 GPH and the prop governor to 2,700 RPM during his next 50-hour maintenance.
Not Just for Leaning
You don’t have to fly a Garmin-equipped Cirrus to take advantage of these report cards and trend reports. They’re available to owners of nearly 200 airplane makes and models for which SavvyAnalysis has cohorts of meaningful size. You can find a complete list of supported make/model cohorts at https://bit.ly/3HsqLpM, and the list is growing weekly. The report cards and trend reports are sent out automatically on a regular basis, and can also be retrieved on-demand at any time.
As Jack’s experience shows, these reports can be incredibly useful in identifying mechanical and operational issues and spotting significant trends. The SavvyAnalysis platform accepts data from virtually all certified and experimental digital engine monitors that have recording capability. So, if you thought that your engine monitor was just for leaning, think again.
You bought a plane to fly it, not stress over maintenance.
At Savvy Aviation, we believe you shouldn’t have to navigate the complexities of aircraft maintenance alone. And you definitely shouldn’t be surprised when your shop’s invoice arrives.
Savvy Aviation isn’t a maintenance shop – we empower you with the knowledge and expert consultation you need to be in control of your own maintenance events – so your shop takes directives (not gives them). Whatever your maintenance needs, Savvy has a perfect plan for you: