The modern probe-per-cylinder digital engine monitor is a marvelous tool for keeping tabs on your engine’s health and troubleshooting its maladies. Here are some tips for figuring out what those bars and digits mean.
This is embarrassing, but I might as well come clean: Up until 2003, I was still flying my Cessna T310R with only the primitive engine instrumentation installed by the factory in 1979.
I’d long since upgraded my avionics stack with conspicuous quantities of glass, including a Garmin GNS-530 navigator and a Sandel SN3308 electronic HSI. I’d installed an XM Satellite Radio receiver to pipe stereo music to my ANR headsets. I’d added VGs to the wings and vertical tail. I’d even reupholstered my seats with the latest visco-elastic memory foam padding. But I was still relying on 30-year-old steam-gauge engine instrumentation.
A modern digital engine monitor had been at or near the top of my wish list for years. Yet somehow the $5,000 I had set aside for this upgrade always seemed to get preempted by something else (usually nonaviation-related) every March when my annual comes due. In addition, I secretly dreaded what I expected to be a difficult, time-consuming and tedious task of installing such a system in my turbocharged twin. So for years I kept making excuses, procrastinating, and occasionally catching good-natured flak from my aviation friends and colleagues.
Two years ago, I finally bit the bullet. I purchased an EDM-760-6C system from J.P. Instruments (taking advantage of their Sun ‘n Fun show special discount) and installed it in my airplane. The installation was indeed time-consuming – it involved the installation of 29 sensors and 500 feet of wiring, and took me a full week – but wasn’t nearly as difficult as I anticipated and worked perfectly the first time I powered it up.
Within months, I was kicking myself for not installing the system years earlier. It’s without doubt amongst the best time and money I’ve ever spent on my airplane.
During the past two years and about 500 hours of flying with my engine monitor, I’ve gradually learned more about how to use it and how to interpret the data it displays and logs. The more I’ve learned, the more I’m convinced this kind of instrumentation belongs in every piston-powered aircraft. A digital engine monitor arguably offers the best cost-benefit ratio of any item of avionics you can install.
Which monitor to choose?
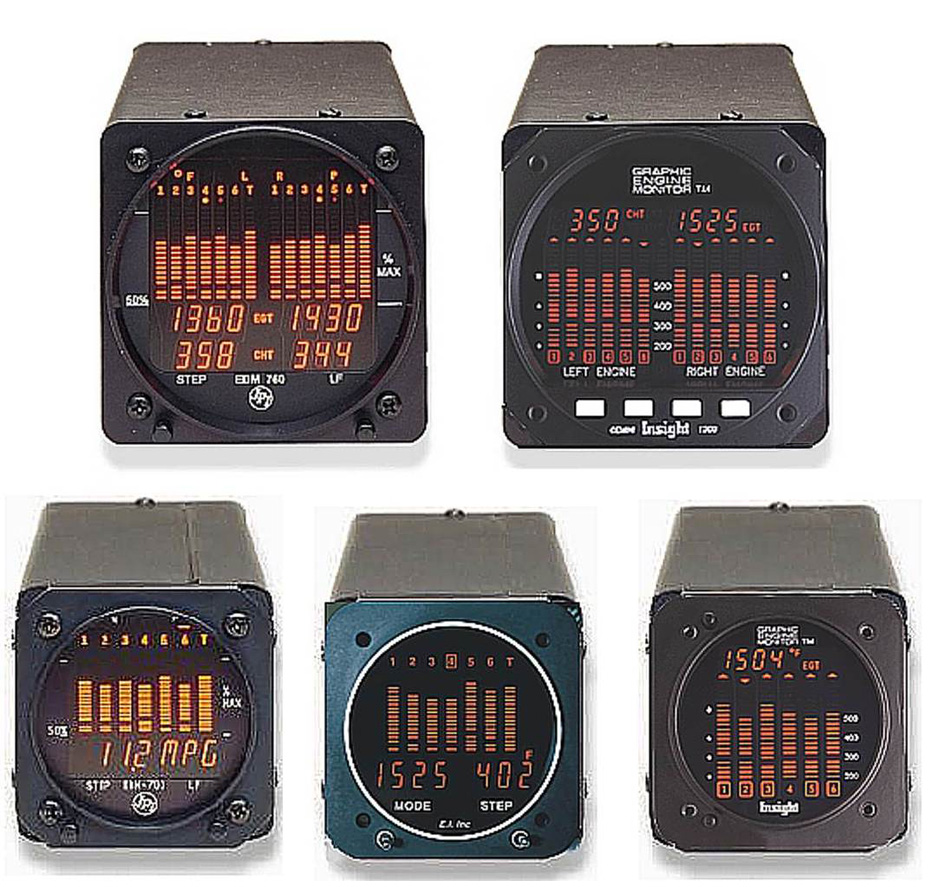
Insight pioneered the digital engine monitor more than 20 years ago with their introduction of the original Graphic Engine Monitor. The original GEM offered bar-graph displays of EGTs and CHTs for each cylinder, but no digital readouts, alarms or data logging. In the late 1980s and early 1990s, Insight introduced the first twin-engine monitor (the GEMINI 1200) and an improved single-engine model (the GEM 610), both of which featured combined digital and bar-graph displays, data logging, and a primitive alarm capability. But in recent years, Insight’s R&D efforts have been focused primarily on other products (e.g., lightning detection, air data computers, fuel flow, RVSM), and seem to have let their Graphic Engine Monitor product line to lag behind the competition in terms of functional features.
Today’s most feature-rich engine monitors come from J.P. Instruments and Electronics International. These two firms are fiercely competitive (to the point of attacking one another in advertisements and suing one another in court). The two firms are constantly trying to leapfrog one another in terms of features, and to undercut one another in cost. Both JPI and EI have enthusiastic customer followings. Both make excellent instruments and offer superb customer support. Choosing one over another is somewhat like choosing between a high-wing and low-wing airplane
In my case, however, the choice between JPI and EI was a no-brainer. JPI makes a twin-engine model (the EDM-760) that competes with (and easily surpasses) the Insight GEMINI 1200. EI does not offer a twin-engine model, so their only solution for twin owners is to install two UBG-16 instruments, one for each engine. I had panel space for one 3 1/8-inch instrument but not for two 2 1/4-inch instruments, so my choice was pretty obvious.
Routine monitoring
Over the past two years, my engine monitor usage has evolved considerably as I’ve learned more about what it can show. These days, I find myself referring to the instrument during virtually every phase of flight.
Taxi-out. At my home base airport, the taxi from my hangar to the approach end of the normally-active runway is nearly a mile in length, so there’s plenty of time to perform various preliminary checks during taxi-out. For example, I’ve long used this time to check my three gyroscopic flight instruments (AI, DG, T&B) for proper operation.
Nowadays, I frequently perform a preliminary ignition check during taxi-out. This consists simply of briefly shutting off one magneto switch at a time (I have four of them in my twin) while watching the engine monitor. What I’m looking for when I turn off each mag is six EGT bars rising and none falling on the associated engine. This verifies that all six spark plugs con-nected to the remaining operating magneto are firing properly.
If I see five EGT bars rise and one fall, I know that a spark plug isn’t firing. This isn’t reason to panic – yet – because it may simply be an oil-fouled spark plug that will clear itself during runup. (The engines in my 310 are canted due to wing dihedral, so the inboard bottom plugs are especially vulnerable to oil fouling after extended periods of disuse.)
Runup. If the taxi-out ignition system check looks good, I may skip the usual runup altogether, particularly if this is not the first flight of the day and the engine is warm enough to fly with.
Otherwise, when I reach the runup area, I’ll throttle up to normal runup RPM-1,700 RPM for my direct-drive Continentals. I’ll wait a moment for the EGTs to stabilize and then place the instrument into “normalize” mode (which sets all EGT bars to mid-scale and increases their sensitivity to 10°F per division). Then I’ll once again briefly shut off each mag switch at a time while watching the engine monitor and looking for six bars rising and none falling.
With a digital engine monitor, I no longer even look at the “mag drop” on the tachometer. RPM drop is a very crude and indirect indication of ignition performance – EGT rise of each cylinder is much better. If the engine runs smoothly on each mag individually, and if all of the EGT bars rise together as each mag is switched off, you’re good to go. (For most engines, EGT will rise 50°F or more on one mag.)
If it’s the first flight of the day or the OAT is unusually cold, I’ll cycle the props once – otherwise I won’t bother. Finally, I’ll take the engine monitor out of normalize mode, throttle back to idle, run my before-takeoff checklist, and I’m good to go.
Takeoff. Ever since I started flying twins 18 years ago, my takeoff procedure has been to taxi into position on the runway, set the brakes, slowly throttle the engines up to about 50% power, and then scan the engine gauges to ensure that there are no big “splits” between the two engines and that everything is in the green. If everything looks good, I release the brakes and slowly throttle the engines up the rest of the way to full takeoff power while rolling down the runway. When the engines reach full power, I make one more scan of the engine gauges to ensure that both fuel flows are where they should be, no splits, and everything still in the green. By that time, I’m usually close to liftoff speed.
To keep things simple and consistent, I now use precisely the same procedure when flying singles (except that there aren’t any splits to look for).
Now that I have the engine monitor installed, my takeoff procedure is essentially unchanged except that I include the engine monitor in my two scans of the engine instruments. During my 50%-power scan, I check to make sure that all EGT bars are coming up evenly. During my full-power scan, I check again to make sure that all EGT bars are about where they should be for takeoff – around 1,300°F for my turbo-charged engines, perhaps 100°F less for normally-aspirated.
If any EGT is substantially hotter or colder than the others, that consistutes grounds for rejecting the takeoff and returning to the runup area to sort things out. Ditto if either fuel flow is less than normal for takeoff.
Cruise-climb. Climbing out of 1,000 AGL, I typically accelerate to cruise-climb airspeed. Then I make an initial power reduction to approximately 75% power, and lean to something close to best-power fuel flow (around 100°F to 150°F ROP).
At this point, my engine monitor focus shifts from EGT to CHT: I endeavor to make sure that all CHTs remain at or below 380°F or so. If I notice any CHT edging up higher than 380°F, I take prompt corrective action – either by richening the mixture, increasing the airspeed, or both.
Cruise. Upon reaching cruise altitude, I level off (usually by pressing George’s altitude-hold button) and allow the airspeed to accelerate and stabilize. I then perform a Big Mixture Pull to reduce fuel flow comfortably into LOP territory, and close the cowl flaps.
Next, I fine-tune the mixture, using the method that I described in detail in this column several months ago (“LOP Made Simple,” CPA Magazine, March 2005). In a nutshell: If I want to go fast, I increase fuel flow until the hottest cylinder(s) reach 380°F; If I want to go far, I reduce fuel flow to the edge of perceptible engine roughness.
Once the mixture is set and everything is stable, I switch the engine analyzer to “normalize” and remain in that mode until it’s time to descend. The normalize mode equalizes all the EGT bars at mid-scale, so that any variation becomes very obvious. Equally important, the normalize mode increases bar-graph display sensitivity four-fold (from about 40°F per division to 10°F per division), so that even small variations can be seen clearly. This is quite important, because small EGT excursions can be evidence of big engine problems.
For example…
A perfect example of this was recently submitted by CPA member Mike Sutton. Figure 2 shows the data he downloaded from the JPI EDM-700 engine monitor when his 1981 Cessna T210N was downed for its annual inspection. Note the jittery EGT readings coming from cylinder #3. That’s the classic signature of a leaking exhaust valve. When Mike’s mechanic performed a compression test, cylinder #3 had 0/80 compression. A borescope inspection confirmed a badly warped and burned exhaust valve. Figure 3 shows what that valve looked like after the cylinder was removed from the engine.
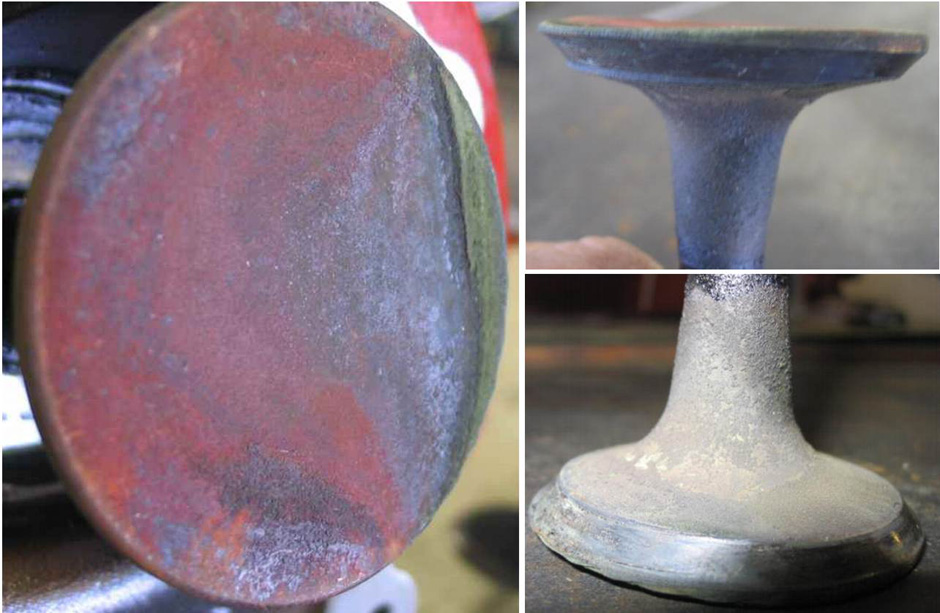
It is interesting to note that Mike Sutton never noticed this problem until he downloaded the engine monitor data. He had not developed the habit to switching his JPI monitor to normalize mode during cruise. The jittery #3 EGT was not apparent with the instrument display in its normal mode, but would have been quite obvious had he switched the instrument to normalize mode. (Three guesses how Mike plans to change his cockpit procedures once his airplane gets out of annual?)
Descent and landing. Prior to commencing descent from cruise altitude, I switch my engine monitor from normalize mode to normal mode before starting downhill. About 5 to 10 minutes from my destination, I start making incremental power reductions to cool the engine down prior to entering the traffic pattern or commencing the instrument approach.
During this phase. My engine monitor focus is primarily on the displayed cooldown rate. Lycoming has published a recommendation that cylinders be cooled no faster than 50°F/minute. I’m somewhat anal about cooldown, so I endeavor to hold my rate to 30°F/minute or less until all CHTs are down to 250°F or less.
Using alarms
Anytime I’ve installed a nifty new item of electronics on my instrument panel, I’ve found that I tend to get preoccupied with the new black box and let my scan go to hell. That certainly happened when I first put in the Garmin GNS-530 and again when I added the Sandel SN3308. Sure enough, when first I installed my engine monitor two years ago, I found myself spending waaaaay too much time fixated on the new instrument.
Part of the solution to this problem lies in getting familiar and comfortable enough with the instrument that you can absorb its data display or change modes in just a few seconds. The other part is achieved by programming the unit’s alarm limits so that it will demand your attention anytime something unusual is going on with your engine(s).
My JPI EDM-760 is mounted way over on the copilot’s side of the panel along with the other engine instruments – not the ideal location to be sure, but the best I could do without making massive changes to my panel layout. Fortunately, the JPI is equipped with a remote alarm output that can be connected to a remotely-mounted light or horn. I connected mine to a large amber annunciator mounted next to my airspeed indicator, putting it right in the heart of my flight instrument scan. When that light starts flashing, there’s no way I can miss it.
As delivered, my JPI monitor came with its various alarm limits set so that the unit would not alarm except in relatively extreme conditions. I soon learned that it’s better to reprogram the alarm limits to much more conservative values so that the monitor will get my attention whenever any engine parameter is even mildly out of the ordinary. Here’s a bit more detail about how I’ve set up my instrument:
CHT: JPI’s default high CHT alarm limit is 450°F. Since I endeavor always to limit my CHTs to 380°F or less, I’ve programmed my monitor to alarm at 400°F. Anytime the CHT alarm goes off, I take immediate corrective action – generally enrichening the mixture if I’m ROP or leaning it further if I’m LOP.
Oil Temperature: JPI’s default high oil temperature alarm limit is 230°F. I know from experience that my oil temperatures normally run between 185°F and 195°F, so I’ve programmed my monitor to alarm at 210°F. There’s also a low oil temperature alarm limit that defaults to 90°F; I’ve left mine at that value.
TIT: JPI’s default high TIT alarm limit is 1650°F, which corresponds to the manufacturer’s red-line limit for my turbochargers. I’ve reset my TIT alarm limit to an admittedly conservative 1600°F.
EGT Difference: An interesting feature of the JPI monitor is that it calculates the difference between the highest and lowest EGT on each engine, and alarms if that difference gets too high. This is a good tool for detecting if a cylinder has gone cold or into heavy detonation or pre-ignition. JPI’s default setting for the EGT difference alarm is 500°F. Since I know from experience that my EGTs normally remain within about 80°F of one another in flight, I’ve reprogrammed this alarm to a much more conservative 200°F. The downside of this is that I will often get a “DIFF” alarm during ground operations; the upside is that I am confident of catching any significant in-flight cylinder anomaly very quickly.
Cooldown: As mentioned earlier, the JPI calculates CHT cooldown rate, and triggers an alarm if that rate becomes excessive. JPI’s default cooldown alarm limit is 60°F/minute. Lycoming’s recommended limit is 50°F/minute. I’ve set my alarm at a very conservative 30°F/minute.
Bus voltage: The JPI has both low and high alarm limits for bus voltage. For 28-volt airplanes, JPI’s default limits are 24V and 32V (or 12V and 16V for 14-volt airplanes). My regulators are adjusted to maintain a bus voltage of 27.5V plus or minus 0.2V, so I’ve set my voltage alarm limits to 25.5V (low) and 29.5V (high).
Now, I am not suggesting that you use the same alarm limits I use in my Cessna T310R – they may not be appropriate for your aircraft. What I am suggesting is that for each of these parameters, you should determine the normal operating range for your aircraft, and then pro-gram your engine monitor alarm limits just a little bit beyond that range. This will ensure that you get an early alert for any unusual or untoward event.
Diagnostic tests
In addition to routine monitoring, a digital engine monitor permits you to perform various diagnostic tests that can be extraordinarily useful in accurately diagnosing engine problems:
Mixture distribution test: Also known as the “GAMI lean test,” this procedure enables you to evaluate how much mixture variation exists among the cylinders of your engine. It is usually performed at about 65% cruise power at an altitude of 6,000 to 10,000 feet; if you have cowl flaps, they should be open.
Starting with a full-rich mixture, write down the EGT of each cylinder. Now lean very slowly until the first cylinder reaches peak EGT, and note peak EGT value for that cylinder and the fuel flow at which that peak was achieved. Continue leaning very very slowly until each cylinder reaches peak EGT, and again write down the peak EGT value for each cylinder and the fuel flow at which each peak was achieved.
Once this data has been gathered, you can derive two valuable pieces of information. The first is the difference between full-rich EGT and peak EGT for each cylinder (referred to as the “lean range” for that cylinder), and the second is the difference in fuel flow between the first cylinder and the last cylinder to reach peak EGT (referred to as the “GAMI spread”).
For most engines, the “lean range” of each cylinder – the EGT rise from full-rich to peak-should be around 250°F to 300°F. If any cylinder has a substantially lower lean range than the others, it may be operating too lean at takeoff power and might be vulnerable to overheating or detonation. (Suspect a clogged injector nozzle or an induction leak.)
The “GAMI spread” is a measure of uneven mixture distribution. The smaller the spread, the better. A fuel-injected engine with properly tuned fuel nozzles will exhibit a GAMI spread in the vicinity of 0.5 GPH. Using stock nozzles, injected Lycoming and crossflow Continental engines typically have a spread around 1.0 GPH, and injected bottom-induction Continentals often have a spread of 1.5 GPH or more. Some carbureted engines (e.g., Continental O-470-series) can have spreads in the 2–3 GPH range. If your engine has a GAMI spread above 1.0 GPH, it probably won’t be able to run smoothly at lean-of-peak (LOP) mixtures.
In-flight mag check: Every student pilot is taught to perform a mag check during the preflight engine runup, but many pilots have never performed an in-flight runup and are uncomfortable with the idea. That’s unfortunate, because an in-flight mag check is an excellent diagnostic procedure, and a far more exacting test of the ignition system than the usual runup mag check.
In fact, the best and most revealing ignition system test you can perform is an in-flight mag check with the engine leaned aggressively LOP. The leaner the mixture, the more difficult it is to ignite. Therefore, if your ignition system performance is marginal, it will show up during a LOP in-flight mag check long before it becomes apparent in any other phase of operation.
If you have a digital engine monitor, the in-flight mag check should be done using the same procedure as previously described for a runup mag check. With the engine at normal cruise power and mixture (the leaner the better), switch the engine monitor to normalize mode, switch off one magneto at a time, and watch for all EGT bars to rise at least 50°F. You should feel a perceptible loss of power with the engine running on one magneto, but it should continue to run smoothly.
Induction leak test This in-flight test is an effective method for detecting leaks in the engine’s induction system. It is best accomplished in level cruise flight at about 5,000′ MSL. Start with a relatively high power setting – full throttle for normally aspirated engines, or 25″ MP for turbocharged engines – and full-rich mixture. Write down the EGT for each cylinder. Now throttle back the engine to reduce the MP by 5″ to 7″ and again write down the EGT for each cylinder.
Disregard the absolute EGT values. Instead, calculate the change in EGT for each cylinder between the high-power and low-power settings. Ideally, the amount of EGT change should be similar for all cylinders. If one cylinder (or two adjacent cylinders) exhibit(s) significantly less change than the others, suspect an induction system leak affecting that cylinder (or those adjacent cylinders).
Here’s the principle behind this test: At the high-power setting, the induction manifold pressure is very close to outside ambient pressure, so any induction leak will have little or no effect on engine operation. At the low-power setting, the manifold pressure is considerably lower than outside ambient (by 5–7 in.hg.), so any induction leak will cause the affected cylinder (or cylinders) to run substantially leaner than the others.
Data logging
Modern digital engine monitors provide the capability for logging engine data in-flight, and then dumping the logged data for post-flight analysis. The amount of data that can be logged is a function of both instrument memory capacity and data sampling rate. For example, my JPI EDM-760 memory capacity can capture up to 17 hours of engine operation if data is sampled every 6 seconds (the default setting). It can also be configured to sample as often as every 2 seconds, but doing so reduces the memory capacity to less than 6 hours.
JPI and EI monitors are normally installed with a hardwired serial data jack. This permits logged data to be downloaded into any laptop computer or PDA via a standard RS232 serial port.
Insight’s GEM and GEMINI monitors utilize an infrared (IrDA) link for downloading data. They require the use of an HP 200LX palmtop computer to receive the download. (The HP 200LX is obsolete and no longer in production, but can still be found on eBay.) Once downloaded into the palmtop, the data can then be transferred to a laptop or desktop computer by means of either a serial link or a flash memory card.
Of course, once you have the data on your computer, you can easily upload it to SavvyAnalysis.com and use our sophisticated charting and analysis tools for free.
