I have written about this before, every two years since 2015, and with lots of new clients and some new services since last time, it seemed like a good time for a biennial review.
The comedians are fond of saying, “Timing is everything.” I think the quality of the material is pretty important, too, but I guess their point is that bad timing can ruin good material, and that comedy is a performance art. You might expect an article about timing from the analysis side of Savvy to be about mags, flame fronts, degrees before top dead center, and getting the most bang for the buck from your engine. This one, though, is suggestions from us about how to get the most bang for your buck (B4Y$) from SavvyAnalysis.
What’s New Since the Last B4Y$
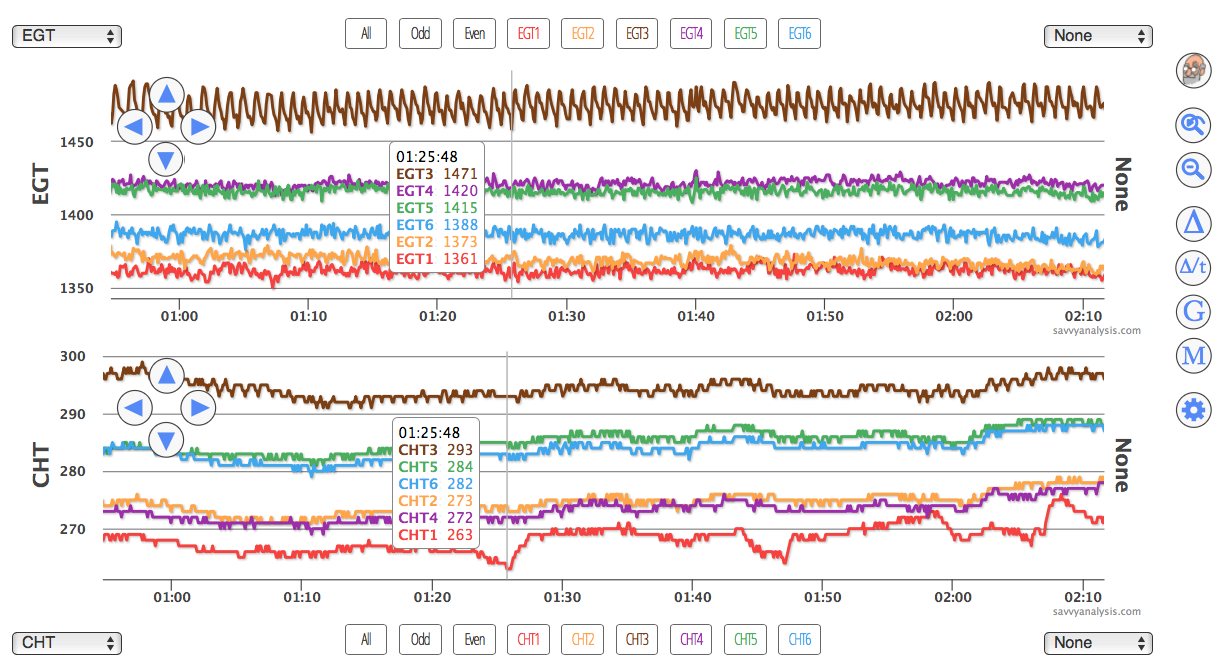
The biggest change is the display and user interface on the flight data page. In the legacy screenshots below you can see the previous layout. The buttons across the top were used to isolate or hide data for individual cylinders. Now it looks like this —

The Appearance menu is now where you isolate, bold, hide and group by odd/even the traces you want to see. At the bottom of the Appearance pull-down menu is a converter. You can convert just about anything to just about anything else. This is for this viewing session only – it’s not like an annotation that stays with the data.
See the old bearded analyst icon at the top of the tool set in the screenshot below? He’s retired now. Tools are at the top of the “details” column. If you’re not seeing it, click the blue SHOW DETAILS button. The Analysis information should be showing by default.
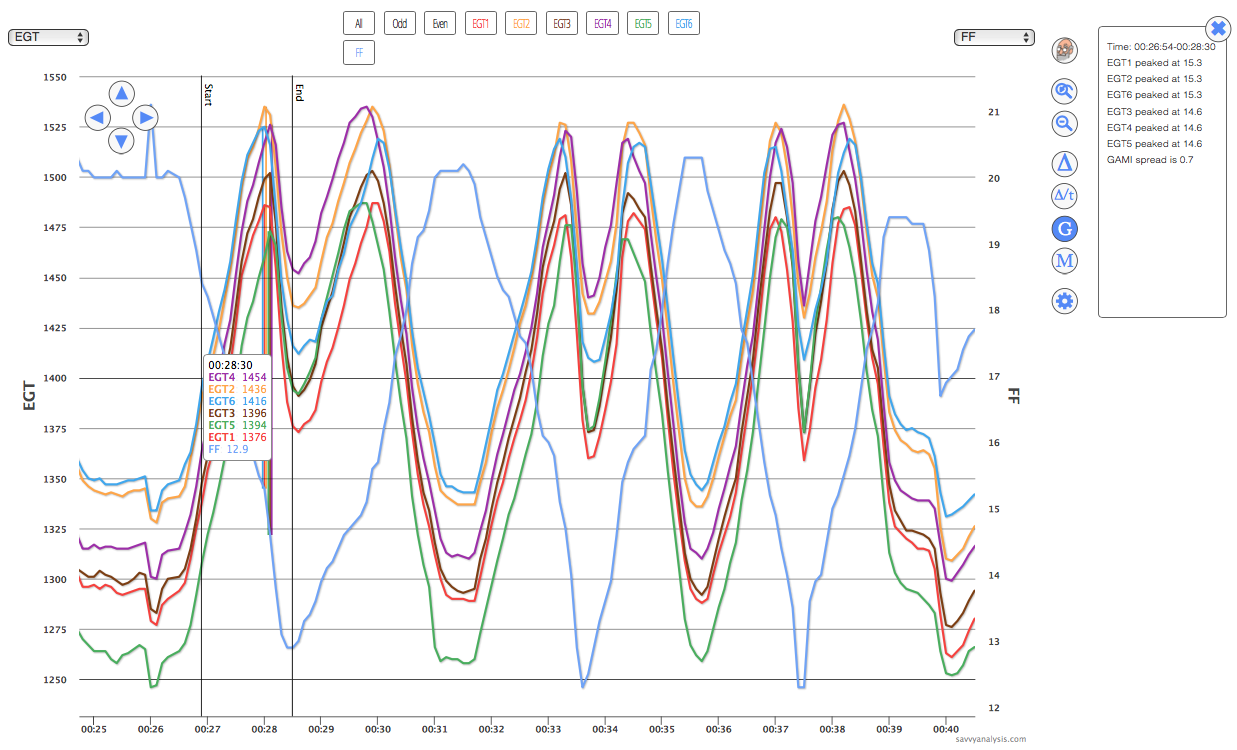
∆ still gives you the change from your first click to your second click. ∆/t gives you that change /min or /sec. G is still the GAMI tool for assessing mixture distribution. M is still the mag tool for assessing ignition health. A will be used to mark anomalies. More on that when we refine it. V puts a red vertical line on the highest value and a blue vertical line on the lowest value in the data being depicted. Let’s skip X for a second. The T/O tool is a handy way of viewing FF, RPMs and MAP. It’s pretty easy to spot the takeoff in the data, and you can click the V tool to overlay those max and min lines. If you’re displaying T/O traces, the X tool will add overlays for MAP, Volts, RPM and Oil pressure. Lots of data in one display.
Above the tools next to Analysis is Flight Map. For a long time we have wanted the map to be synched to the flight display, so when you click somewhere in the data the airplane moved to that leg of the flight. We have that now. It’s handy when you see a change in CHTs and wonder if that’s the spot where you turned into the wind. No more guessing.
There’s an option to download a kml file of your flight which you can import into Google Earth or your preferred app.
Back on the analysis page and below the tools is a link to share the data for that flight. With that copied link, your shop or partner or whoever won’t need to log into Savvy. Just click the link.
Below all that is a setting for how many ranks aka charts you want to see. That setting should be “sticky” and give you that number of ranks until you change it.
Veteran users will remember a checkbox in your account menu to revert to default settings of EGT, CHT and FF – or not. It was handy if you were trying to track – let’s say – MAP or V back through several flights. Then you could check the box again and go back to defaults. We decided that was more of a tool than a setting, so we moved it to the top of the flight data page and renamed it “RESET SERIES”.
Button to the left (off) will give you whichever parameters you choose as you use the arrow to scroll back or forward through your flights. Button to the right (blue) will give you EGT, CHT and FF defaults for each flight.
Lots of big changes to our data depiction. And more to come. Meanwhile, let’s review the basics.
When To Upload Flight Data
All flight data uploaded by Savvy Mx, Savvy QA and SavvyAnalysis Pro clients is scanned for the EGT signature of a failing valve. That happens without you having to ask. If the algorithm is triggered, we visually inspect the data and if we’re confident that the data is not bogus we will notify you. That’s true whether you’re an Mx, QA or Pro client. The Failing Exhaust Valve Analytics (FEVA) scan has been at work for about seven years now, and we have spotted and reported the pattern to hundreds of clients.
So if you’re a client who only uploads flight test profiles and anomaly flights, but not normal everyday flights, hopefully the automatic FEVA analysis gives you motivation to upload more regularly. Having more data to look at is also helpful when we’re trying to spot the onset of some anomaly, like all of a sudden CHTs are higher or FF is lower.
All of the above applies to FEVA 1.0. Since the last B4Y$ we have applied machine learning to the data-scanning process and developed FEVA 2.0, and now FEVA 2.1. With FEVA 1, you would only be notified if we saw something troubling and recommended investigation. With FEVA 2 and 2.1, we send you a report even when things are hunky-dory. Reports are auto-generated and sent when we gather data from eight new qualifying flights. Let’s unpack that a little.
We didn’t stop the FEVA 1 EGT scan when we introduced FEVA 2 and 2.1. So you might still get a FEVA 1 alert, as long as your engine data monitor logs EGTs. FEVA 2.1, on the other hand, requires more than just EGT data.
Since FEVA 2.1 reports are auto-generated you don’t have to ask for them. And if you do, our answer will probably be that we don’t have enough data from qualifying flights yet. A trip around the pattern would not be a qualifying flight. Nor would a series of approaches or a BFR with a lot of power changes. Flights with a stable cruise segment with minimal power changes would qualify.
That’s the news on FEVA.
It’s hard to quantify, but clients tell us that access to an airplane’s historical flight data can be a factor in pricing an airplane for sale. Makes sense – if you’re looking at two similarly priced airplanes and you can see the operational history of one but not the other, go with the devil you know. We routinely write analysis reports for airplanes in the Savvy Pre-buy program, and one of the things we look at is long gaps between flights. Was the airplane really not flying during that time, or was it flying regularly and we just have gaps in the upload. Could tell from the tach, but the data might give the wrong picture.
If all that isn’t reason enough, many of you have seen Savvy Report Cards, and more data means a more accurate report card. Last time I wrote about this, we hadn’t yet deployed Report Cards and Trend Analysis reports on demand. Those are now available to 207 cohorts — here’s the current list. A cohort is a specific airframe paired with a specific engine. We started with cohorts that showed the most flights available and have been working our way down the list. Noticeably absent are twins – we’re working on that now but it’s proving to be more challenging than generating a report card for a single – twice.
So if we’ve convinced you to regularly upload all of your flight data, when should you request analysis?
When to Request Analysis
There are popular airplanes, to be sure, but it’s hard to come up with a “typical” airplane. Even the popular models have different engine dash-types and other mods from year to year. But when we created SavvyAnalysis we had to imagine a typical owner/airplane scenario, and we had to estimate the amount of analysis that imaginary owner would need. Being airplane owners responsible for maintenance made that easier, and we determined that a full analysis report before the annual was a given, a partial analysis or two for some “rogue” event over the year was probable, and a check-up at about the mid-point between annuals was a good idea.
We also imagined that if the pre-annual report had identified a problem with ignition, induction or fuel systems, and maintenance were performed, it would be a good idea to request analysis for a post-annual flight to verify that the issue was resolved.
There is no limit on how many flights a Savvy Mx, QA or Pro client can submit for analysis. We made that choice because we didn’t want clients to view analysis requests as only being appropriate in an emergency or an anomaly. Obviously we can’t analyze every flight for every client, so we think the savviest of Savvy clients would request about two full reports and a couple of partial reports a year.
Questionable data is the most common example of a partial report. Let’s say you’re flying along and the engine is smooth as silk but some engine parameter isn’t right. EGT and CHT probes work in a hostile environment and failure is not unusual. Loose connections, particularly after maintenance, are also not unusual. So if you see something, say something. Submit the data with your concern about the anomaly, and we’ll look at other engine parameters which will usually rat out a probe or connection. In a case like this we would address the concern but not write a full report – unless you ask for one.
The next most common partial report scenario is an anomaly in performance. Some engine parameter isn’t right, and this time it’s not as smooth as silk. The best way to identify bad plugs and clogged injectors is the Savvy Test Profile.
When to Perform the Savvy Test Profile
The Savvy Test Profile is a series of mixture sweeps, and an in-flight mag check performed LOP at 65% power or lower. If you’re in smooth as silk mode – everything’s running great – the best time to perform the test is about a month before annual. It’s not like we need a month to look at the data – but starting that far out gives us time to gather more data if we need to. Once the airplane goes up on jacks our data gathering ends. So if you’re a week from annual and you still haven’t flown the test, better late than never, but the optimum time is about a month out.
Here’s a link to the expanded 7-page Test Profile.
Here’s a link to a digital version you can import into Foreflight.
Here’s a link to a printable Jepp-chart-sized version.
If you’re not in smooth as silk mode – you’ve got a rough runner – the time for the test is now. Don’t compromise safety, and if you need the closest runway, use it – but if you can safely gather data on the ignition system while it’s operational, that’s the time. For the LOP mag check, it helps to have 10 contiguous samples of data, so if your Avidyne’s sample rate is every 6 seconds, we like a minute of data. That’s asking a lot – to sit through backfires and vibrations for a minute – so give us what you can. But realize that one sample may not reveal the problem. If your engine data monitor allows for a more frequent sample rate, this is the argument for using it. If the rough running only shows up in LOP operations, then it would also help to have a series of mixture sweeps.
When we first started gathering mixture sweeps, we saw a lot of pulls that were too fast to use. The rate of change was too high for us to draw meaningful conclusions. Lately, the pace of sweeps has been excellent. Start 100 degrees ROP, lean to the onset of roughness, then richen back to 100 ROP. Smooth and steady.
Recently a client with multiple airplanes in a flying club reported that his pilots didn’t want to perform the test profile – that it wasn’t safe and was hard on the engine.
The test profile instructions spell this out pretty clearly, but I’ll add a reminder here. Before you do the sweeps or the mag check, verify that you’re at 65% power.
That said, we think the diagnostic value of the mag check makes it useful for spotting weaknesses in the ignition system that are much easier to spot in flight than in the shop. Done properly, we don’t think it’s unsafe. You’re at a safe cruise altitude, you’ve presumably cleared the area for traffic and are concentrating on the test. We think discovering a bad plug or mag or harness is safer in that configuration than on takeoff roll into IMC. Running on one mag at this low power setting is not hard on the engine. TITs and EGTs will climb, but the test doesn’t take long and they’ll drop again when you’re done. As far as the mixture sweeps, you’re doing something you do on every flight. Granted, you’re doing it with more precision, and can be made unsafe if you go beyond roughness to flameout.
One last note on timing. Our goal is to answer analysis requests within two business days. We’re often faster than that – sometimes much faster – but that’s the promise we strive for. If you’re sitting AOG after diverting because of a runaway CHT, and you want help deciding if it’s real heat or a failed probe, choose Urgent priority in your request and we’ll move you to the front of the line. It’s the honor system and the Golden Rule applies.
One Ticket is Enough
New clients sometimes wonder what to do when you want us to review data from more than one flight. Do you have to open multiple tickets? No. One ticket is enough – and, frankly, preferred. Multiple tickets open on the same issue is a recipe for trouble and mis-communication. Open one ticket, select one flight, describe the issue, and in the body of the ticket you can elaborate on which other flights you want us to review. Often when we’re working a ticket we’ll review previous or subsequent flights anyway.
Even if you have two separate issues – let’s say a voltage drop and a clogged injector – put them on the same ticket. The analyst can split them up if needed.
Analysts have the option to merge tickets. So if you do open multiple tickets, we may merge them in order to serve you more efficiently. We might merge a new ticket with an older ticket on the same issue in order to have everything in one place. When we’re working an analysis ticket for an Mx client, we typically merge the analysis ticket into the service ticket for the annual so everything’s in one place and we can deliver good B4Y$.
