I’ll go out on a limb and say that priming the engine is not a precise science. Every POH has instructions, but experience often suggests that some engines like a little more and some a little less. What happens to the excess fuel if the pilot over-primes? Cylinder manufacturers thought of that and included sniffle valves to drain excess fuel from the barrel. When they malfunction, sniffle valves can be a source of an induction air leak, which can cause the cylinder to run lean, even with a full rich mixture.
Induction leaks are often traced to a loose or failed clamp or sleeve or a problem with the riser and gasket. We have seen a lot of these in previous Puzzlers. A sticky valve is another way that unwanted air can enter the combustion chamber, but let’s save sticky valves for their own focus. At this point in engine data analysis we haven’t discerned the nuance between an induction leak from a riser or gasket and one from a failed sniffle valve. That may be a good project for machine learning – here’s data from a bad gasket and here’s data from a failed sniffle, find the differences in the patterns. Meanwhile, we humans have EGT and MAP to work with.
Let’s start with a benchmark. Here’s idle and taxi data from my Bellanca Viking with a Continental IO-520 and data from a JPI 830 at 2 secs. EGTs and MAP.
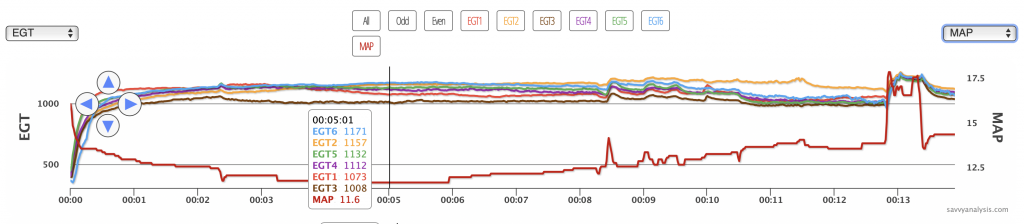
With no induction leaks we should see idle MAP around 12″ and here it’s in that range until taxi out at 6 mins. The rise at 13 mins is the runup.
It’ll be different for turbos because even at low power the turbo is in the system and can have an effect on idle MAP. But for normally aspirated engines the target idle MAP is 12-13″ and if we see it higher than that it might indicate a leak.
We’ll start this month with data from a Cessna 172 with a Continental IO-360 and data from a JPI 830 with a 6 sec sample rate. EGTs on top, the CHTs, then FF and MAP together.
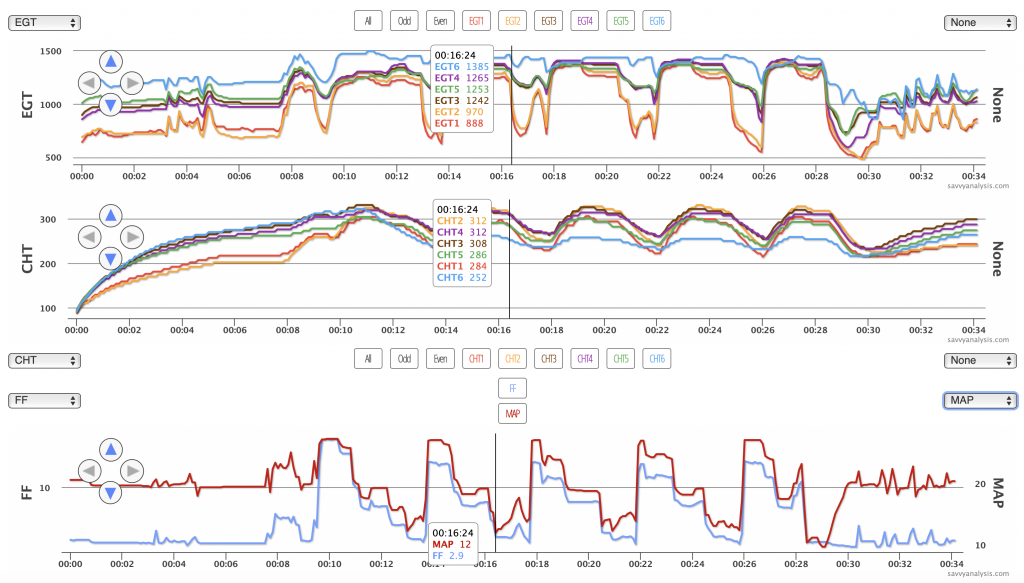
At first glance this appears to be a serious induction leak. Idle MAP is around 20″. Not only at startup, but also when taxiing back in after the five takeoffs. EGT and CHT are low for cyls 1 and 2. EGT and CHT for cyl 6 is high at idle, then they decouple and CHT moves lower while EGT stays high throughout the many power changes. And data at the cursor shows that when power is pulled in the flare MAP gets down into the 12″ range. Are you puzzled yet?
Notice the first takeoff at 10 mins. EGT 6 is much higher than the others. Compare that to the subsequent takeoffs, where EGT 6 is in with the others until FF is reduced, then it pulls away. At max MAP and full throttle the ∆ between engine MAP and ambient MAP is low. The ∆ would be highest at idle. So we’d expect to see the effect of a leak more at low power than at high power. That helps explain the later takeoffs, but not the first one. Then we noticed that FF is lower on the subsequent takeoffs than it was on the first one. That’s counterintuitive – lower FF brings EGT in line and higher FF sends it higher.
Could this be a case of the sniffter valve heating up and changing its behavior? It is, after all, right there in the heat of battle. That might explain the first takeoff, but doesn’t account for the high MAP during taxi-in. We wish the data always pointed to a smoking gun. Sometimes the best we can do is to rule things out, and in this case we think it’s not an issue of spark, and there’s enough in the data to suggest investigating for a leak.
Next is data from a Cessna 182 with a Continental O-470 and data from a JPI 900 with a 2 sec sample rate. EGT’s on top, then CHT’s, with FF and MAP below.
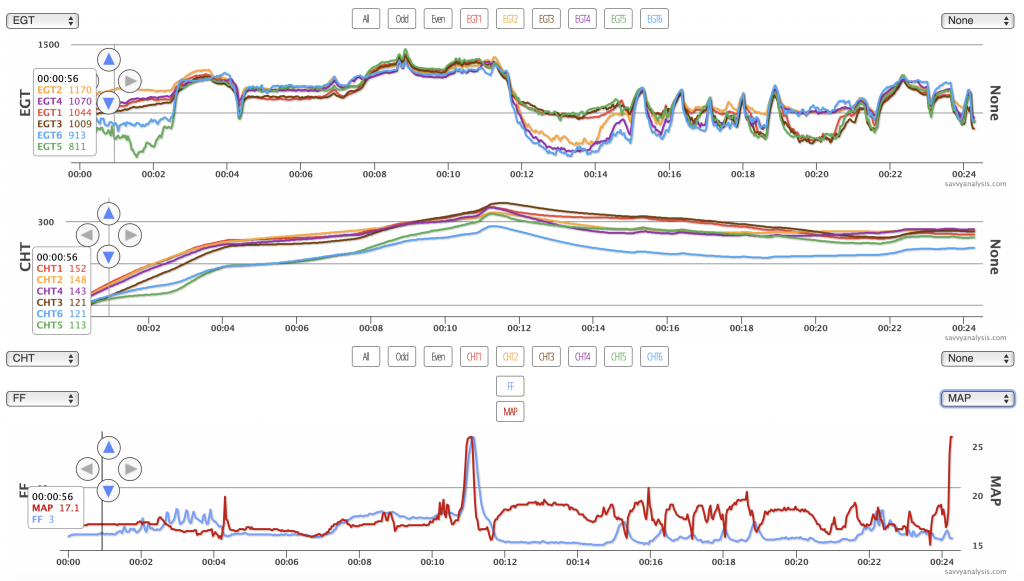
The cursor shows idle MAP of 17.1″ so right away we’re suspicious of a leak. EGTs and CHTs 5 and 6 show poor power output initially, then those EGTs look ok after the 3 min mark – CHT 5 joins the others and 6 stays low throughout. One reason I chose this data is what happens at 12 mins compared with what happened at 19 mins. Notice at 12 when MAP rises EGTs for 2-4-6 fall vs 1-3-5. Notice at 19 mins it’s the other way around with the same MAP.
Carb temp isn’t logged but that’s our best guess for the difference. When carb heat is introduced, it changes the mixture distribution enough so that even with similar FF and MAP, you change the EGT rank. When EGT rank changes as a group, odds vs evens, it suggests the leak is probably not in the sniffer valve or the riser of each individual cylinder – more likely in the common plumbing they share. Here again, we think there’s enough in the data to investigate for an induction leak.
Here’s data from a Beech Baron 55 with Continental IO-470 engines and data from an Insight G4 with a 1 sec sample rate. This is L engine data with EGTs on top, then CHTs, and FF and MAP below.
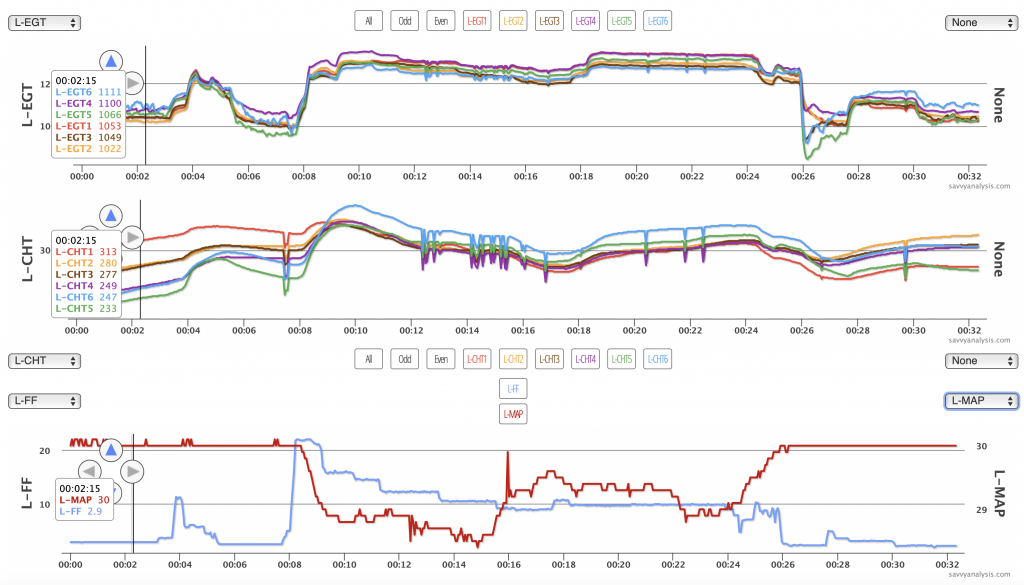
Idle MAP is 30″. How can that be? The engine is making power and it’s not excessively lean even though it would appear to be way outside the ideal fuel to air ratio of 15:1 by weight. Data for the other engine showed the same thing. What are the odds of both engines having similar leaks or sensor malfunctions?
This is not really fair as a puzzler but I wanted to include it because it’s such a rare scenario. What happened is this is a new install of the G4, and the MAP sensors had not been connected to the engine yet. So basically we have a digital barometer, and P – can’t really call it MAP – drops as the airplane climbs, and rises again when it lands. There’s a first time for everything.
Now let’s talk about those spikes in the data. Here’s the same EGT and CHT with Bus V added in red.
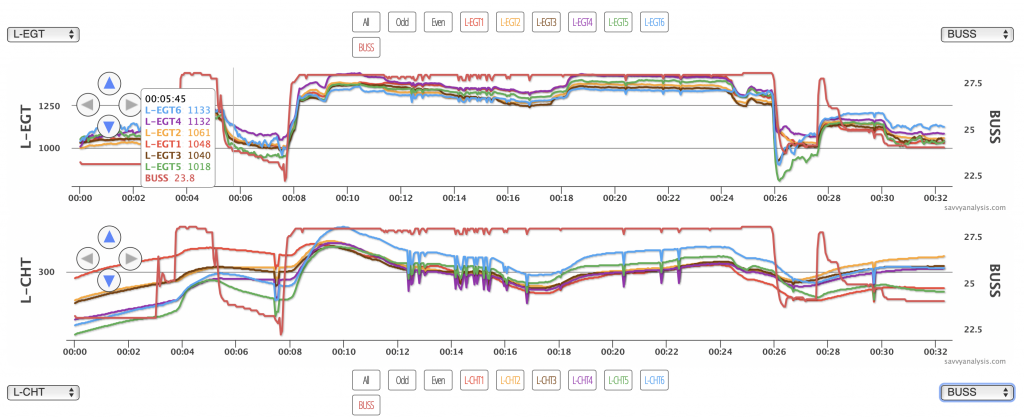
Every spike in the cylinder matches a spike in voltage. Putting on our detective hats and connecting the dots that the cool new digital barometer gave us, it looks like takeoff and climb to a few thousand feet, maybe the air was rougher than they liked from 12 to 14 mins, so they descended a bit but still got some jolts – enough for a few good spikes from 20 to 22 mins. We suspect the problem is with the ground connection for the G4.
