Recently a client submitted engine data with an erratic EGT trace. It always makes sense to check the connection first, but in this case it looked like a failing probe. When we reported this, he said that he suspected it failed because he hadn’t been flying much lately because of the virus. Then he asked if we had seen an increase in failed probes with people doing less flying. The first thing that came to mind was a tweet by Foreflight’s Tyson Weihs (@tysonweighs) from September that the seven-day average of FAA IFR flight plans filed was well ahead of 2019 for piston, turboprop and jet categories. But we know that not every plan got activated, so let’s accept the premise of the question and say there’s less flying this year.
The second thing that came to mind was a chat I had with the trainer at my gym. He noticed that the elliptical machine I was using made a couple clicks on every cycle. I didn’t hear it because I was halfway through a blues playlist on my iPad at the time. Once I took the headphones off I could hear it. He said all the machines had developed quirks because they sat unused for so much of the year. Then I remembered Mike’s Busch’s article from March about precautions to take if you thought your airplane would be sitting a lot.
So the questions on the floor are have we seen more probe failures because (for the sake of argument) airplanes have logged fewer hours this year ? Or have we seen fewer probe failures because (for the sake of argument) airplanes have logged fewer hours this year ? What I found surprised me. I don’t think the data supports either “more failures” or “fewer failures” for EGT and CHT probes. But this year we have had a lot of oil pressure events. Some turned out to be mechanical issues like relief valve springs and debris on the valve seat, and others were simply sensor failures and loose connections. That got me wondering if there had been more cylinder repairs this year – for whatever reason. I’ll do some research and if there’s something in the data I’ll write about it.
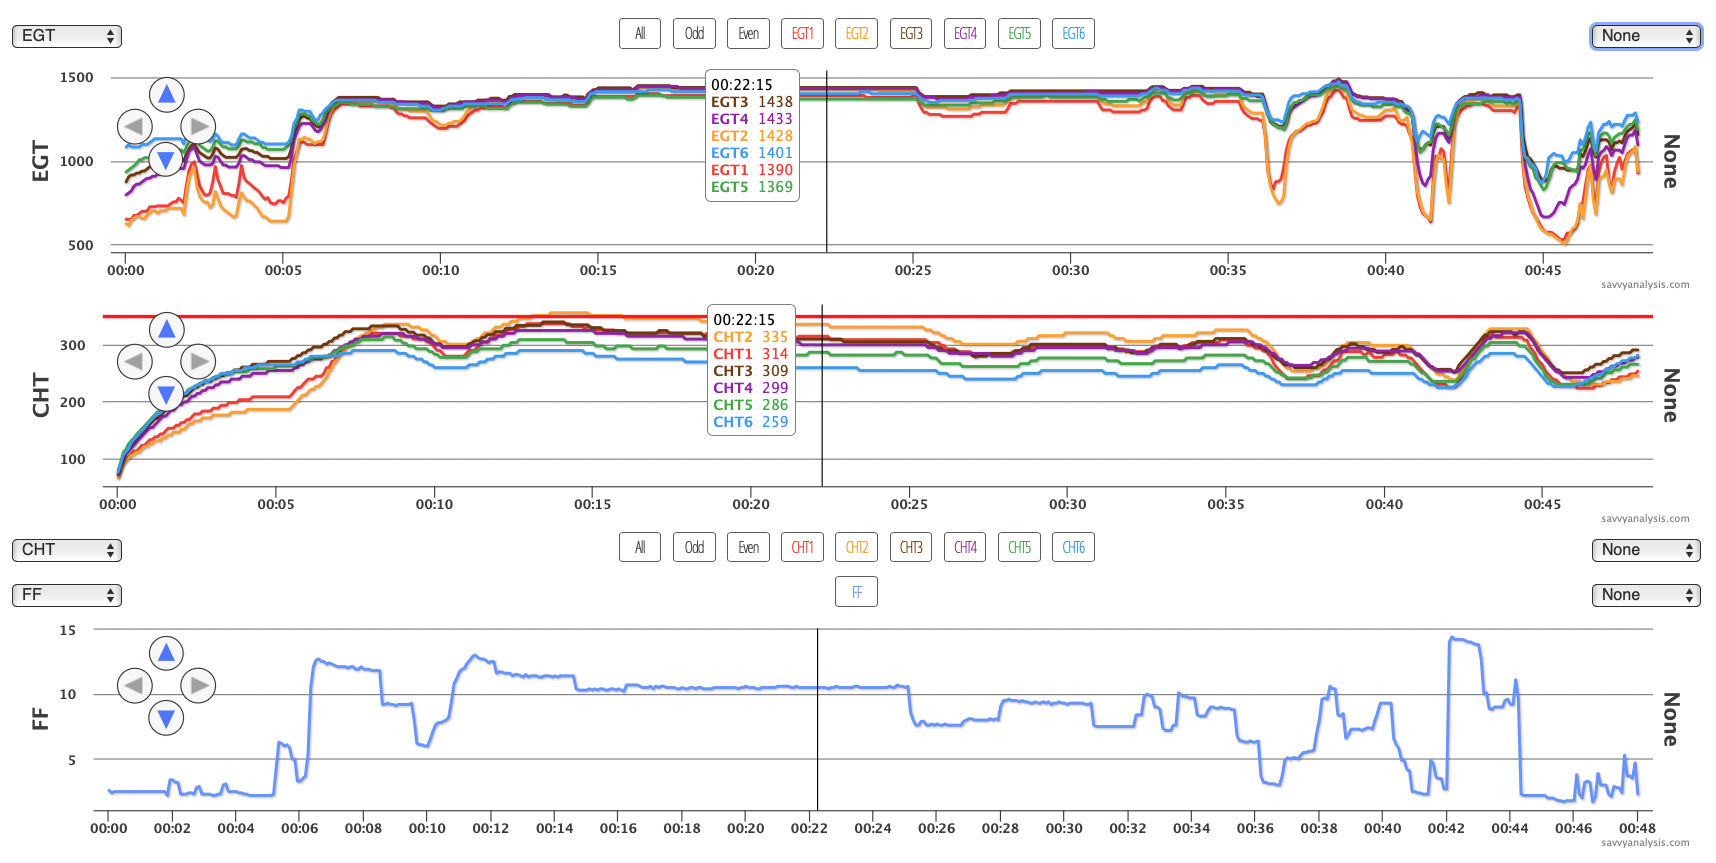
We start this month with data from a Piper Comanche with a Lycoming O-540-A1D5 engine and data from a JPI 830 with a 6 sec sample rate. Here’s data from a cruise flight before the event with EGTs on top, then CHTs and FF.
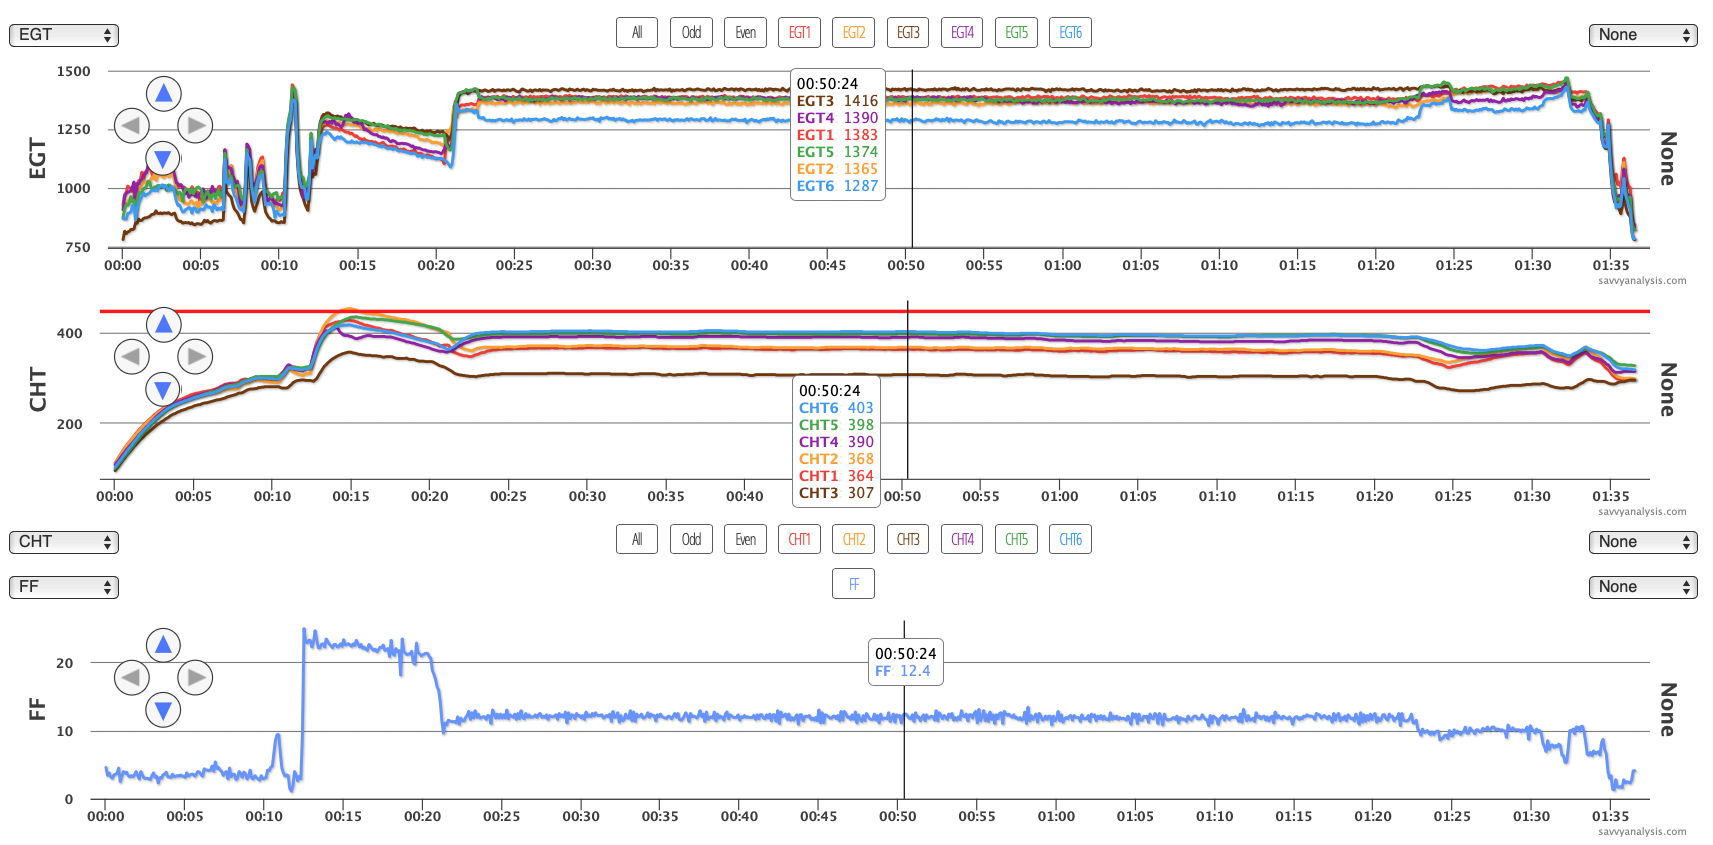
Cruise CHTs are higher than we like to see. EGT 6 is low throughout but does rise a little at 1hr 22 mins when FF is leaned, so it may just be the richest cylinder. CHT 3 is low and might be a gasket probe because the 830 is not a primary gauge. Other than that things look pretty good. Then on the next flight this happens…
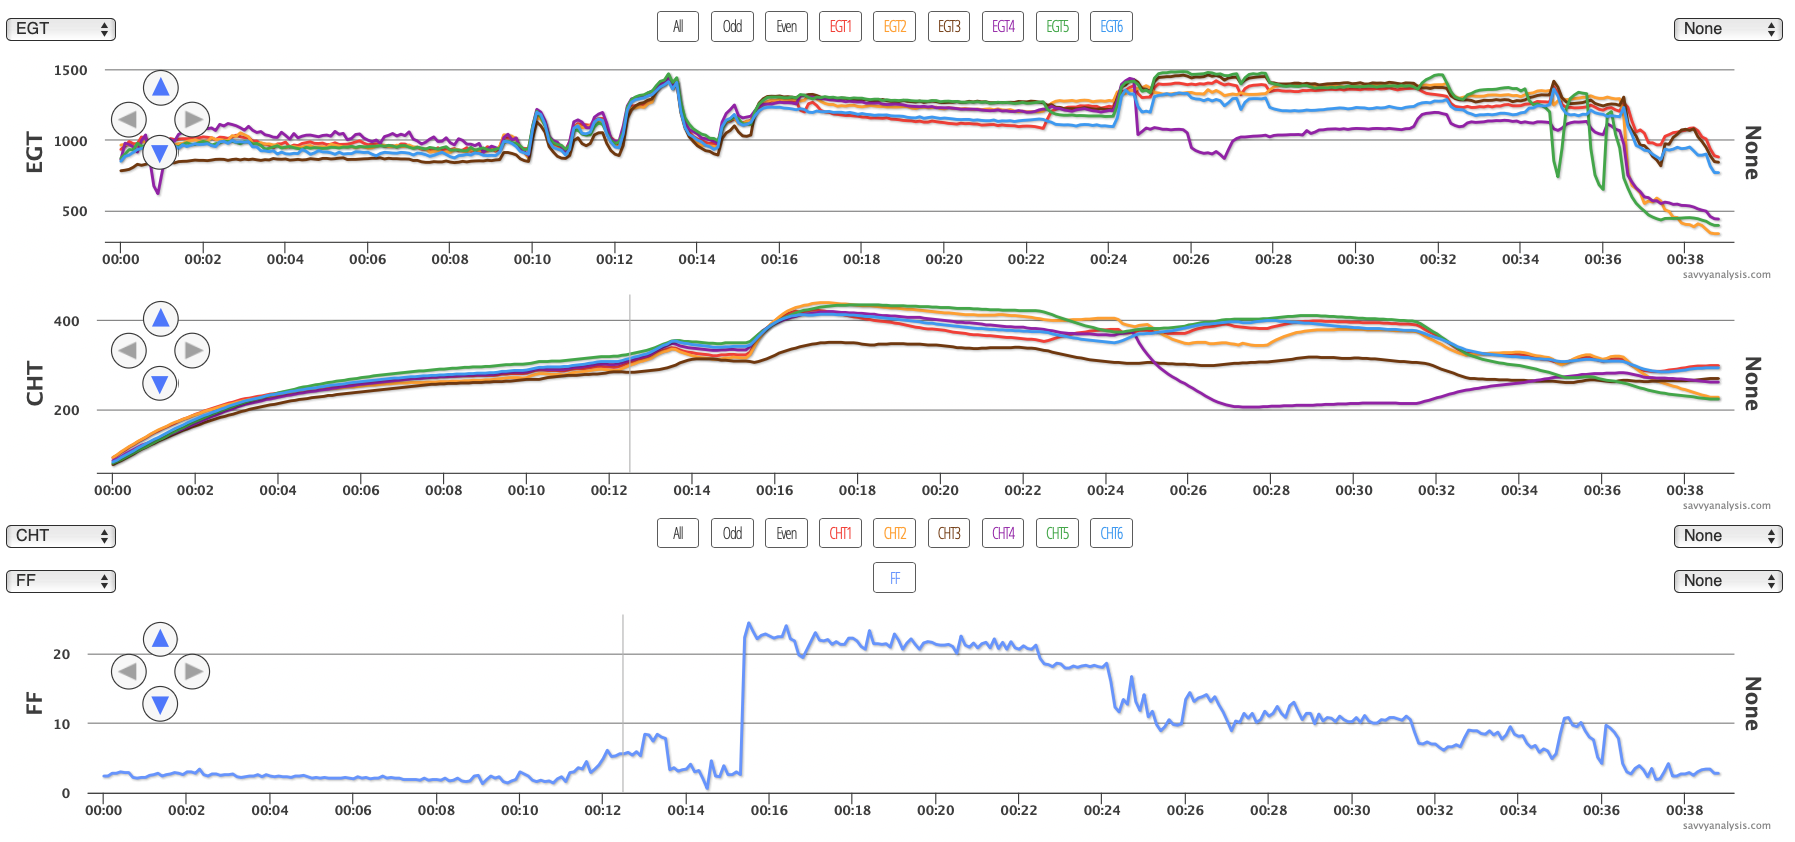
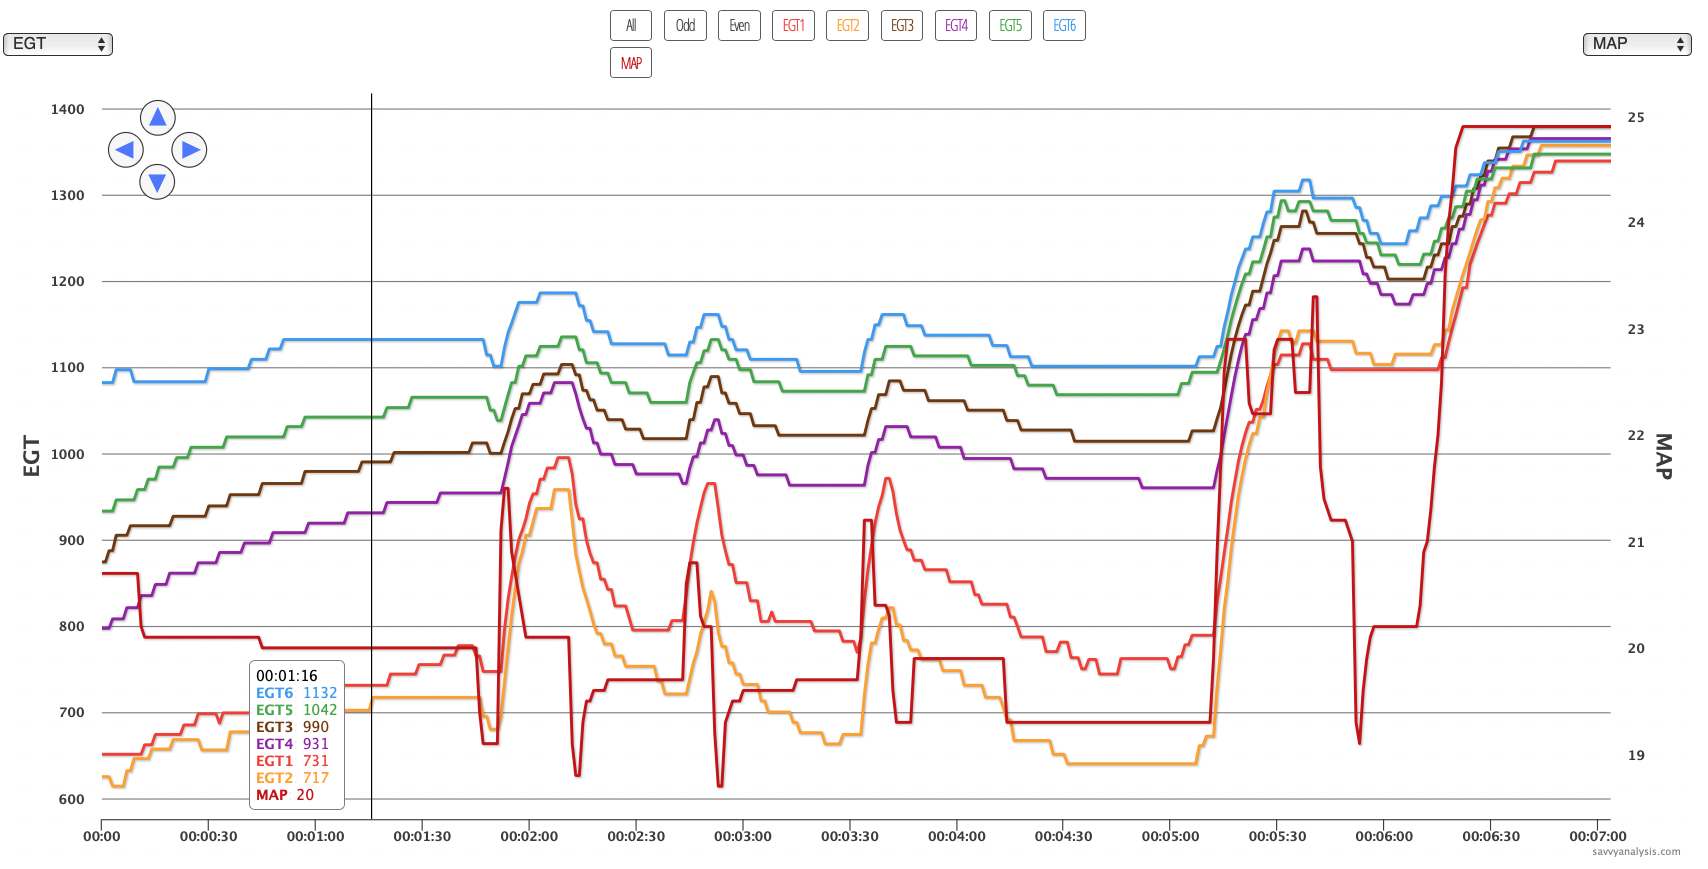
EGT 4 was a little jumpy for the first 9 mins and had one dip about a minute after engine start. Then it looked normal until the 24 min mark when cyl 4 stops making power. If the exhaust valve had stuck closed, we should see EGT drop a lot more – because no gas is escaping into the pipe past the probe. If the valve stuck open we should see that in MAP, and we do. Here’s the event zoomed in to the 24 min mark with MAP displayed in dark red. The MAP scale is on the right side Y axis.
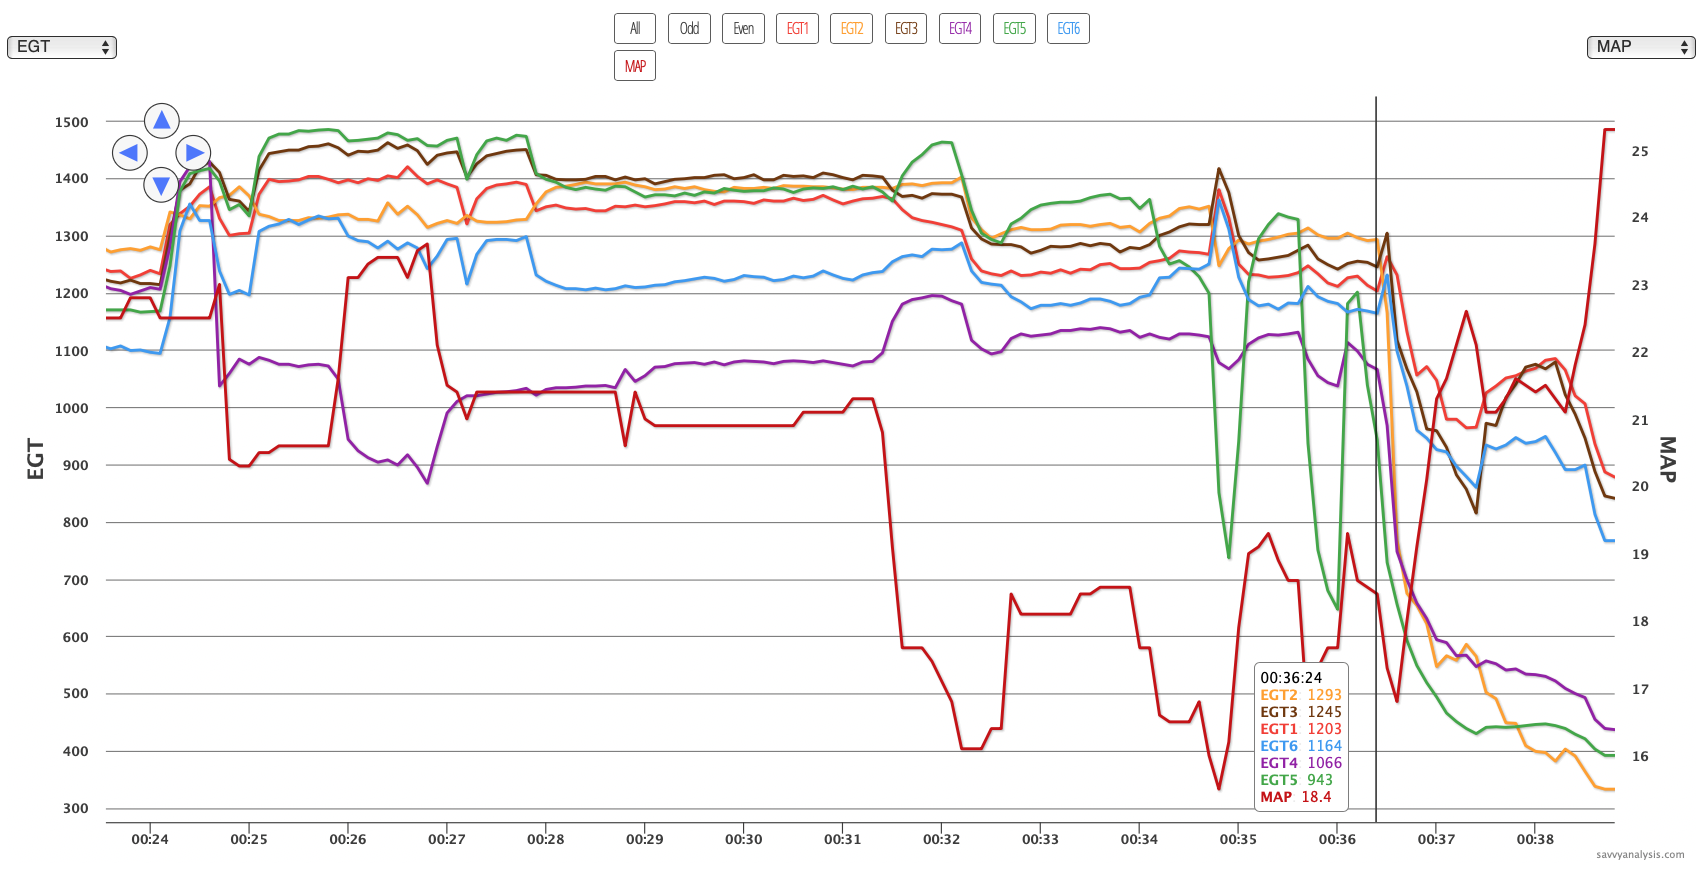
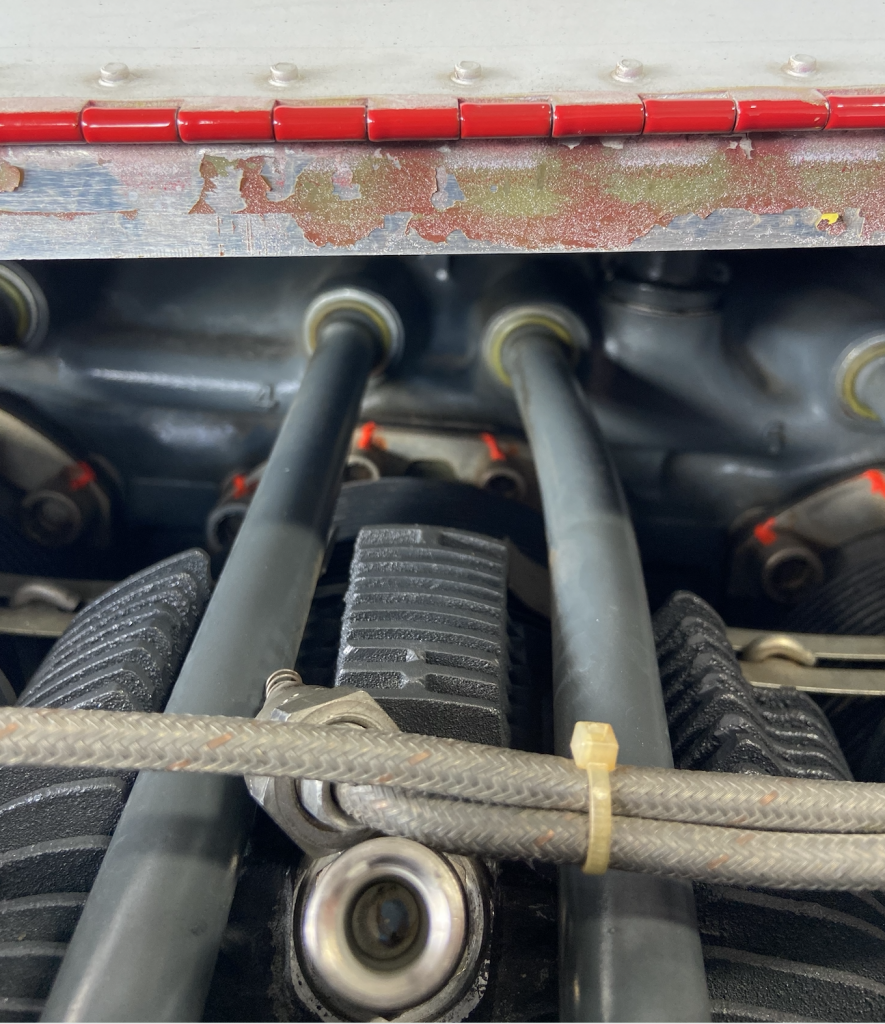
Even when the throttle is closed for landing it’s still pulling 18.4″ of MAP. It should be more like 12-13″ with the throttle closed. When the cowl and valve covers were removed, it was easy to spot the problem. The retainer clips were lying inside the valve cover, so the valve was free to travel – or not. But there was evidence of a struggle between the valve and the pushrod before the valve triumphed. In case you’re new to this, that bent tube on the right isn’t supposed to be bent.
Next up is data from a Cessna 172 with a Continental IO-360 and data from a JPI 830 with a 2 sec sample rate. EGTs on top, then CHTs and FF.
EGTs and CHTs for cyls 1 and 2 are low when power is low. Looking back through the data, this wasn’t a new pattern – it had been there for a while. When a bank of cylinders moves together, we suspect an induction leak. When it’s one from each side, it’s a harder case to make, but it could be that the intake gaskets of each induction tube are leaking. When it’s one from each side and it’s the closest to the induction airbox, and induction is ok further downstream, it’s a tough case to make.
Could it be two stuck valves? And they only stick at low power? And the stickiness correlates pretty well with small changes in FF? That seems even less likely. What can MAP tell us? Here’s the same data zoomed into the first seven minutes with EGTs and MAP displayed.
MAP is 20″ with FF at idle. Despite the arguments against it listed above, we think that’s enough evidence to explore for an induction leak.
A few months ago I wrote about wavy patterns in the CHT traces and connecting them with cooling issues. The theory isn’t as simple as every oscillation of the nose causes a rise or fall in CHT. But when we see a wavy pattern in CHT we often see an oscillation in altitude. Here’s an example. This is a 24 minute cruise segment from a Cessna 340 with Continental TSIO-520 engines and data from a Garmin 500 with a 1 sec sample rate. This is L CHTs, GPS altitude in green and Heading in red, and R CHTs.
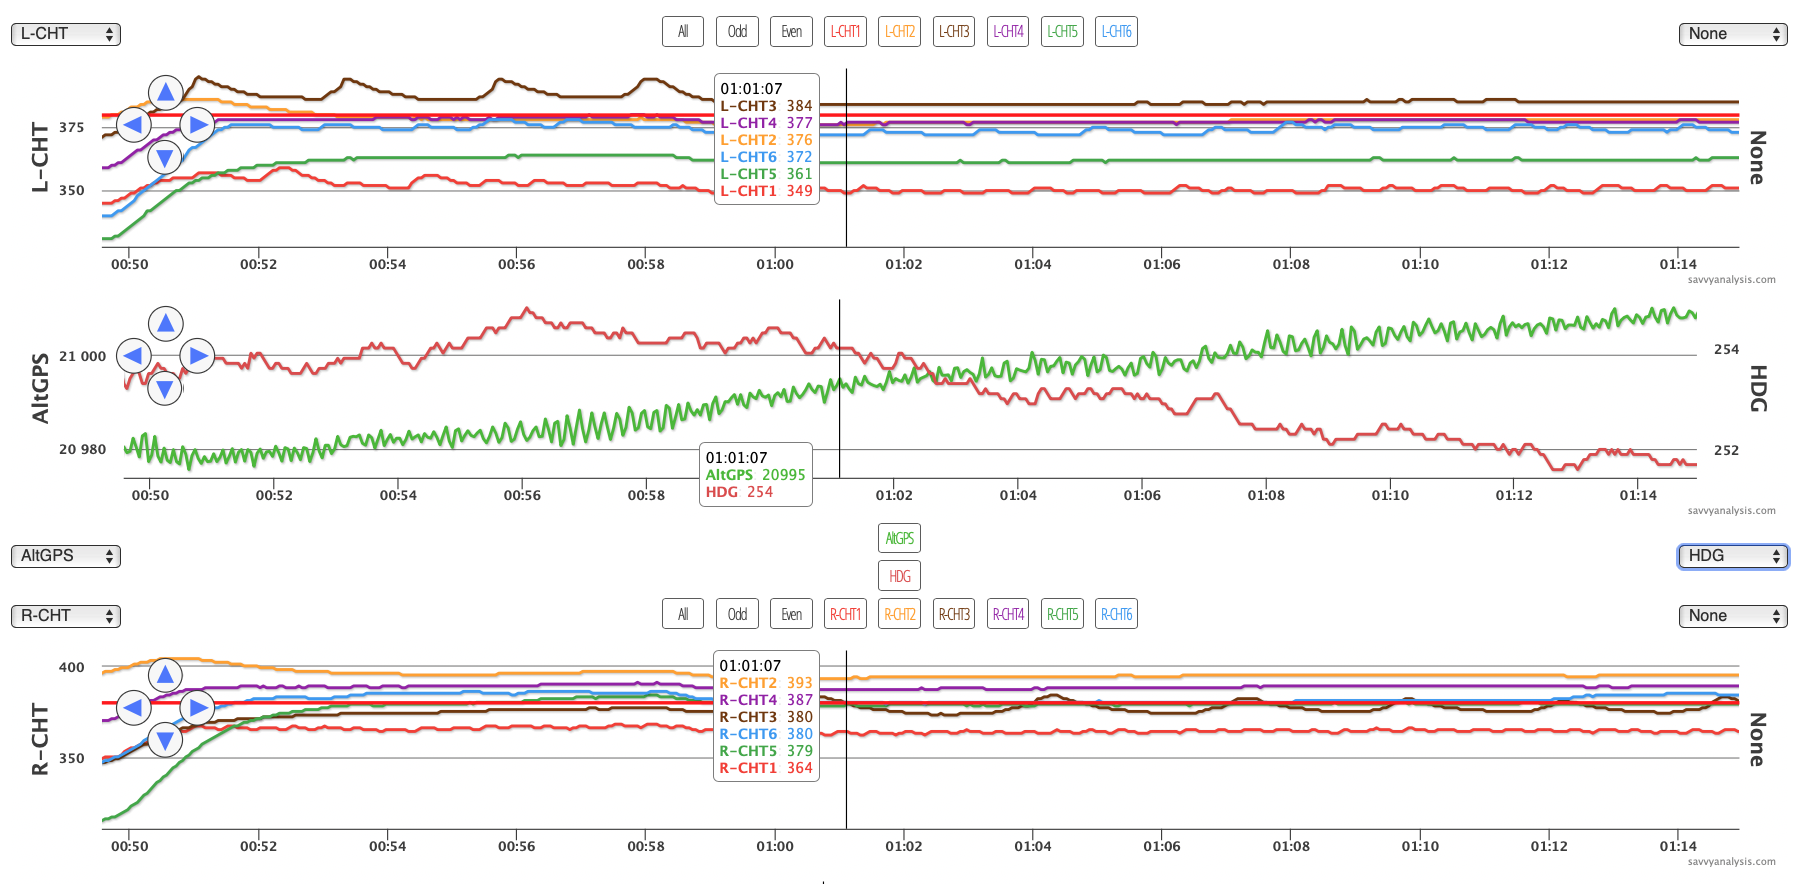
ALT and HDG don’t change much, but with power steady they’re the only thing that’s changing as the waves in the CHTs traces come and go.
We’ll end this month with data from a Mooney M20 with a Lycoming IO-360 and data from an EI CGR-30P with a 1 sec sample rate. EGTs, CHTs and FF. Nothing special about where the cursor is placed – just getting it out of the way. The event happens at 01:10 in the timeline.
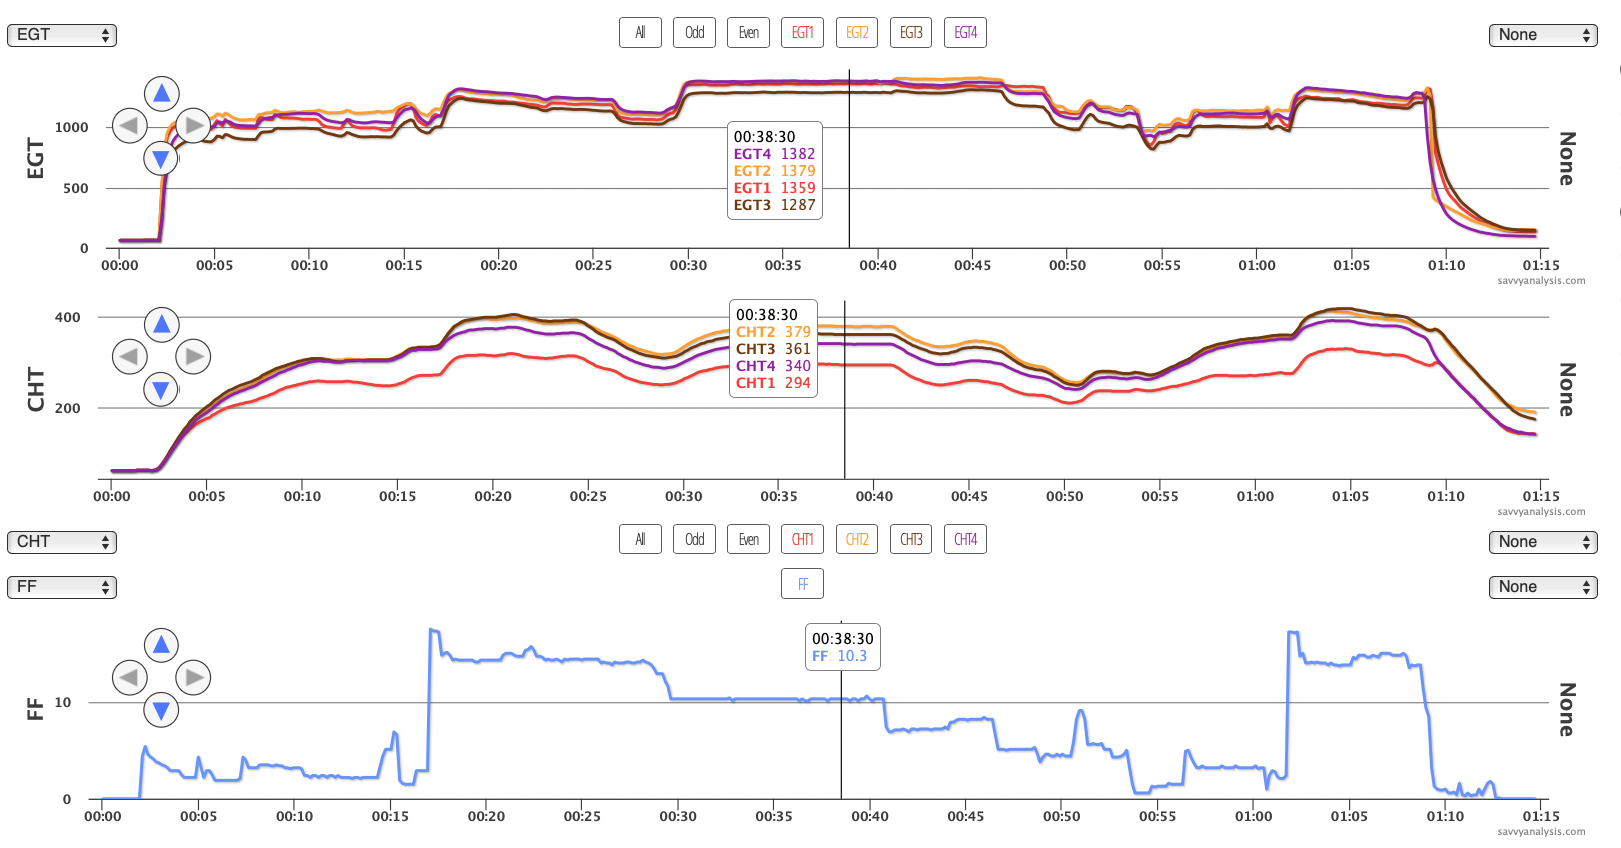
Here’s the event.
And here’s altitude and oil pressure for the whole flight, with the cursor on the event.
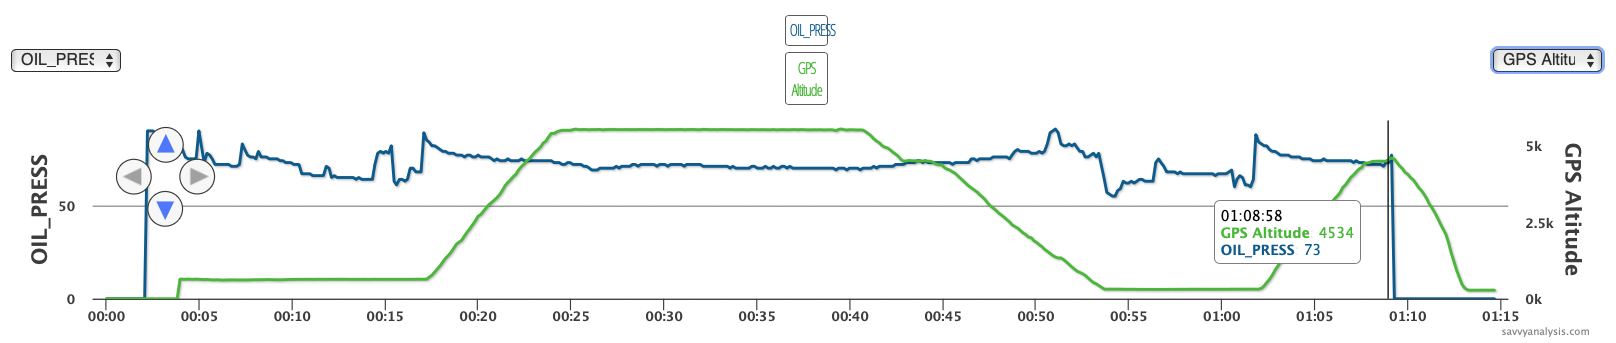
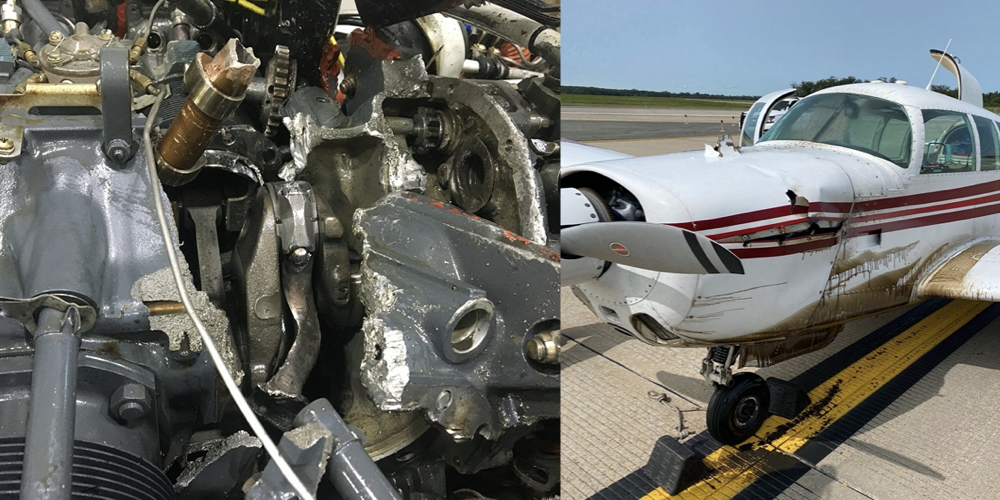
There’s a takeoff at about 16 mins, an approach and landing at about 53 mins, then another takeoff just after the 1hr mark. A few minutes later cyl 4 suffers a catastrophic failure and oil pressure drops to zero. Kudos to the pilot for flying the airplane and getting down safely.
After an event like this we’re often asked “Did the data show any indication that this was about to happen?” In the first case this month – the sticky valve on the Comanche – there was a hint of trouble in the EGT 4 pattern during taxi-out. It’s probably safe to say that most of us wouldn’t have taxied back to the hangar based on that alone – in fact it’s easy to spot the jumpiness after the fact, but not as easy in real time. But this Mooney data looks pretty good right up until the event.
