Yep, I’m angling for the award for best mis-appropriation of a Latin maxim. The real phrase – de gustibus… – translates literally to “regarding tastes, it should not be disputed” which in common usage has become “there’s no accounting for taste.” If we took it literally, a lot of film, music, food and other critics would be out of work. If we took my mis-appropriation literally and never questioned the data we get from the Master Bus or other parameters tracked by engine monitors, yours truly and other analysts would soon close up shop.
Every day we get a little closer to the point where computers can look at engine data and draw conclusions. But there are lots of variables that humans can quickly observe and calculate that so far keep us a step ahead of an app. For instance, did this anomaly happen before or since the event in question, is it getting worse over time, what’s the power setting or flight condition when it occurs – or not, is this even possible given the laws of thermodynamics, what other data can we use to corroborate or refute what we’re seeing, given that not every airplane logs every parameter.
It has become a January tradition for me to re-state the mission of this monthly column, so here it is again. The goal will continue to be helping pilots recognize data anomalies in real time to make good decisions about the safety of the flight, and helping owners to make informed maintenance decisions. With that, let’s get this decade started. It’s awards season – Golden Globes, SAG Awards, Grammys, Oscars – so I have some awards to hand out.
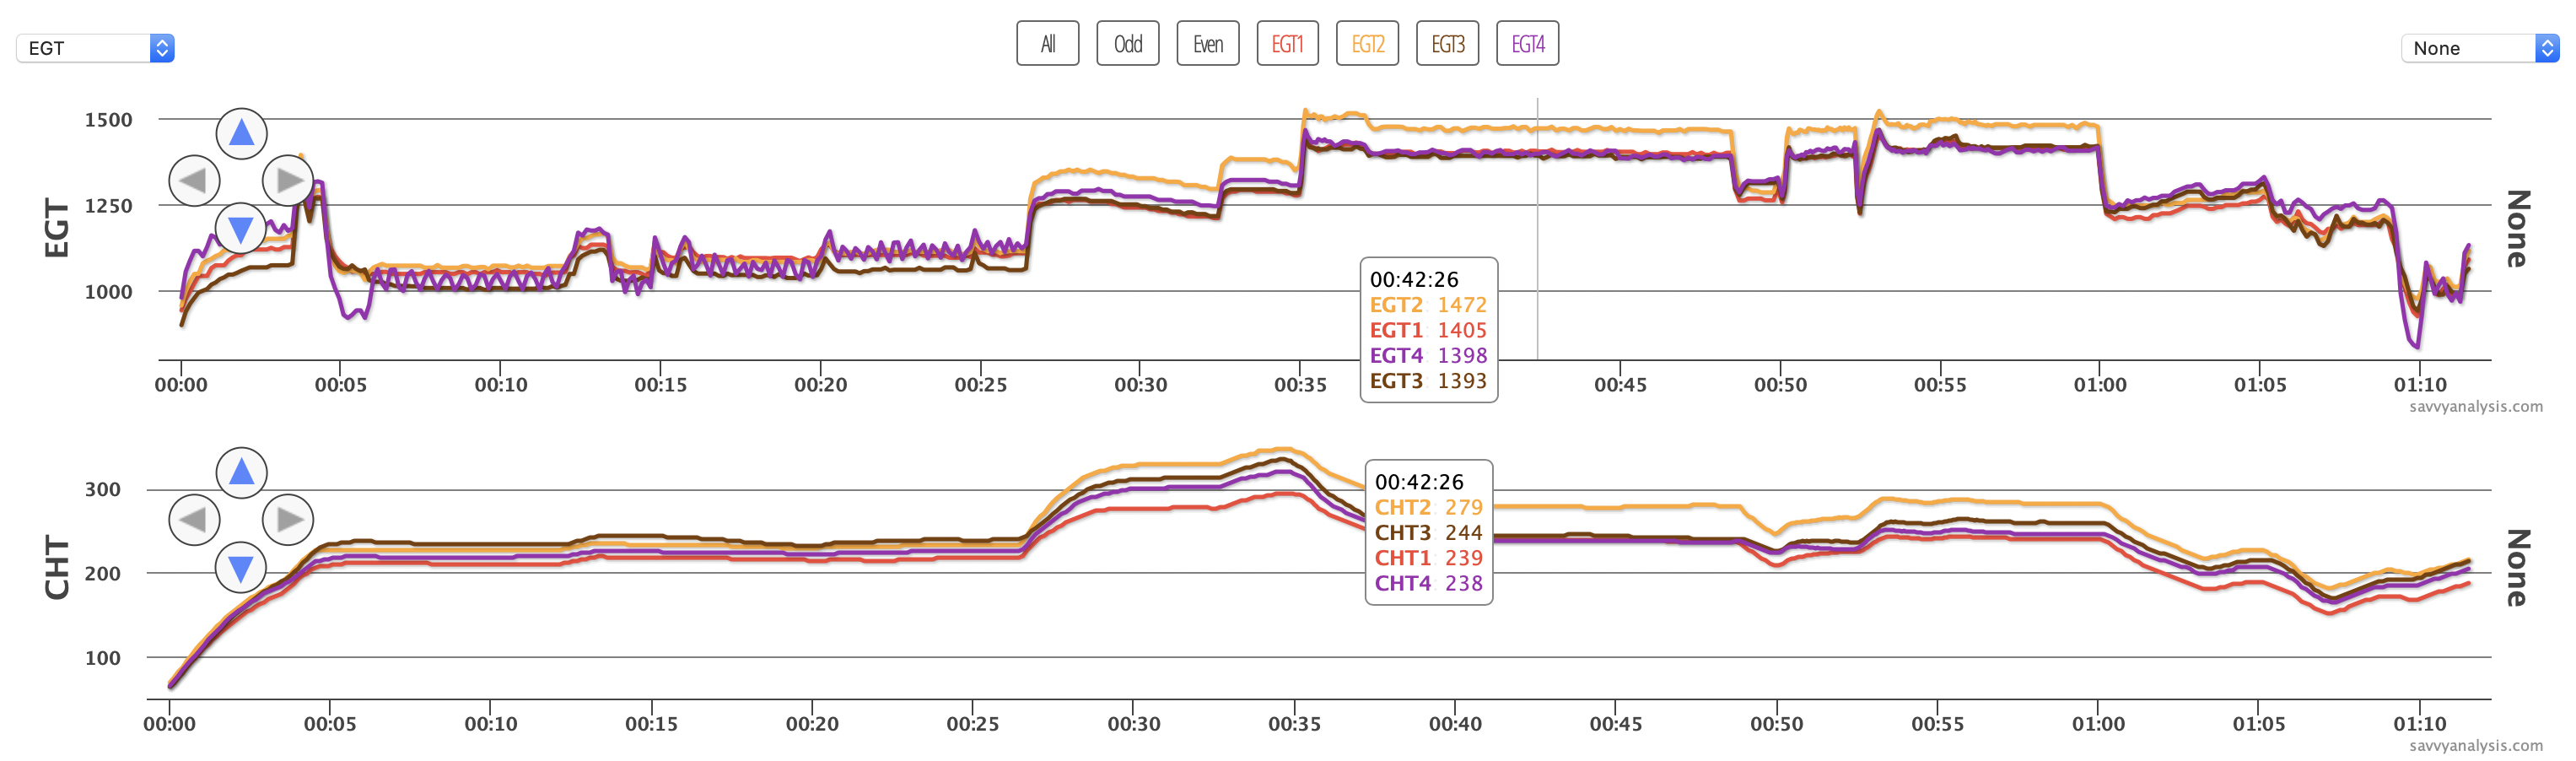
First up is data from a Cessna 206 with a Continental IO-550 engine using an Insight G3 with a 1 sec sample rate. EGTs on top, then CHTs then FF. Here’s the full flight.
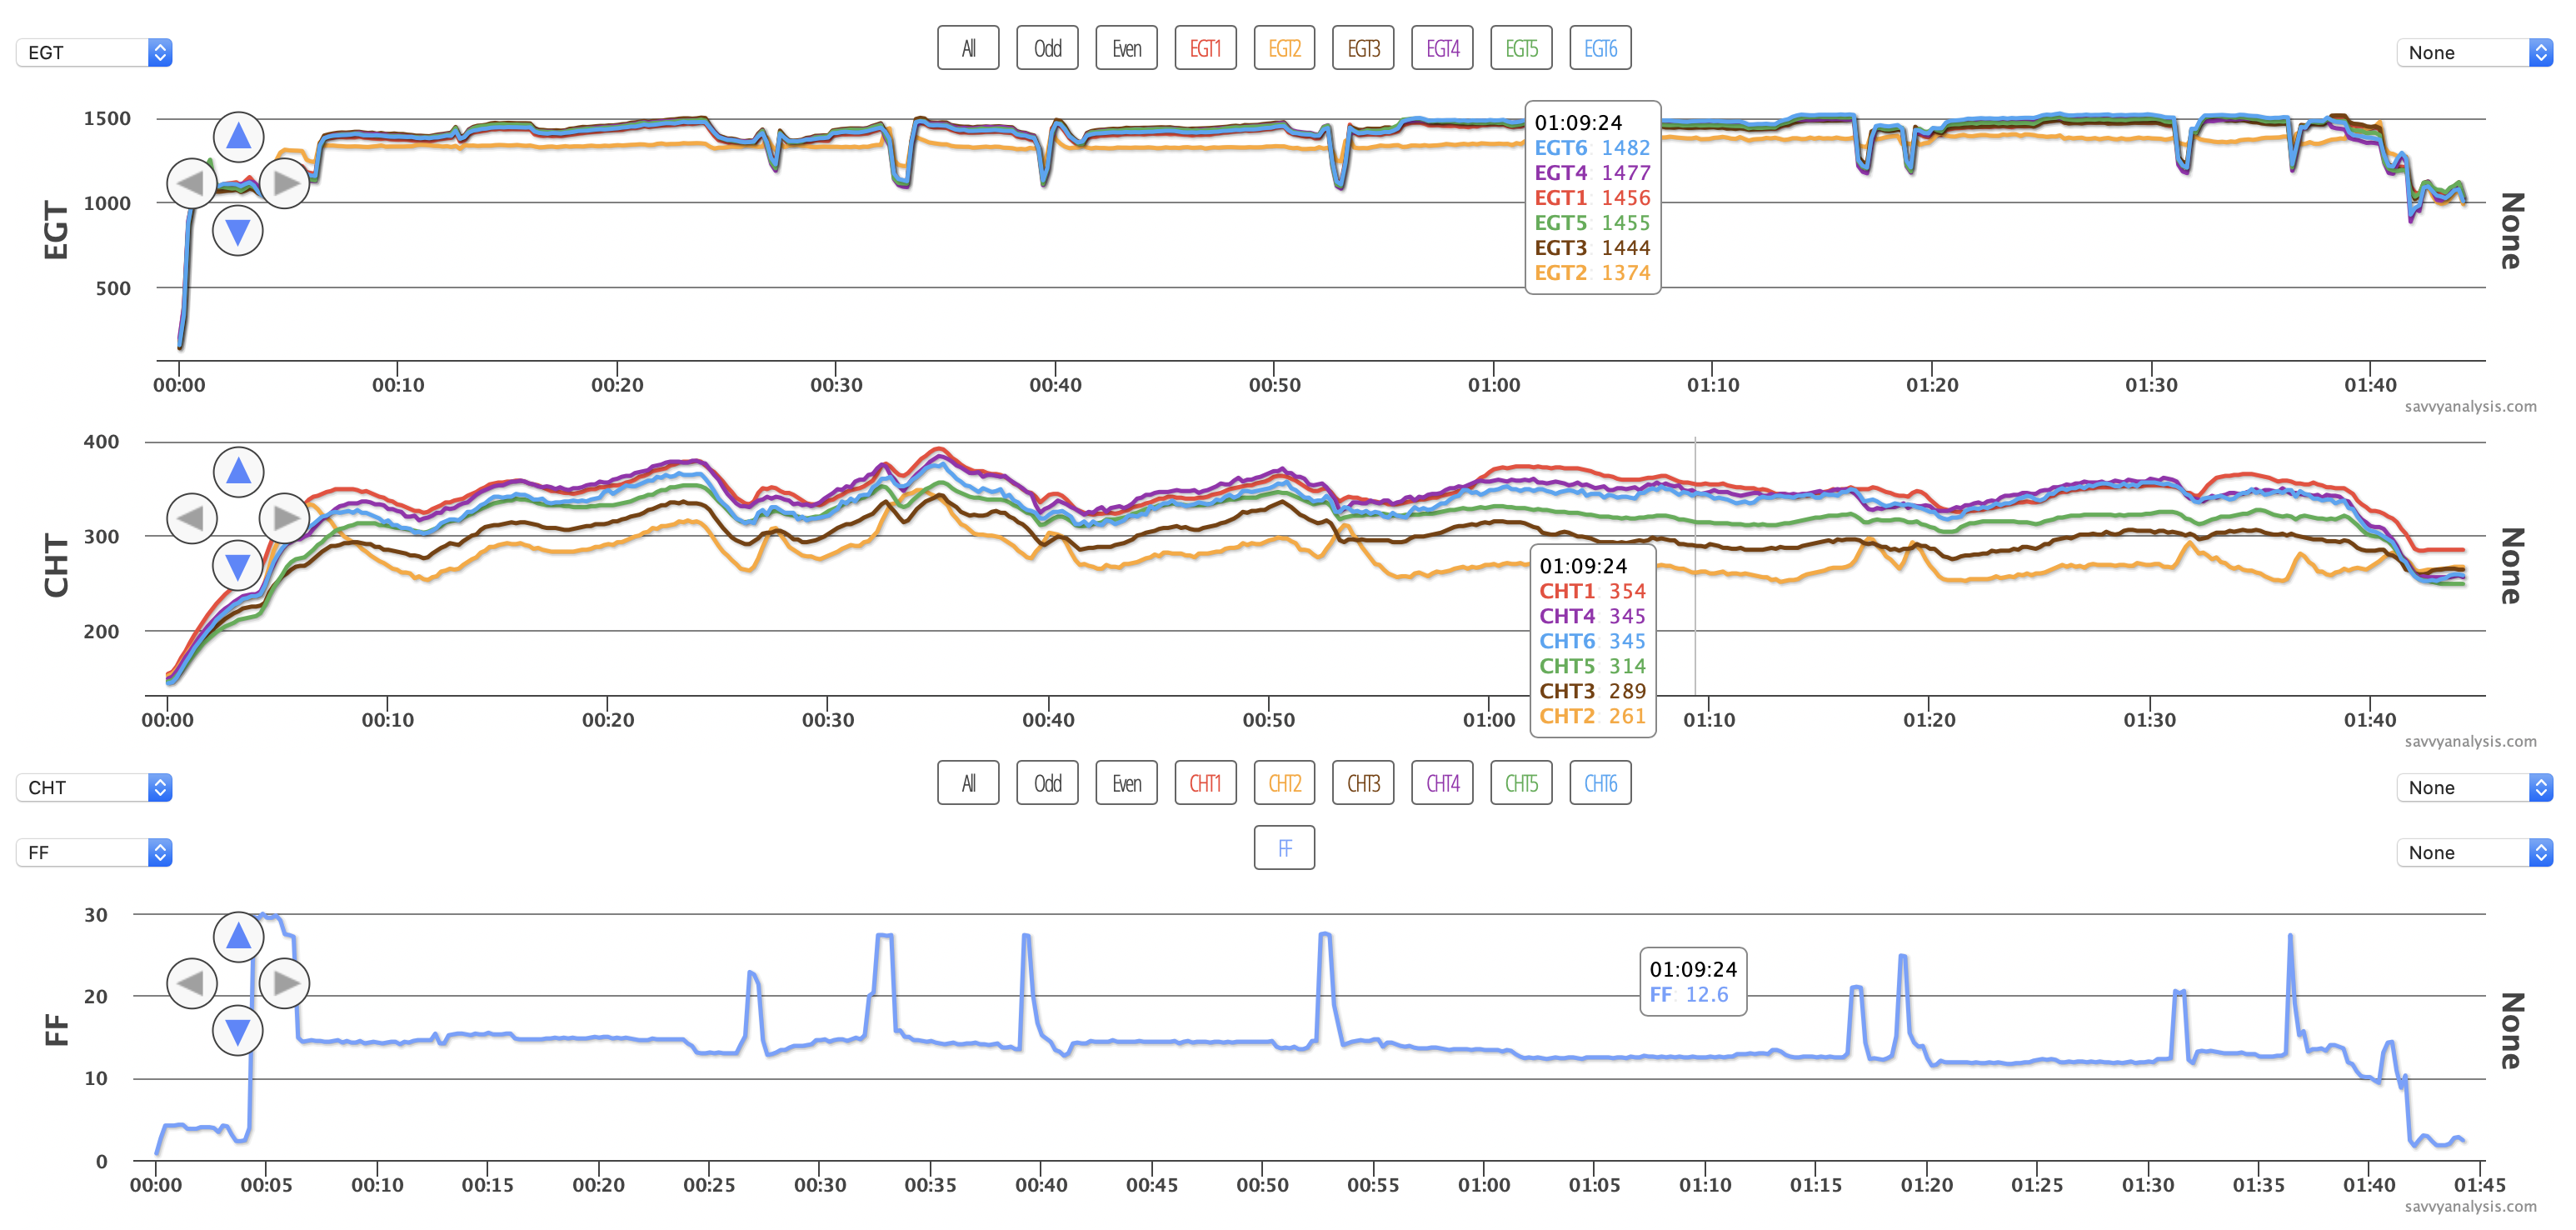
The issue is the gold traces of cyl 2. On this full view you can see both are low when FF is low, then both rise when FF rises – it’s a little hard to see that at takeoff so here’s a zoomed in version.

As frequent Puzzler readers know, high CHT and EGT at max FF, then lower CHT and EGT when FF is reduced are textbook symptoms of an injector clog. Frequent readers also know we like to corroborate our theories whenever possible, even though this one looks textbook. Let’s use one of those mixture pulls as a GAMI sweep.
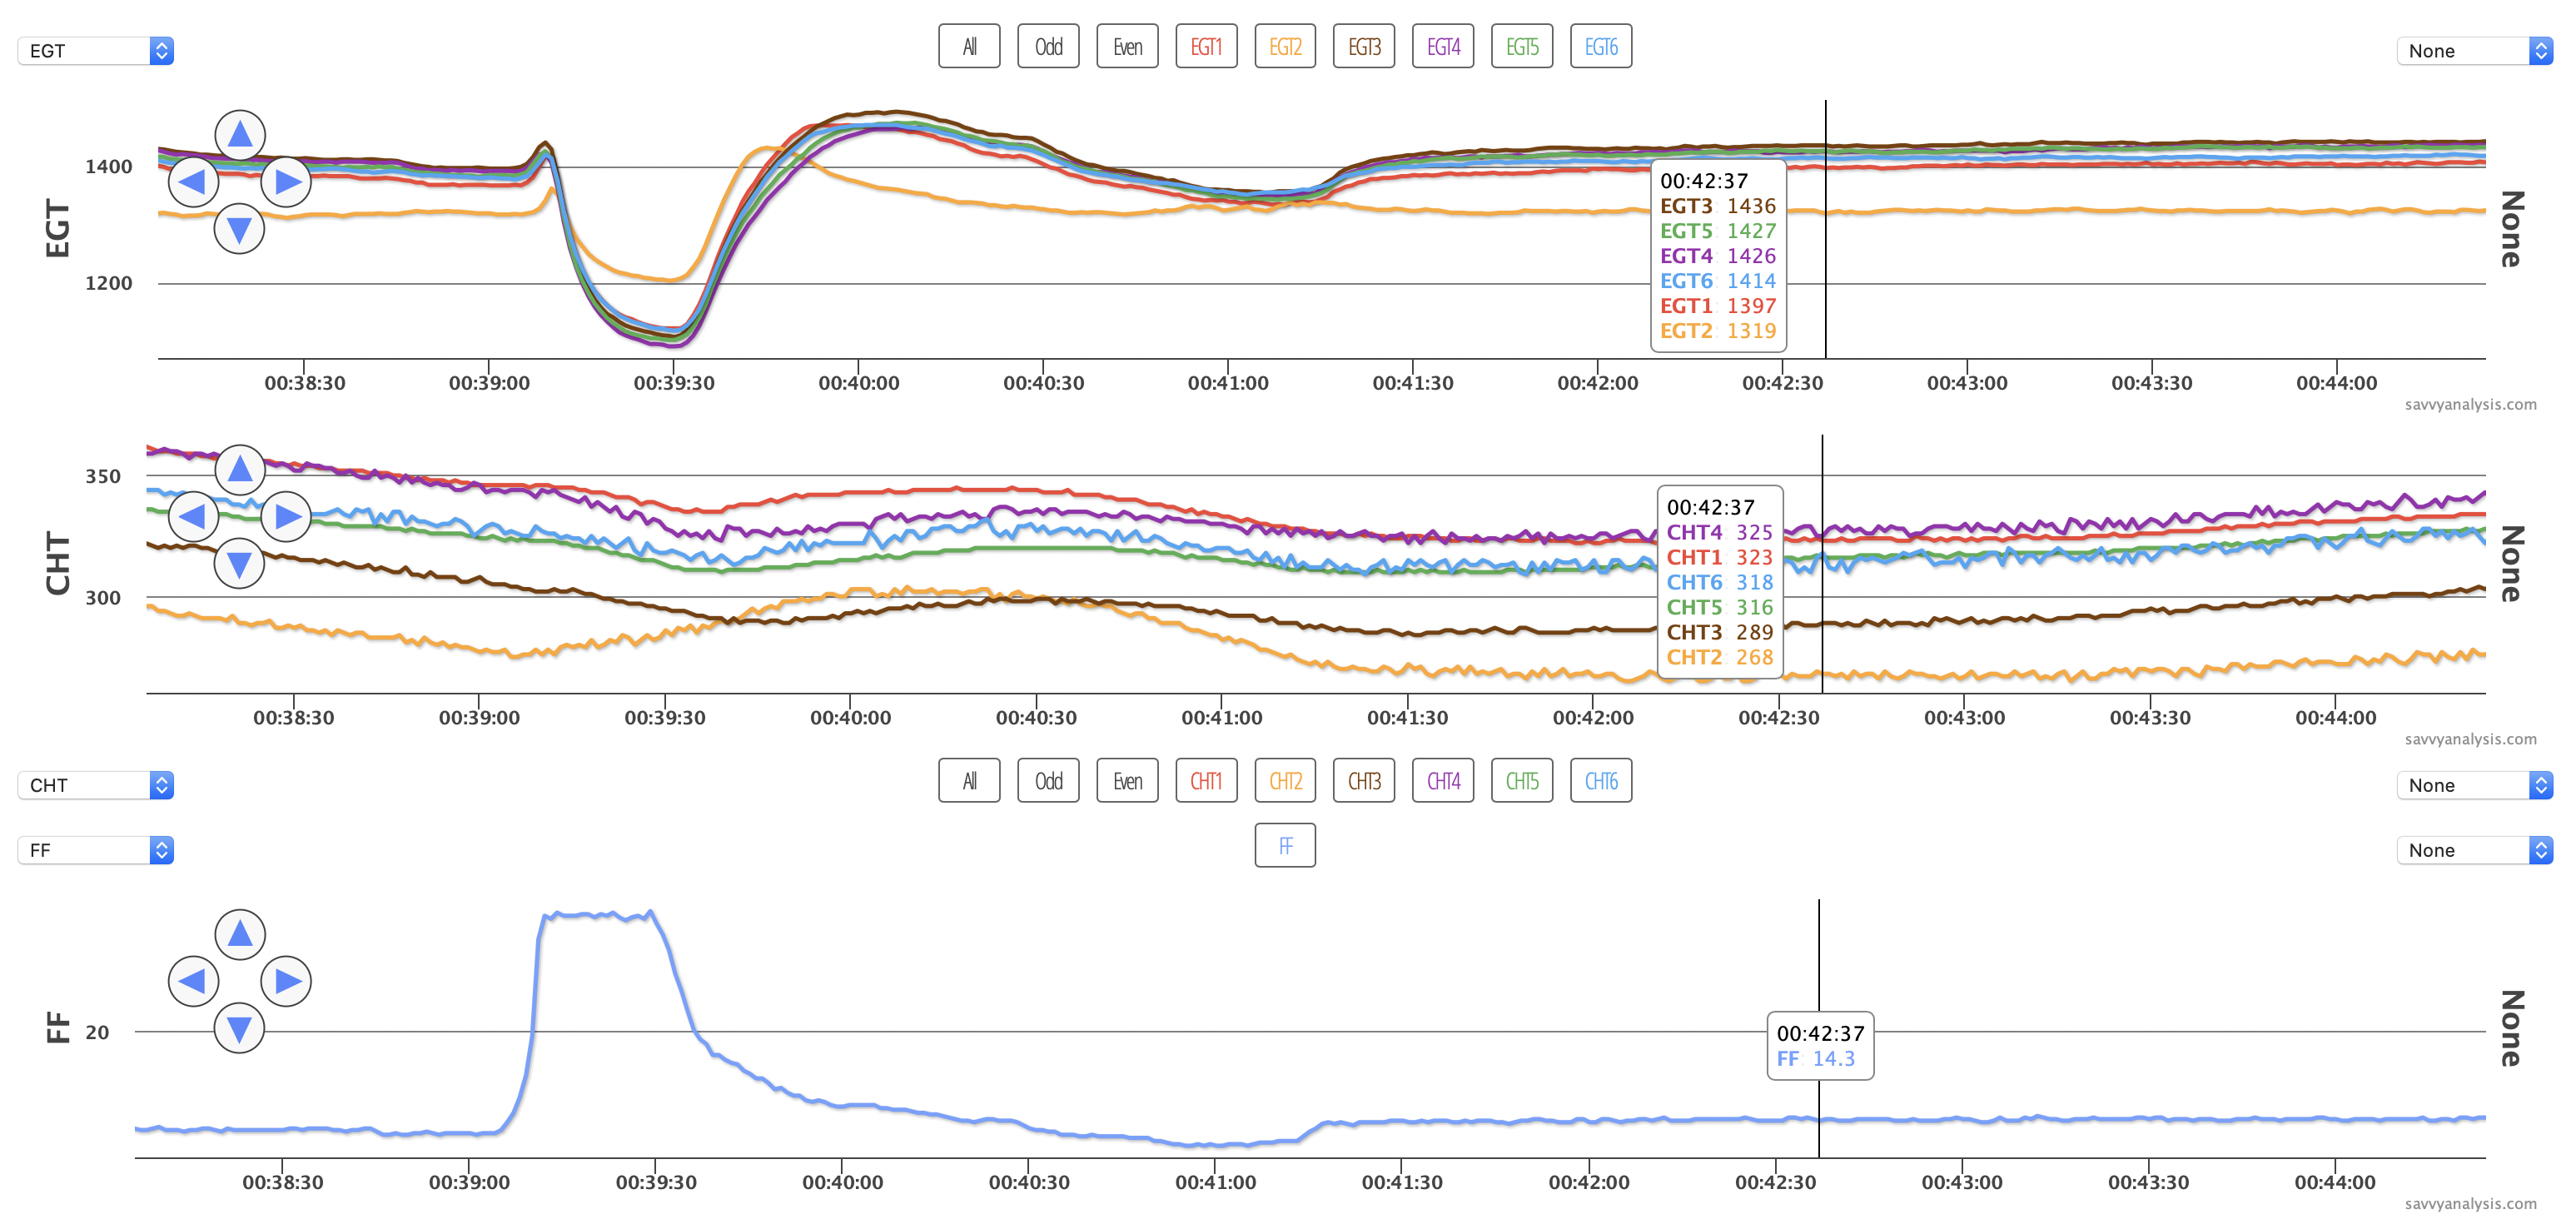
As FF is reduced, EGT 2 peaks well ahead of the others, which confirms our theory. Cleaning injector 2 should improve mixture distribution, and this one wins the award for best textbook depiction of a clog.
Next up is data from an SR22 with a Continental IO-550 and the Tornado Alley turbo mod, using a Garmin Perspective with a 1 sec sample rate. EGT, CHT and I have added %HP to the FF rank.
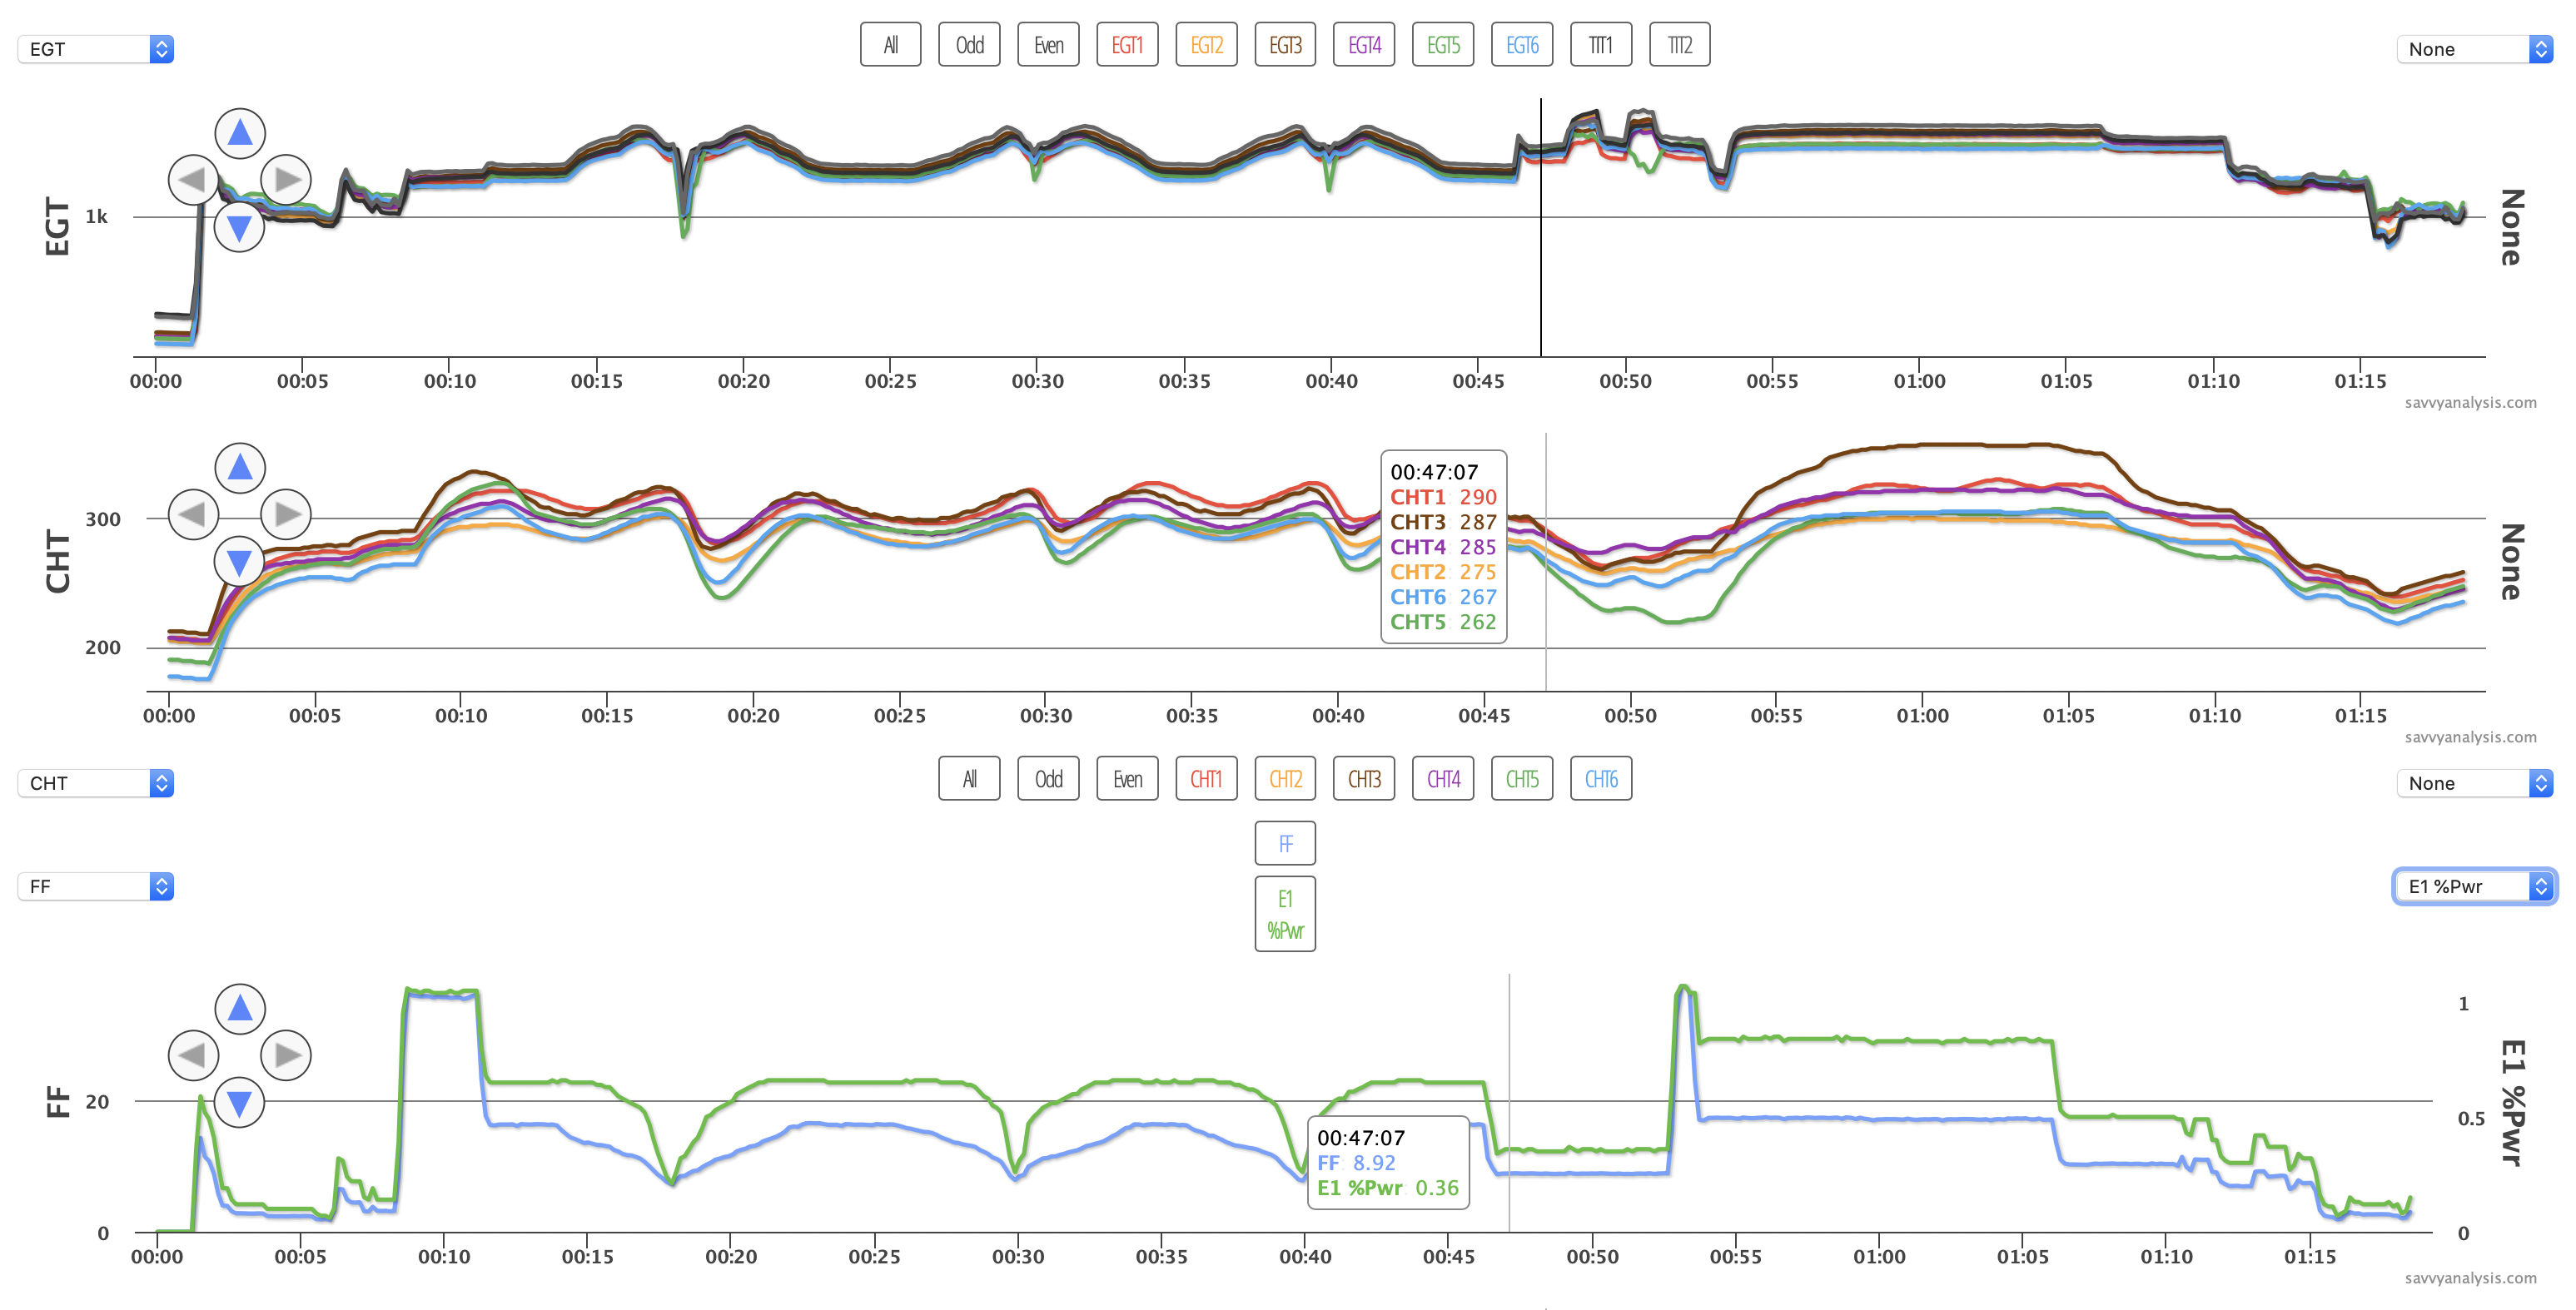
There’s a nice set of mixture sweeps to the left of the cursor, then the telltale humps of a LOP mag check to the right of the cursor. Even at this resolution you can see that the green trace of EGT 5 drops lower than the others in the sweeps, as does CHT 5. Data shows it’s not really a lean outlier, but it did post the leanest peak (barely). Here’s a sample —
Time: 00:37:07-00:39:28
EGT5 peaked at 11.69
EGT1 peaked at 11.68
EGT3 peaked at 11.64
EGT6 peaked at 11.46
EGT2 peaked at 11.32
EGT4 peaked at 11.32
GAMI spread is 0.4
Notice FF and %HP during the mag check. If you had bet me a beer that this engine would run on 8.92 GPH I would have been buying the beer. But it’s loping along there at 36% power. It’s worth noting that %HP really drops off fast as mixture gets really lean – it’s not as linear as the FF trace.
Now let’s zoom into the mag check. First mag is the R – firing the tops of 2-4-6 and the bottoms of 1-3-5. So the top plug of 5 isn’t as smooth as we like to see, but the bottom plug really doesn’t like this FF setting. Neither plug of cyl 6 – the blue traces – is as smooth as we like to see, and 6 was right in the middle on the sweeps.
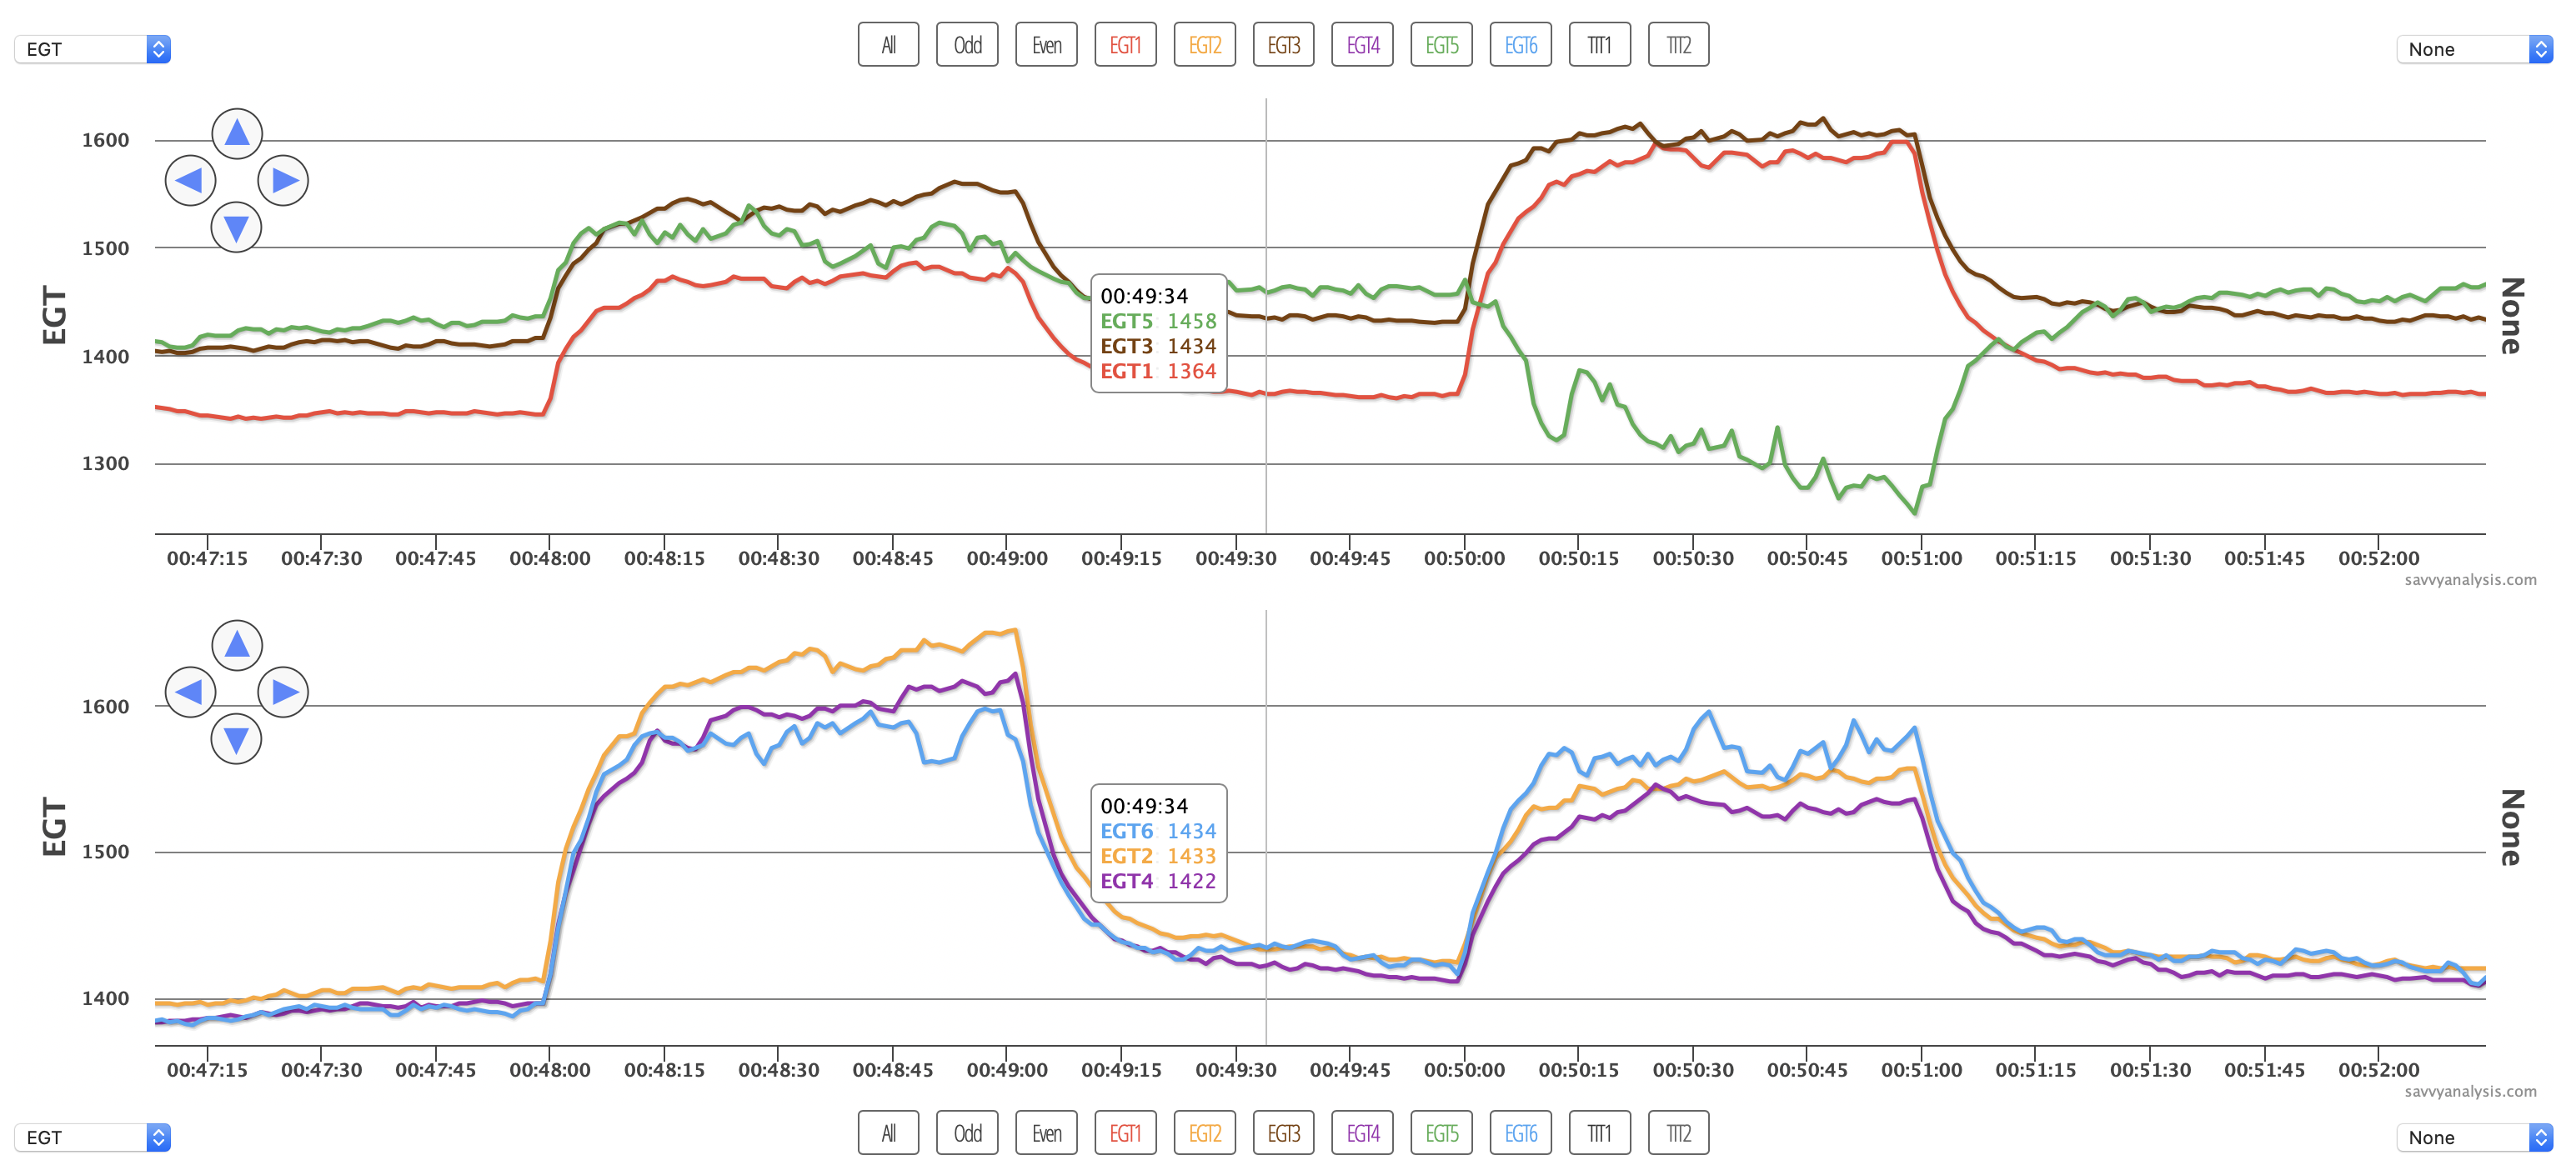
Our instructions for the test profile are to finish the last rich-to-lean sweep, then leave the mixture at the lean point for the LOP mag check. That’s what this pilot did. That’s to be sure that mixture is well lean of peak to – purposely – stress the ignition system. In a case like this where distribution is good, that leaves you with a very lean setting for the mag check. It might be lean enough that we’re inducing or promoting weak spark, not just observing it.
It’s not clear that cleaning injector 5 would get us anywhere, and before recommending checking plugs and harnesses for cyls 5 and 6, we’d probably ask for another mag check with FF in the 11-12 GPH range. That’s still well LOP for this engine and should reveal weak spark if it’s there.
So this one wins the award for reminding us to amend and refine our test profile instructions, and for the leanest running 550 TN we’ve seen in a while.
Next up is data from a Cessna 177 Cardinal with a Lycoming IO-360 engine and data from a JPI 700 using a 2 sec sample rate. This is just EGT and CHT because FF isn’t logged.
Every flight uploaded by a SavvyMx, SavvyQA or SavvyAnalysis Pro subscriber is scanned for FEVA – the oscillating pattern made by a burned spot on an exhaust valve. Usually we see the pattern in cruise flight, but this one caught our attention because of the nasty sawtooth pattern during ground ops before flight. Before we point the “why on earth would you take off ?” finger at this pilot, remember it’s easy to spot this pattern in the data once it’s uploaded and displayed – harder to spot in real time, especially if you’re taxiing at a busy airport. There’s a runup around the 15 min mark but the pattern subsides there for a moment.
If we’re going to point the finger you could say the pilot had almost 10 minutes after the run-up to notice this fluctuation before takeoff. Then again, at my field the run-up areas are adjacent to the runways, but that’s not true everywhere. Maybe there was more taxiing to do after the run-up.
In any case, this one wins the award for reminding us all that something you notice during taxi-out might change your mind about continuing the flight.
We’ll finish this month with a Cirrus SR-22 powered by a Continental IO-550 and data from a Garmin Perspective using a 1 sec sample rate. EGTs, CHTs, then FF and GPS Altitude in yellow.
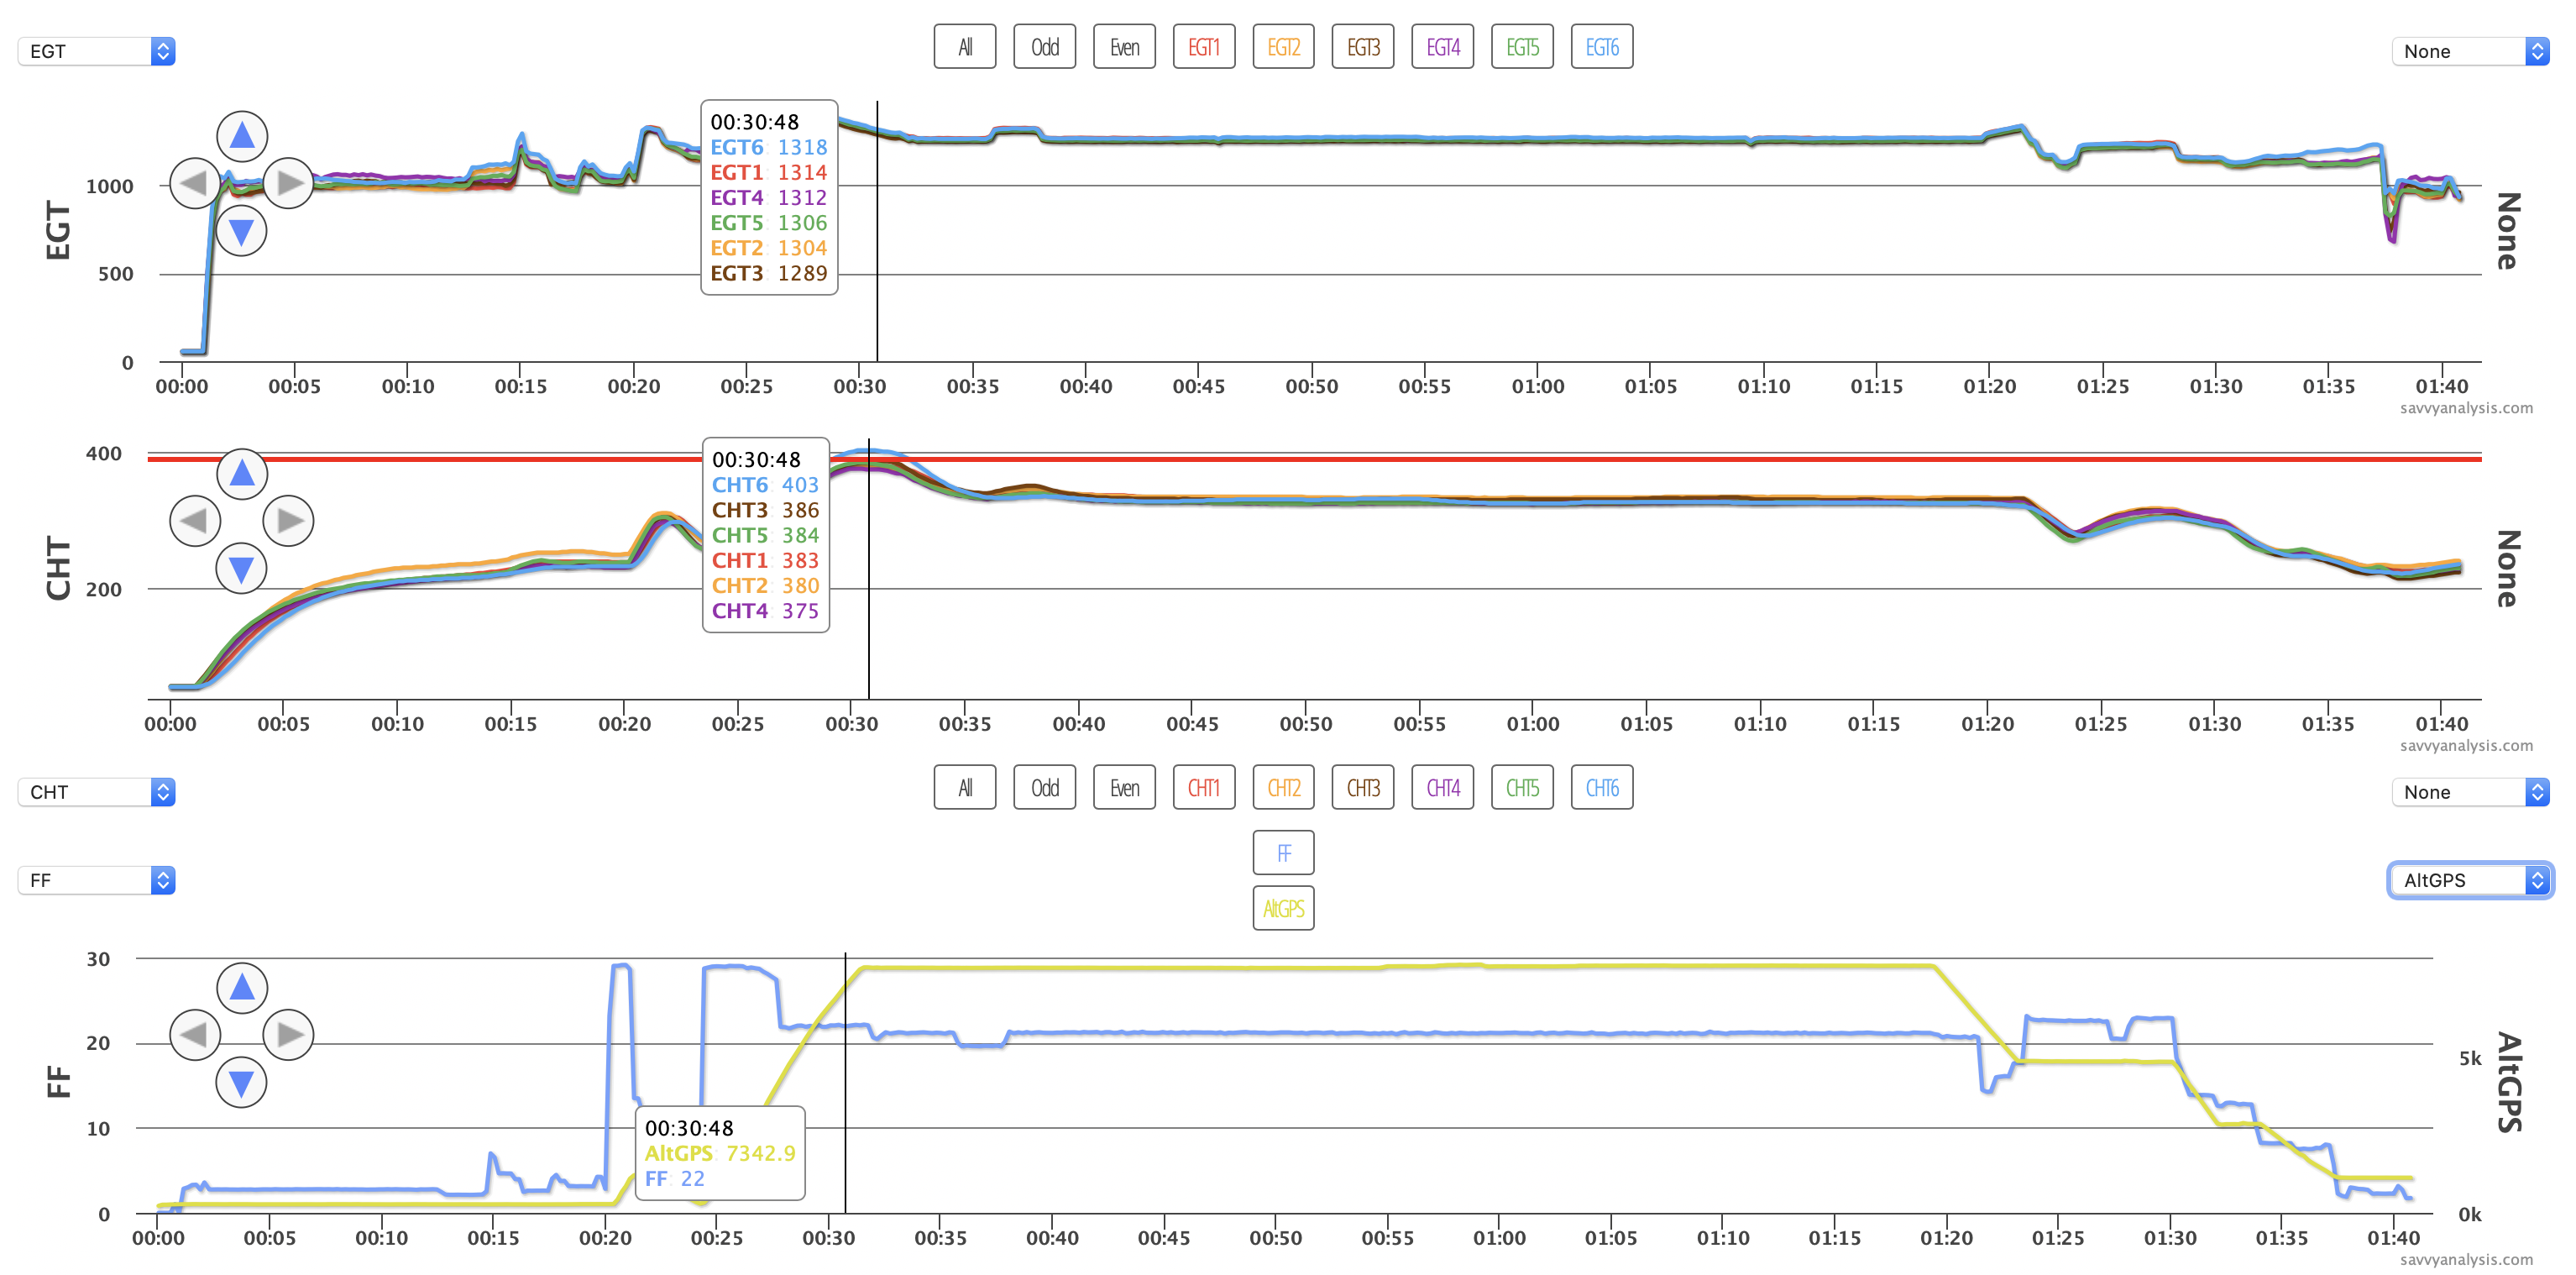
I didn’t choose this one because of the high CHT 6 where the cursor is, but since it’s there let’s go over it. Our 𝚫/t tool shows a rate of climb of about 1100 fpm. That was working until the big mixture pull at about 27 mins set FF at 22 GPH. That’s when CHTs just keep rising. But when the nose goes over, CHTs drop nicely.
And that’s why I chose this one. The EGT spread in cruise is 20º or less. The CHT spread in cruise is 20º or less. We spend a lot of time in this column on anomalies, so when everything’s working right – spark, fuel, induction, cooling – it deserves a shout out, too.
