These days it’s call throwing shade. When I came up, good jazz musicians had a nice-but-direct way of telling wanna be jazz musicians that they weren’t up to the task – “don’t give up your day gig.” Dr. Graeme Smart has a day gig – he’s the Principal Scientist for New Zealand’s National Institute of Water and Atmospheric Research. Recently he converted digitally-stored weather data into musical data, and assigned pitch ranges and instrumentation to temperature, rainfall, windspeed and direction, river levels and sea level. Obviously the artistry in this project is deciding which sound or instrument will play the fast changing data, versus which will play the occasional event, versus which will play the slow persistent cycles like sea level and temperature. It’s not my cup of tea but judge for yourself. Click to hear the results.
By now you may be thinking – perhaps even worrying – that I have taken data from my IO-520-K and converted it to music. I didn’t, but it isn’t hard to imagine. The typical flight would be consistent levels – drones – before takeoff except when punctuated with a mag check – then everything would get loud at takeoff, a bit softer for cruise, then dwindle down for approach and landing. A really good set of uniform CHTs would be close to one another but not exactly the same – kind of like the violin section of a middle school orchestra. If you heard something jump out for a solo, that would probably be bad – like a weak spark plug sending EGT high, or a destination event sending CHT high. With engine data, most of the time we’re looking for consistent data in line with expectations and specifications. So what makes for good flying makes for boring music. That’s ok, after a couple thousand hours of listening to my IO-520-K I’m used to the sound it makes and that’s music enough for me when flying over the LA basin in clouds at night. So thanks, Dr. Smart, for connecting the dots, but let’s both keep our day gigs.
Now let’s see what this month’s engine data reveals.
First up is data from a Cirrus SR22T powered by a Continental TSIO-550-K and data from a Garmin Perspective with a 1 sec sample rate. The issue was static in the radios, and the analysis request asked if we saw anything in the data that might be a clue. The layout is EGTs 1-3-5 on top, EGTs 2-4-6 are next, and FF is below that. This is the taxi-out, ending just before the runup.
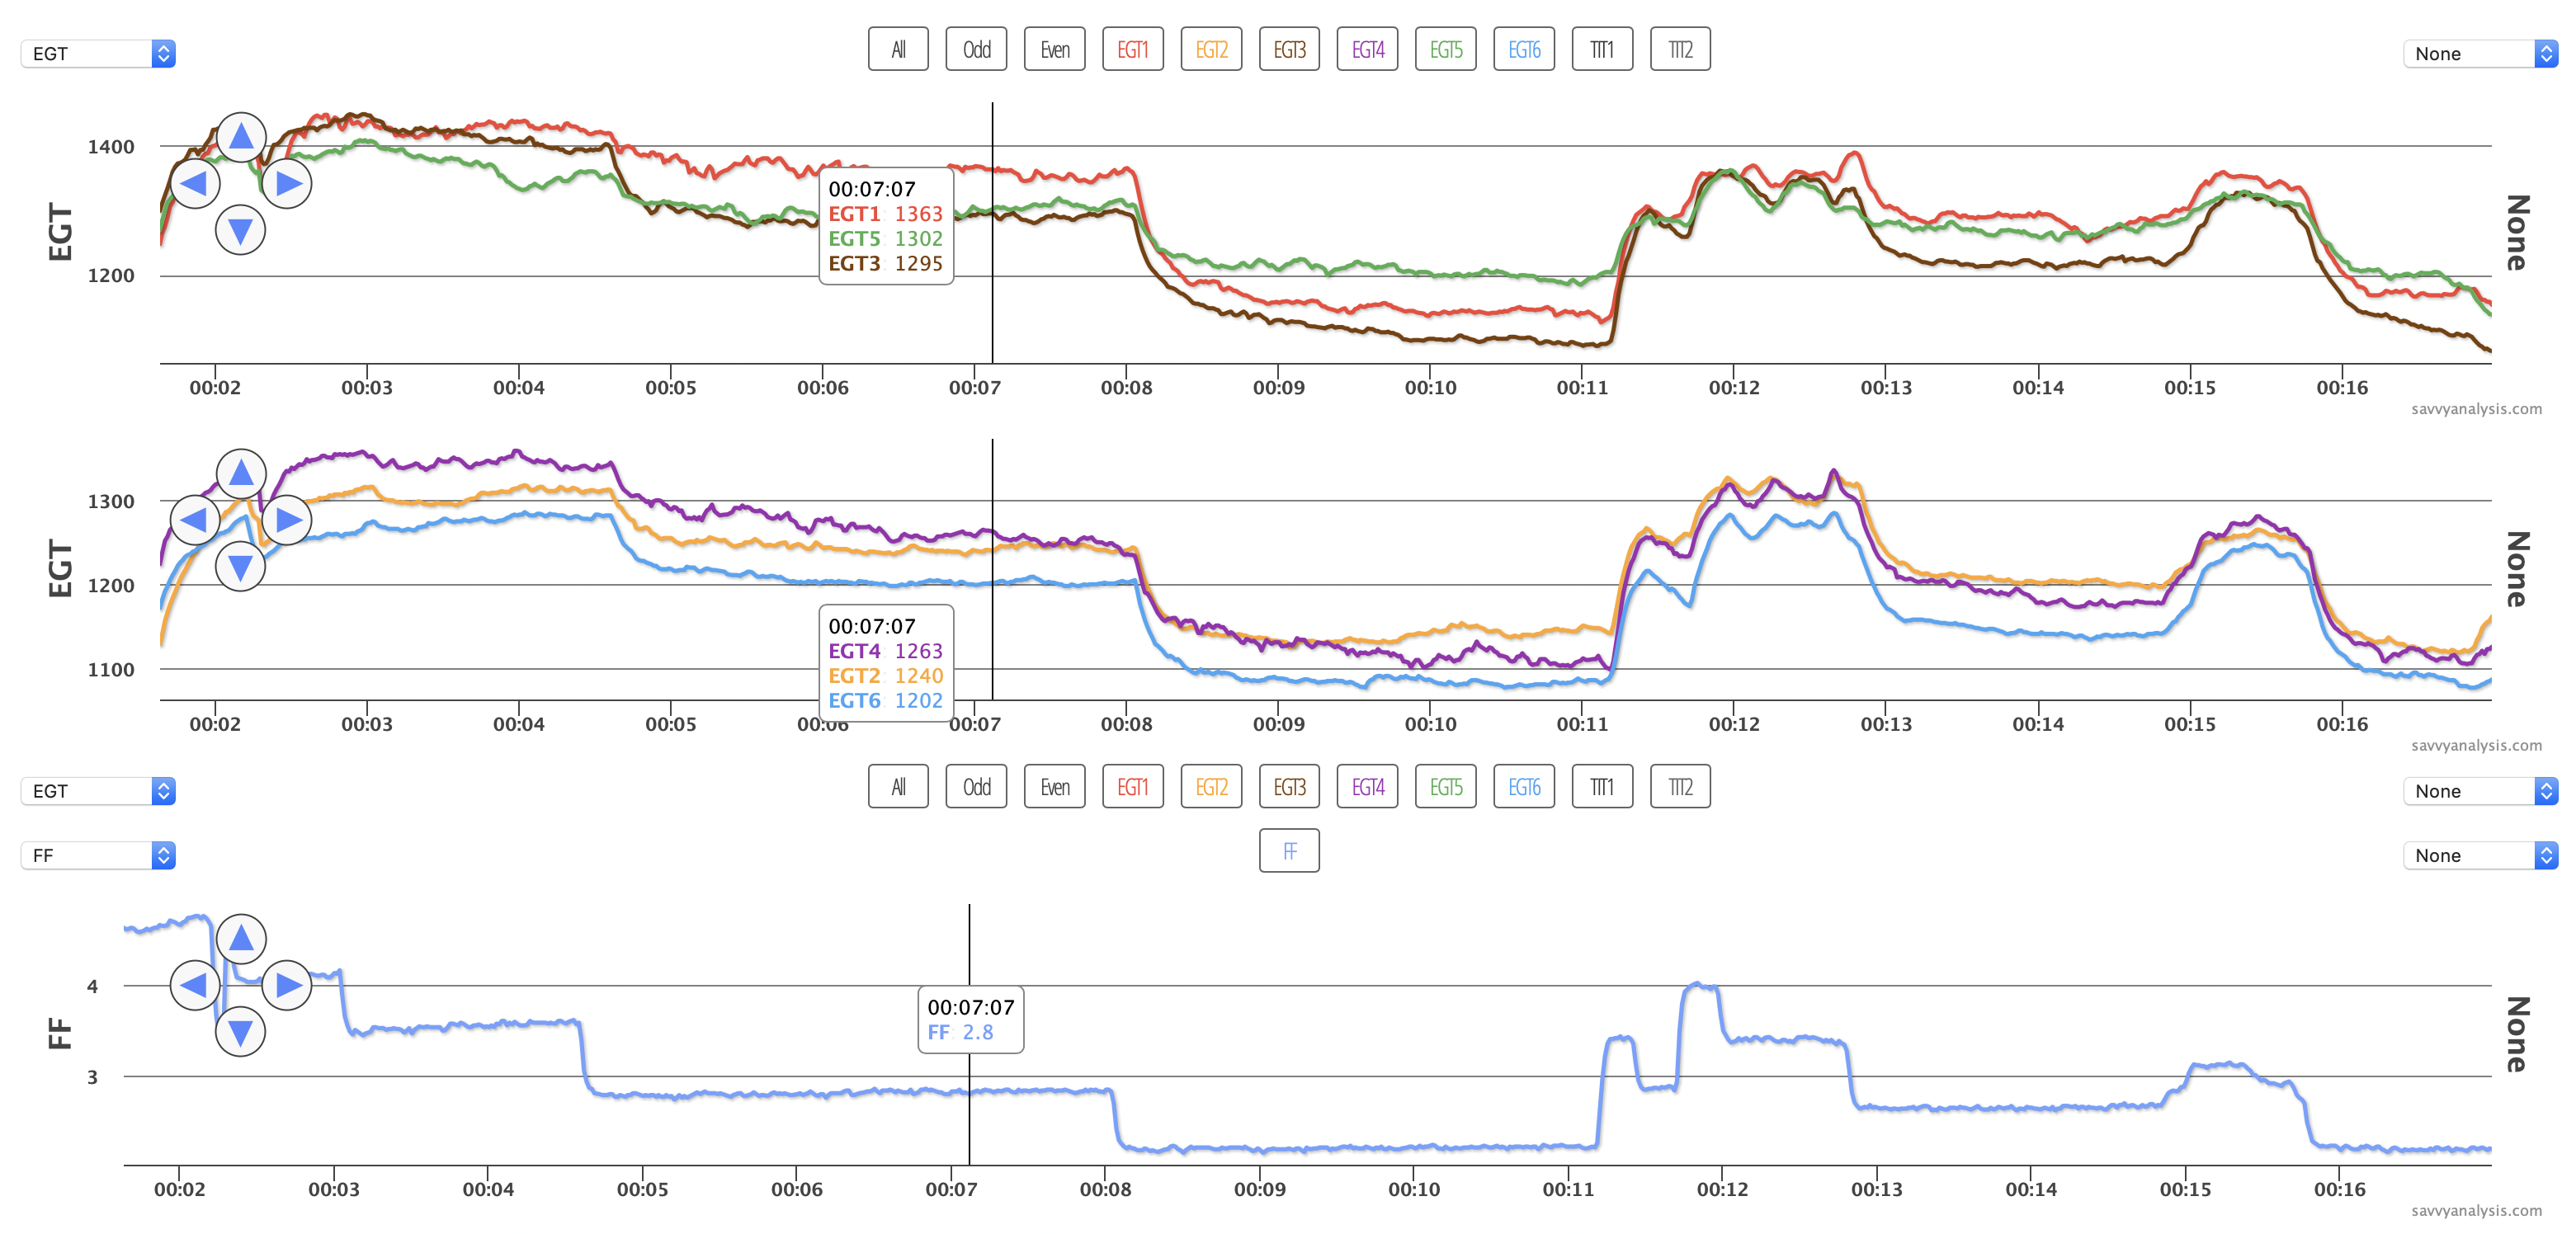
With the exception of EGT 6, the EGT traces are not as steady as we like to see, and when we looked at flight data from about a year ago, not as steady as they had been on this plane historically. Rather than an issue with any one plug, it looked like a mag problem, or maybe a harness problem. When the shop tested the harness we knew we had the culprit. New harness – no more static in the radios.
Next up is a Piper Dakota with a Lycoming O-540 and data from a JPI 700 with a 6 sec sample rate. EGTs on top, CHTs and MAP below, and FF below that.
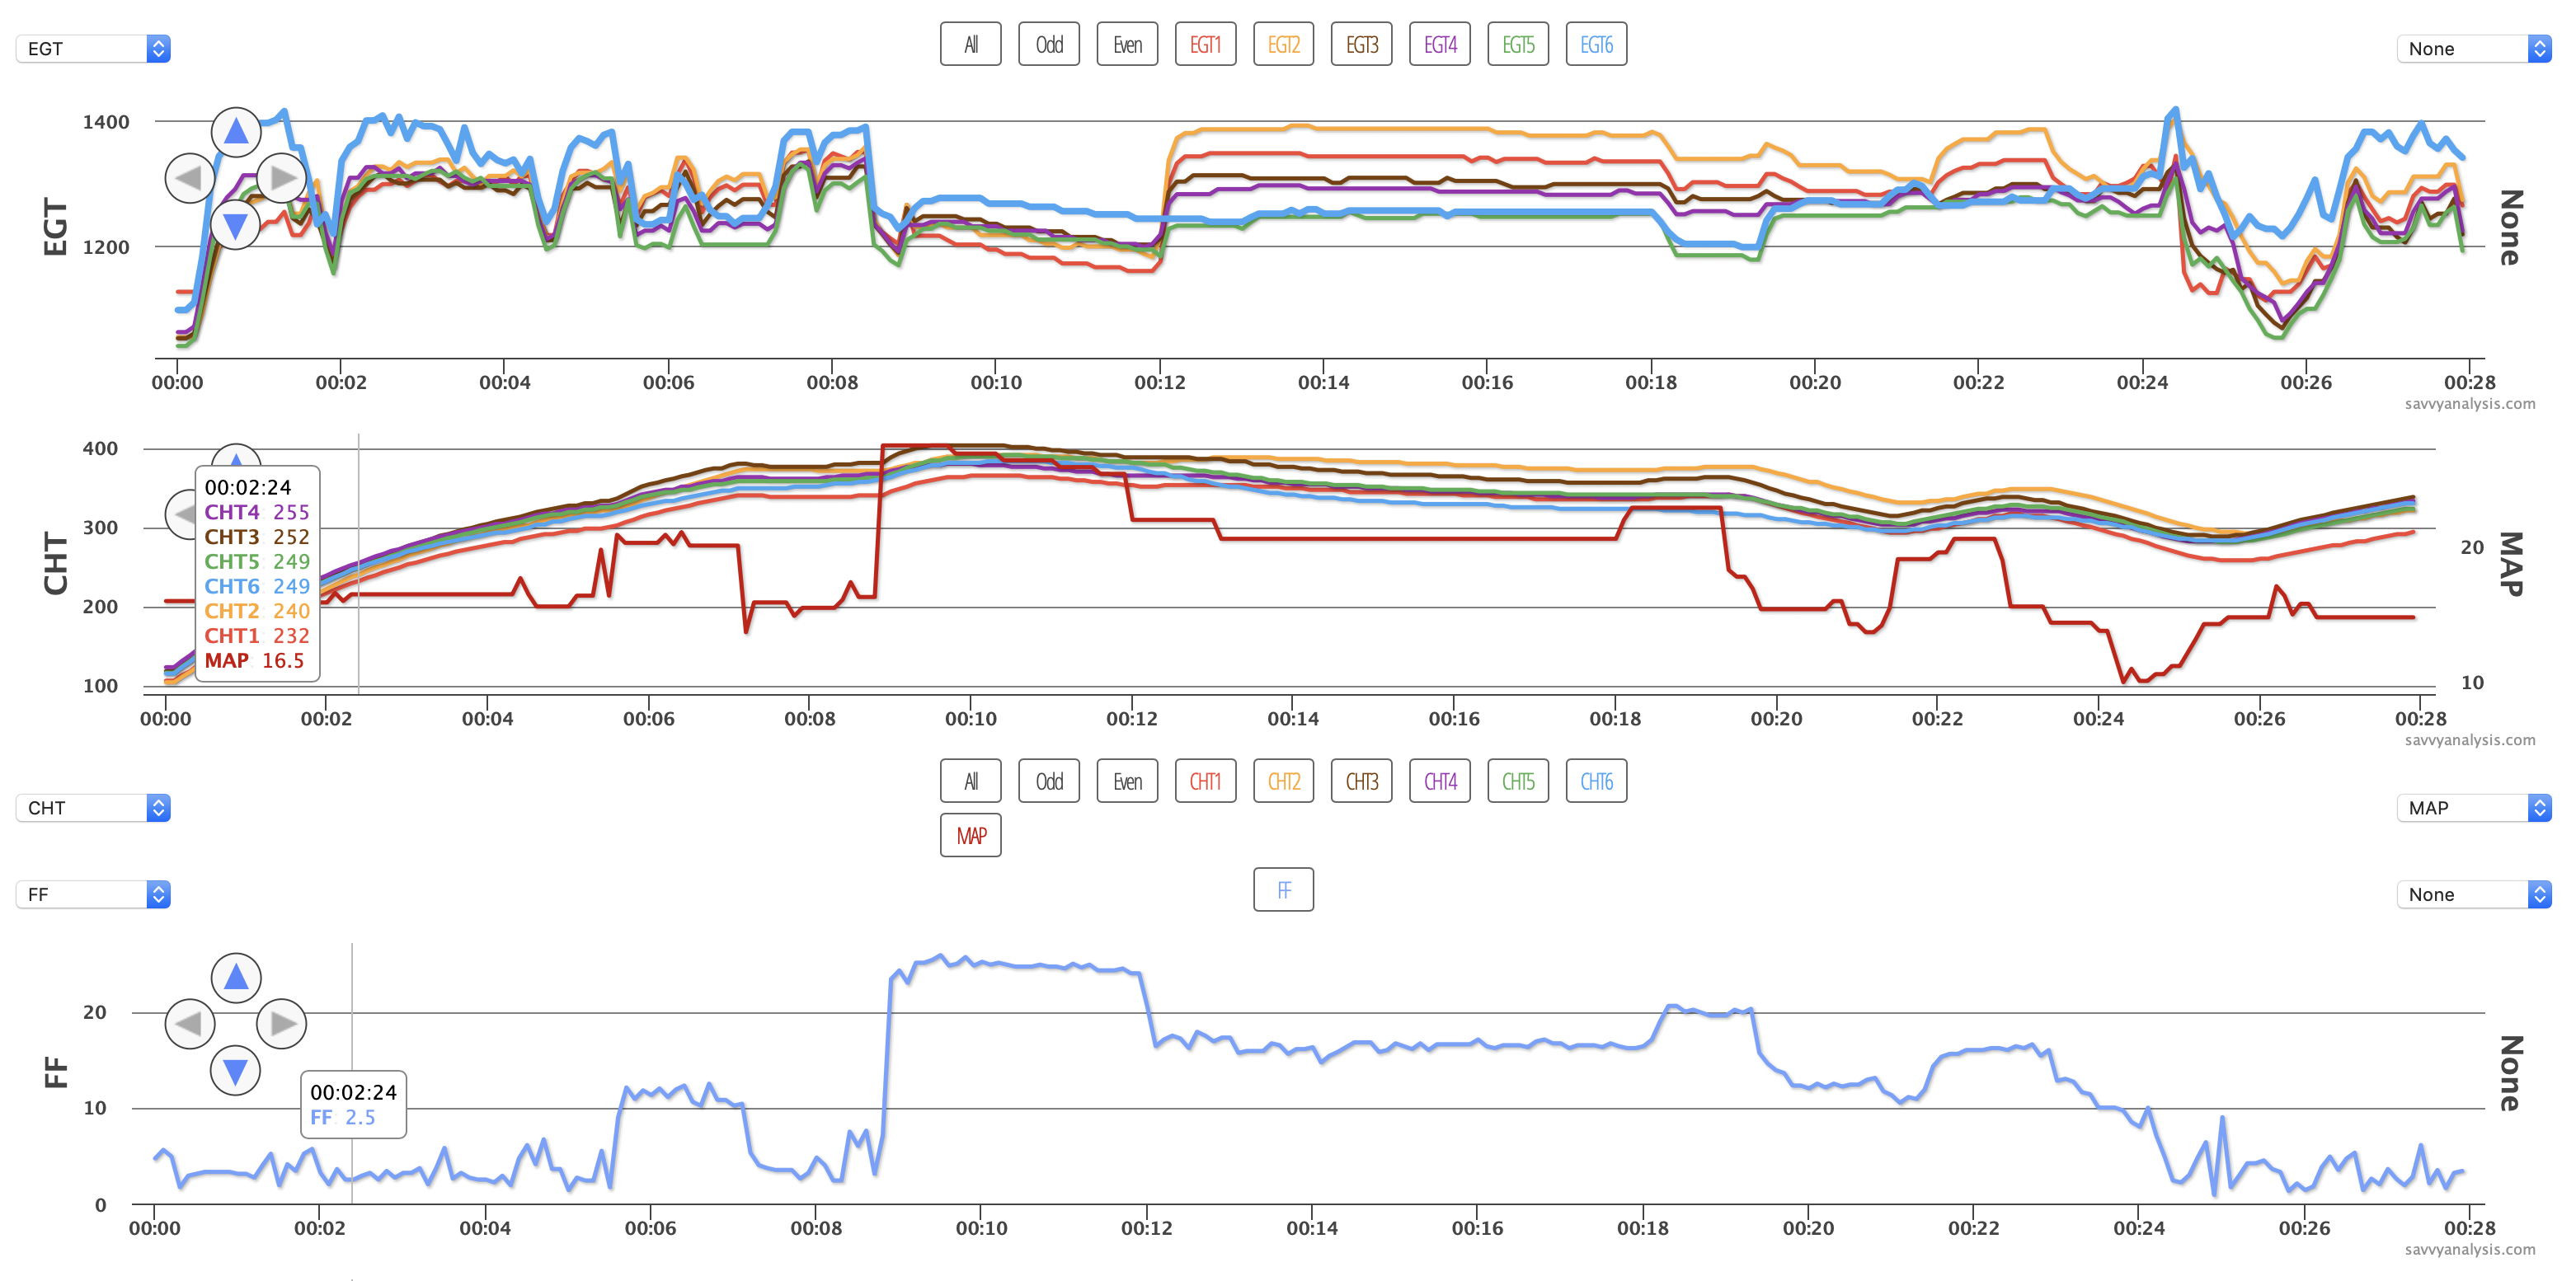
The items that stick out at first glance are the high EGT for cyl 6 – it’s very high during ground ops, somewhat high in climb, then vies for lowest in cruise. At the big pull at the 12 min mark EGT 6 acts like nothing happened. When we suspect an induction leak, we display manifold pressure – MAP – and in this case it’s 16.5″ right after engine start. That’s a lot higher than the 12-14″ we should see with the engine idling. So we recommended checking the plugs for cyl 6, and checking induction. Each plug of cyl 6 revealed its own problem – the gap was too wide on the top plug and the bottom plug was oil fouled.
So the theory is that during ground ops, the oil fouled plug dropped out, leaving the wide-gap plug to fire its hot signal. At takeoff, the oil fouled plug gradually got back in the game and modulated the high reading of the wide-gap plug. That worked until power was reduced for landing at about 24 mins, and the oil fouled plug started fouling again.
We still think the high MAP is cause for checking the induction system. And we reminded the client to set his sample rate to 2 secs for more precise flight data.
Next up is data from a Cessna 210 with a Continental IO-550 and data from a JPI 730 with a 1 sec sample rate. EGTs on top, then CHTs and FF below that.
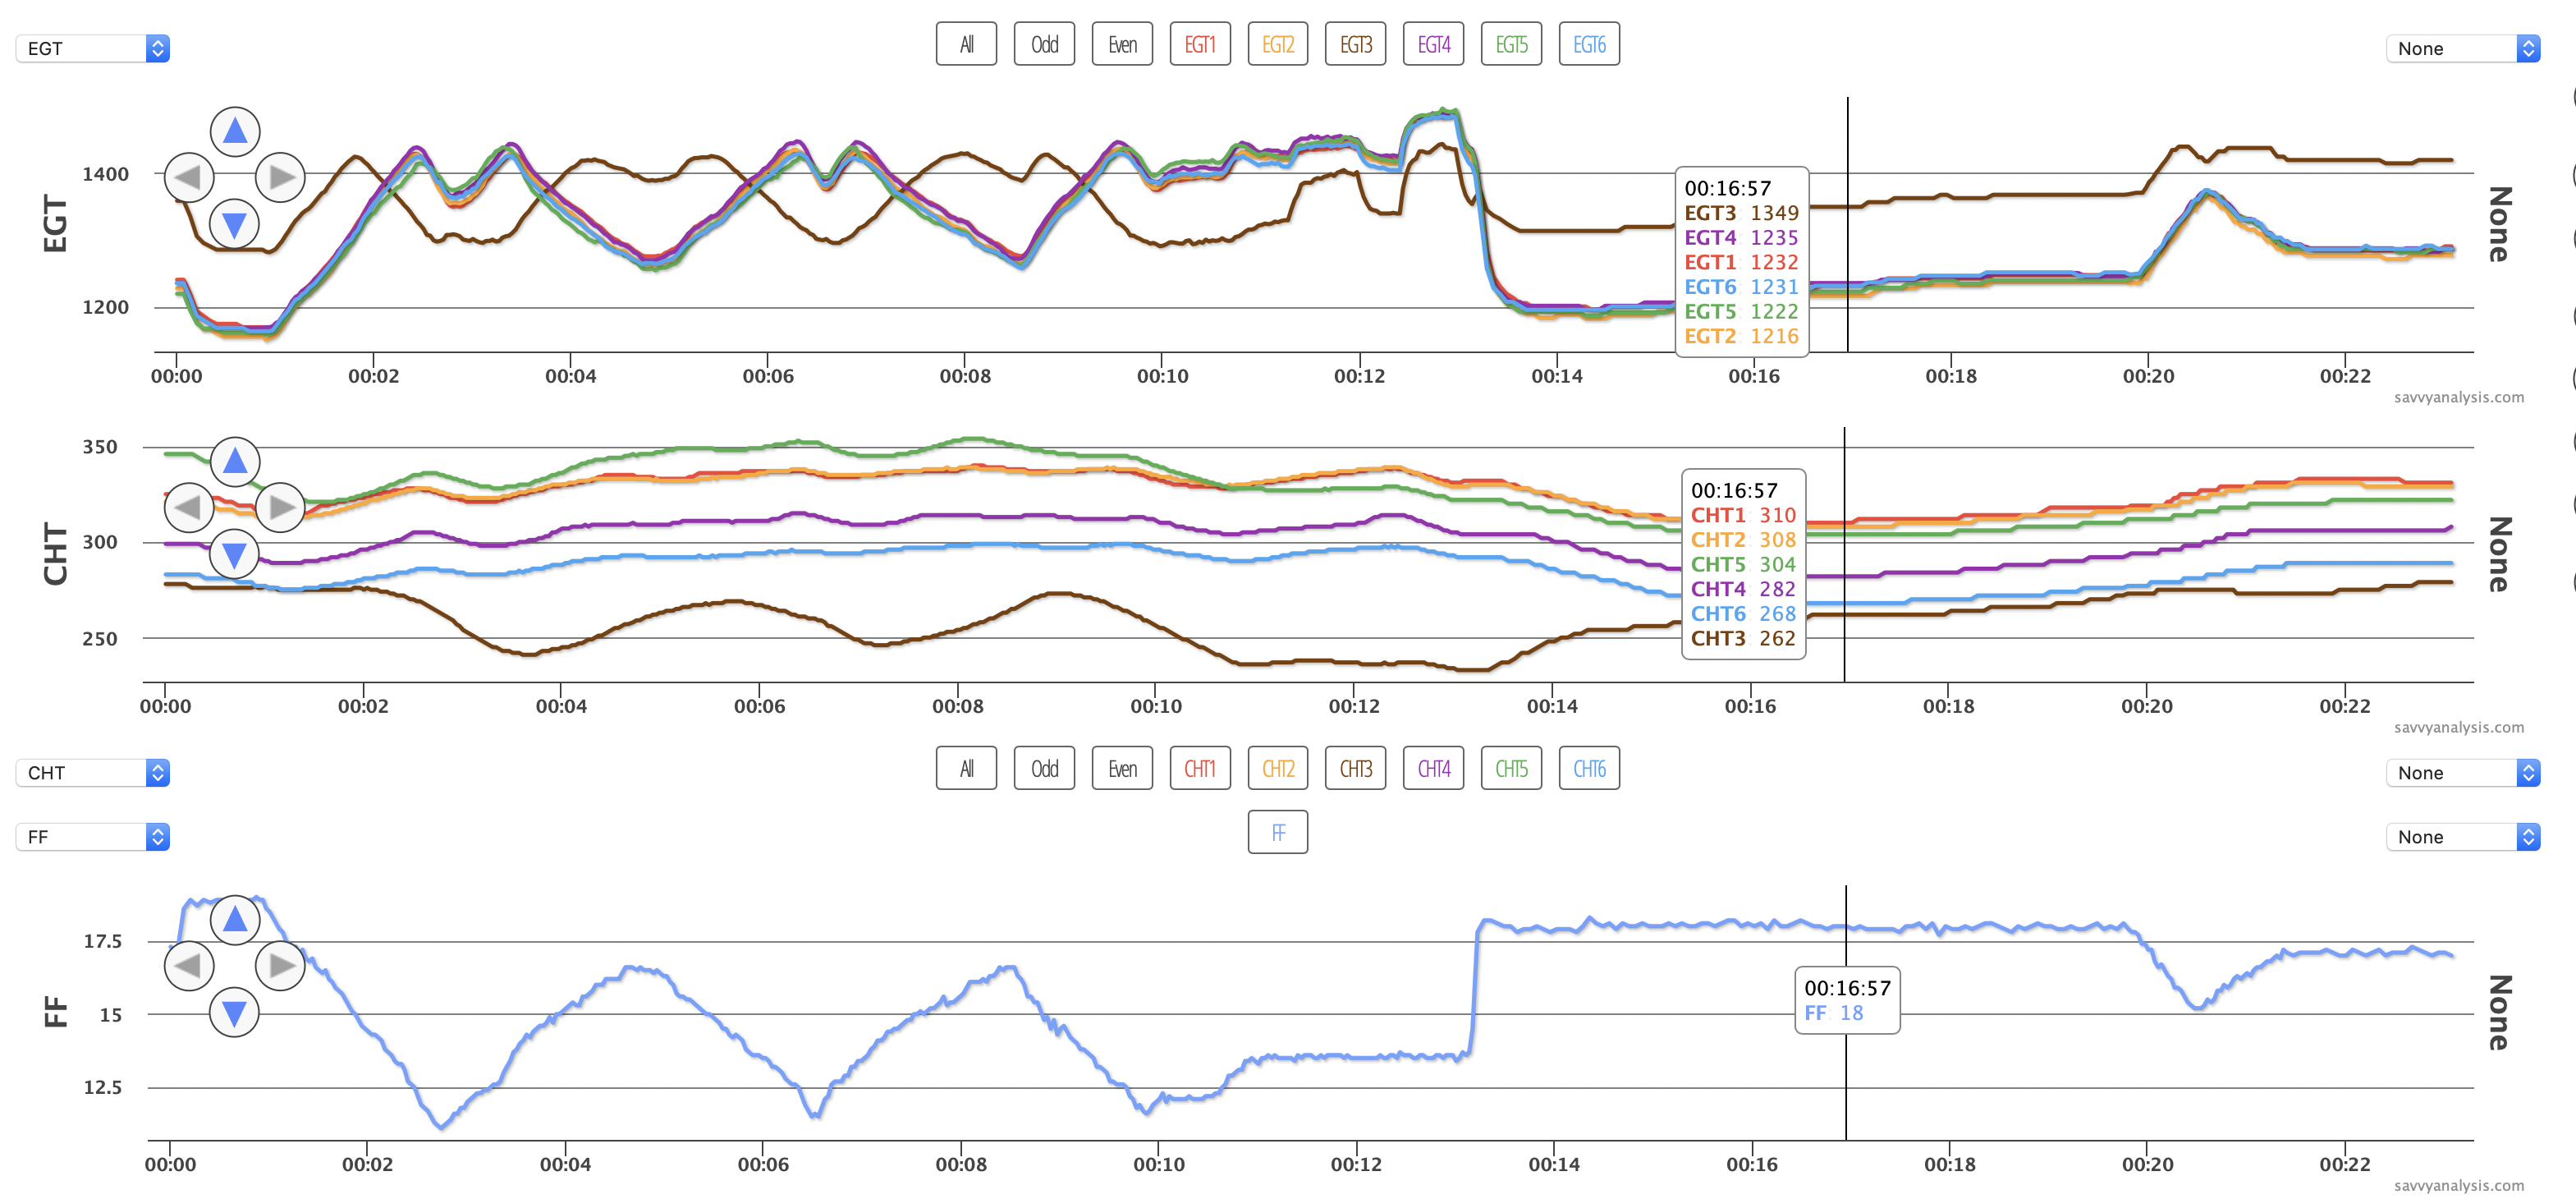
This one might translate well to music – it would likely be a fugue, where a melody is introduced by one instrument then taken up by others. In this series of mixture sweeps, EGT 3 is first to peak by a LOT, then the others follow. 3 is almost perfectly out of phase. CHT 3 lags, but corroborates the cycles. When EGT and CHT move together on an injected engine, it’s almost always an injector clog. This airplane had recently been painted, which begged the question could that have anything to do with this? Like some piece of masking tape didn’t get removed? We recommended cleaning the injector and that brought 3 back into phase.
This is one of those patterns that would be really tough to picture in real time while flying. But it’s plain as day once you upload the data.
We’ll close out April with a Cessna 185 with a Continental IO-520 and data from a JPI 830 with a 2 sec sample rate. EGTs on top, CHTs below and FF below that.
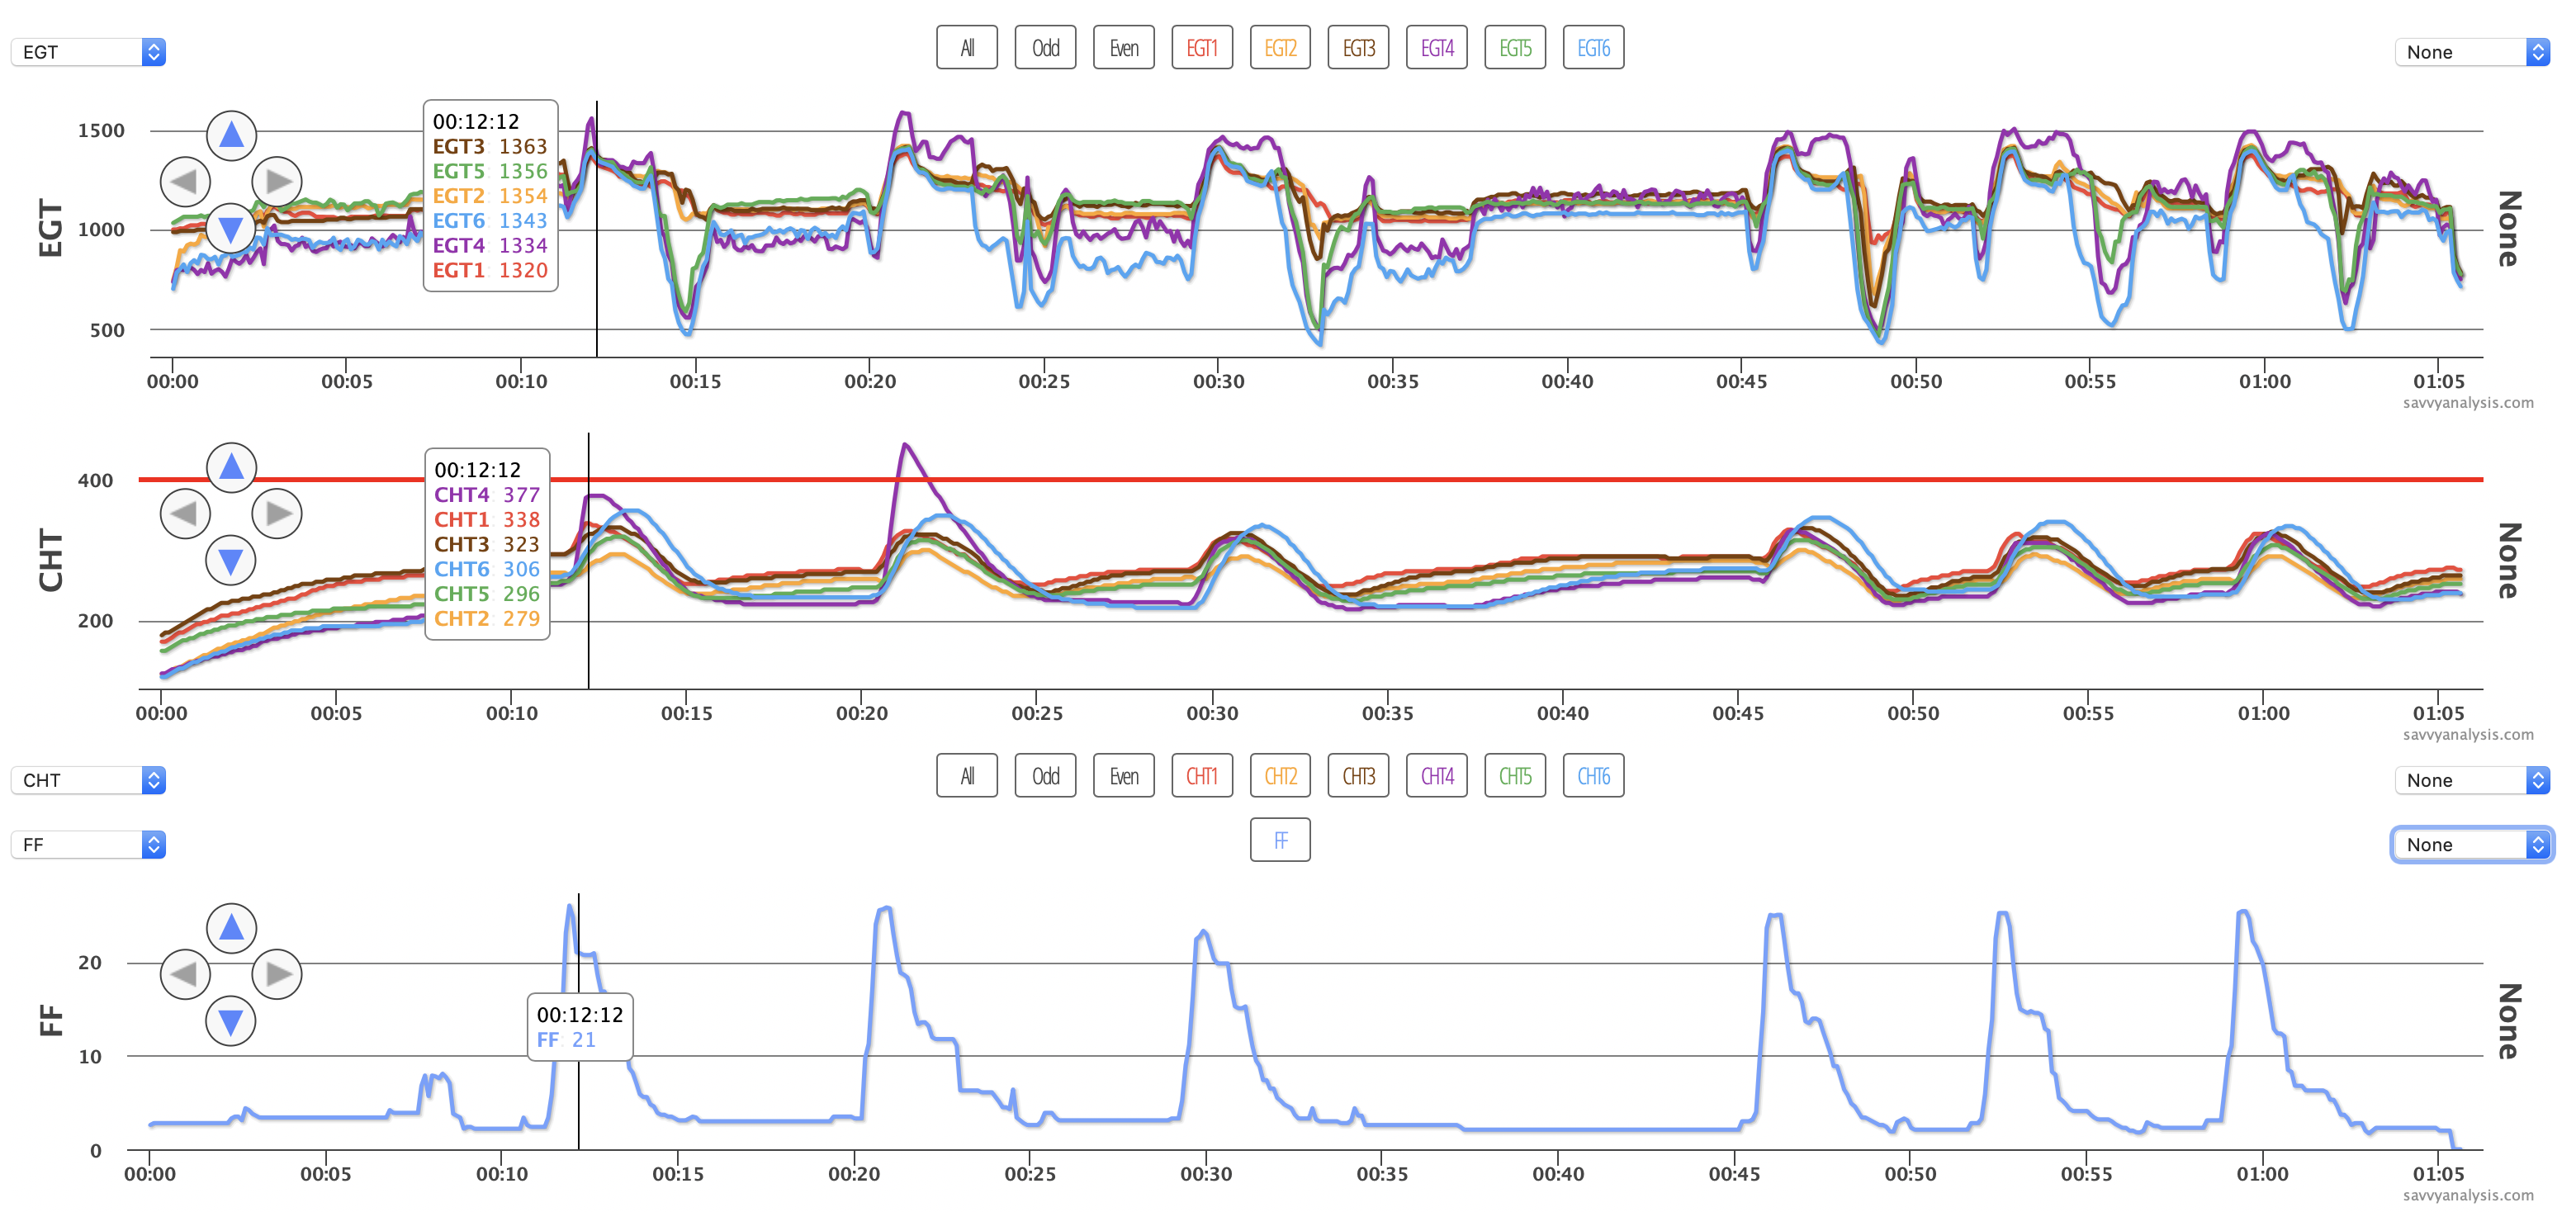
It’s a series of 6 takeoffs and landings. I put the cursor on the first takeoff so you can see the numerical difference in CHTs. Cyl 4 is 377º vs cyl 1 at 338º and the others below that. EGT 4, along with EGT 6, had been low and jumpy during taxi-out. On this first takeoff, and on subsequent takeoffs, EGT 4 jumps well above the others, then when power is reduced it falls well below the others. The flat-topped peak of CHT 4 on the first takeoff looks a little like a detonation pattern, and the cursor shows that EGT has already fallen from its peak even as CHT 4 just reaches its peak.
What does a detonation pattern look like? It looks like that pointy CHT peak on the second takeoff. There CHT 4 reaches 446º and EGT 4 drops again as CHT peaks. The airplane lands again, but not for long, and logs 4 more takeoffs and landings before shutdown. When we spot a detonation event in the data, we usually recommend borescoping the cylinder before further flight. We’re not to the point yet with this data where we can say “that much was ok, but this much was too much” just based on EGTs and CHTs.
Notice that in the subsequent takeoffs, EGT 4 still jumps up, but it doesn’t drop like it did on T/O 1 and 2, and CHT 4 is neither high nor low. And let’s not forget CHT 6, which slow to warm and then slow to cool in each circuit. We’d recommend a borescope inspection for cyl 6 too.
Detonation patterns are one of the items where we’ll apply machine learning and see if the computer can derive patterns from a set of knowns. Until then, borescoping is the way to go.
