After ten years of reviewing engine data, it’s getting harder to hit us with something we haven’t seen before. This month we had the usual contingent of clogged injectors, weak spark and induction leaks. But we had a few scenarios that caused some head scratching, speculating and postulating. Since day one, our goal has been to keep the wrenches in the box unless we’re pretty certain that our recommendation will fix what’s wrong. In other words, we don’t like to guess.
This month’s data from a Piper Seneca offered quite a Puzzle.
Here’s data from the R engine of a Piper Seneca powered by Continental TSIO-360 engines with data from an EI CGR-30P using a 1 sec sample rate. Most engine monitors for twins give us data for the L and R engines in the same file. This installation gives us separate files for L and R. It’s easy enough to open them side by side for analysis, but that’s why you’re seeing R engine EGTs, CHTs, FF and oil temp – and not the L data.
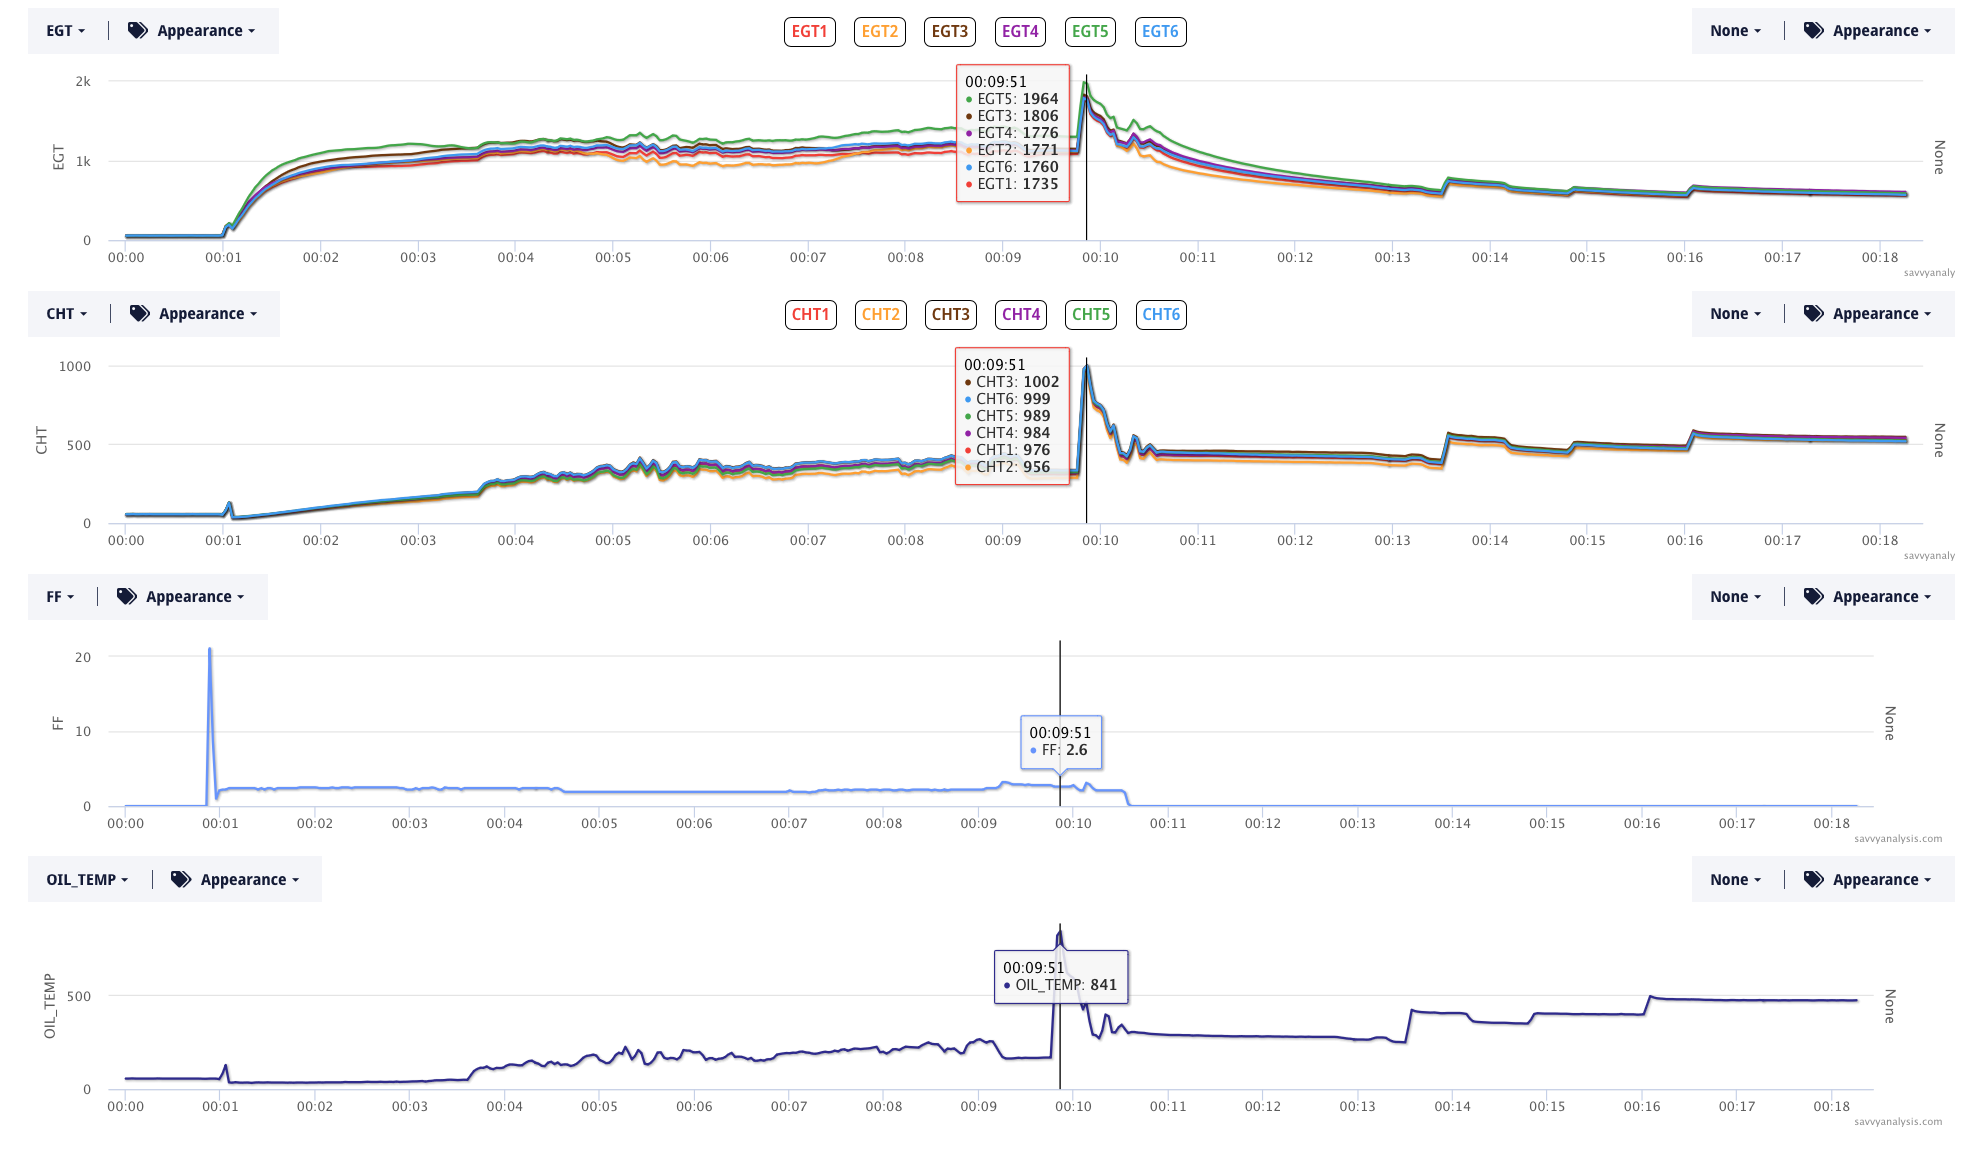
Sure gets your attention, doesn’t it? The cursor is hiding the data just before the runaway, but I wanted you to see the numbers at the peak. And before we zoom in, notice that FF doesn’t peak along with the others. There’s a spike just before the 1 min mark which is probably the boost pump on and off.
Quick sidebar on installations. This is the argument for wiring the engine data monitor to the master bus, versus to the Avionics bus. If it’s on the master bus, you get the benefit of logging the data at engine start. It isn’t always revealing, but sometimes it is. Sidebar over.
What would you do if you saw these numbers? Would you shut down the engine? That’s what this pilot did. Noticed that fuel flow drops to zero about a half minute after the cursor mark. It’s probably an easier decision in a twin, since you’ve still got one good engine to taxi back to the hangar. And speaking of that engine, data for the L engine was normal at this point during ground ops – no runaway temps. Let’s zoom into the peaks for the R engine. Dark vertical line is the same cursor from the data zoomed out. Shaded grey line at 10:04 is the numbers at that spot in the data.
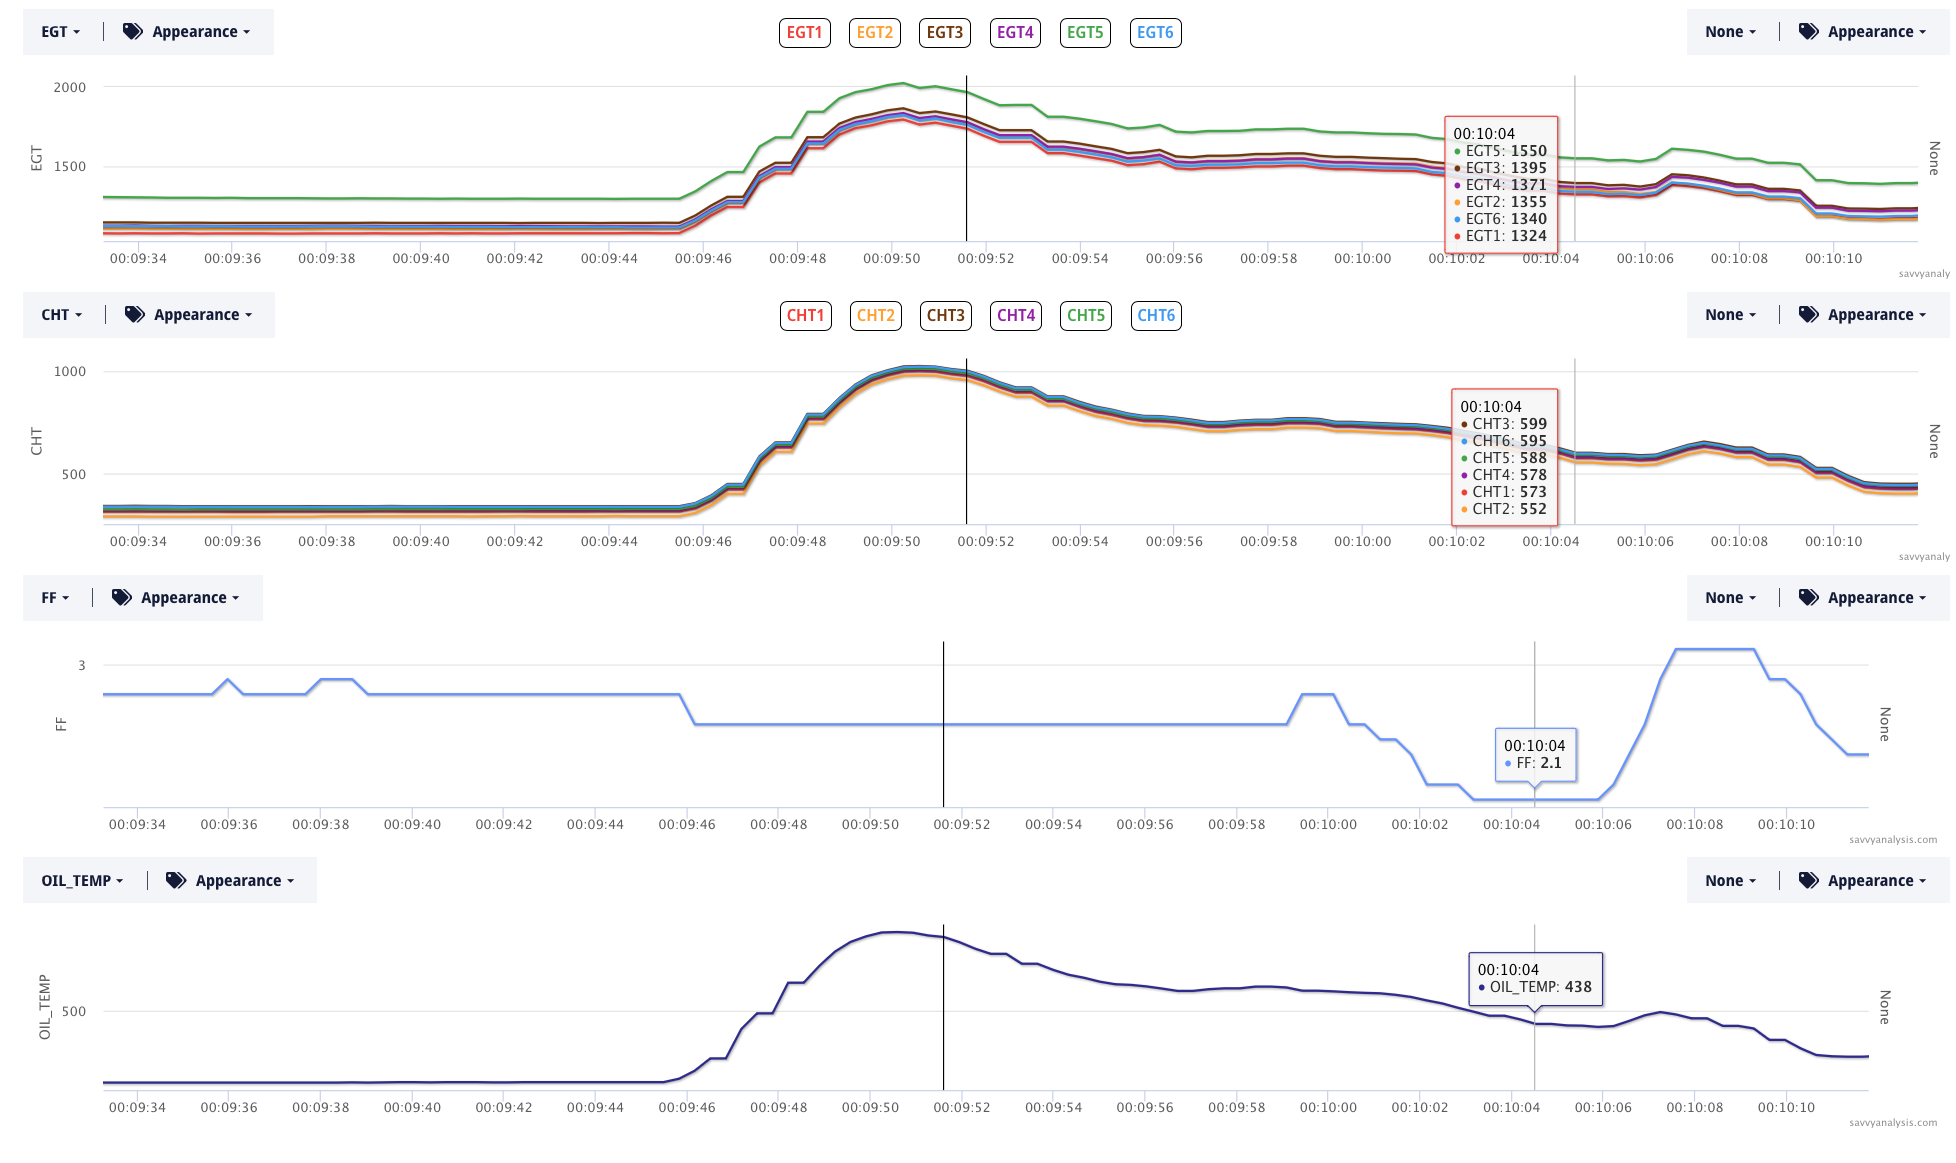
I zoomed in so you could see the stair-stepping in the runaway. There’s also a little stair-stepping on the way back down. That has to be a clue. Heat doesn’t pause and re-group before continuing on. Then there’s the physics aspect – can an engine idling at 2.5 GPH even generate enough heat to get to 1000º? Wouldn’t it seize first? So can we just blame this on the CGR-30P? Then why doesn’t FF move? And RPMs and MAP were also steady. This was pretty clearly a data issue – even 8 mins after engine shutdown all the CHTs are still around 500º. And oil – or what’s left of it – is still around 300º. If this were a single, you’d be wondering if it got mis-fueled with Jet A. With a twin, since the other engine data was normal, it’s a harder case to make. Still, in abundance of caution mode we thought it was a good idea to borescope at least one of these cylinders just as a sanity check.
We were still struggling with how data measured in º could be so off the charts while data measured in other quantities was ok. And the Savvy account managers (this is a Savvy Mx client) provided the answer. Dave Pasquale remembered that the EI MVP-50 has “a reference temp sensor in one of the many modules that are part of the system. If the reference temp sensor gets messed up it screws with all of the temperature indications. I ran into this with an A36 I work on. The installer mounted the reference module on the back side of the firewall access panel. When the oil cooler got hot the temps would start reading funny.” Which led Mark Reed to find this on the EI website —
7.3 Temperature Problem on all Channels:
Temperature is measured using a temperature probe with type K thermocouple (TC) wire. When the TC junction in
the tip of the probe is heated, a small signal (approx. 23 micro volts per ‘F) is produced and monitored by the EDC on
two extension wires. These extension wires must be made of type K TC material.
When measuring temperature with TC material an ambient reference temperature must be provided. This is done with
a reference diode located on pins 10 and 28 of the EDC Middle Connector. The ambient temperature is added to the
temperature measured at the TC junction.
Symptom: Inaccurate, jumpy or zero readings on all channels.
1.Problem: The Reference Diode on pins 10 and 28 of the EDC Middle Connector is damaged.
Action: Measure the voltage on the Reference Diode. Pin 28 = 0 volts and pin 10 = approx. 0.5 volts.
2.Problem: One of the temperature input channels is over voltaged. This can happen on a channel that
is used to monitor an Annunciator, Flap or Trim function. The max input voltage for any
temperature or pressure channel is +5 volts. The VI-221 is used to drop the voltage when
measuring signals that switch from ground to bus voltage.
Action: Measure the voltage on each of the temperature channels
It all makes sense once you know the answer, huh? It took about 9 mins for the ambient reference sensor to heat up. And it explains why the L engine data – using a different 30P with its own reference monitor, didn’t show runaway temps.
I can’t stop wondering what I would have done if I saw this pattern in the air – in my single-engine Bellanca Viking. Would I have noticed that only º values were changing while others stayed the same? Not a chance. That was hard enough to spot without a handful of moving airplane. As we approach the busy flying season (in the US anyway) we’ll recommend reviewing your thought process for encountering unusual engine data while you’re flying. We practice for engine failures, instrument failures and radio failures. Can you quickly determine whether what you’re seeing is a real emergency vs a sensor failing at an inopportune time?
