If there were a TV show where I could watch A&Ps, or just plain owners, swinging wrenches on airplanes, I’d probably watch. I’d at least give it a look. Ice Pilots and Flying Wild Alaska and Airplane Repo tend more toward the challenges of aviating and making a living than the challenge of torquing a nut you can’t reach, but once in a while you get a glimpse of the maintenance angle. So it was a joy when one day my channel surfing landed me on Wheeler Dealers, and I watched a wild-haired guy dismantle and rebuild a car. I have watched so many go in and out of their shop that I don’t remember what the first one was.
I would usually watch until the end of the show when they sold the car and counted the money, but for me the fun was watching the action on the shop floor – what can he save? are there new parts available? is he really going to fab that? Having owned a Jensen-Healey in the ’70s, I already knew that there were proper British terms for hood and trunk – and we JH owners had our own colorful words for their quirky gearboxes and electrical systems – but Edd and Mike gave me a whole new vocabulary. So thanks mates, for a great show and for breathing new life into dozens of great cars. Perhaps there’s a spin-off where you restore aging aircraft? For now, it’s on to some fiddly bits.
First up is data from a Cirrus SR-22 with a Continental IO-550-N and data from an Avidyne with a 6 sec sample rate. EGTs and FF on top, CHTs and OAT on bottom.
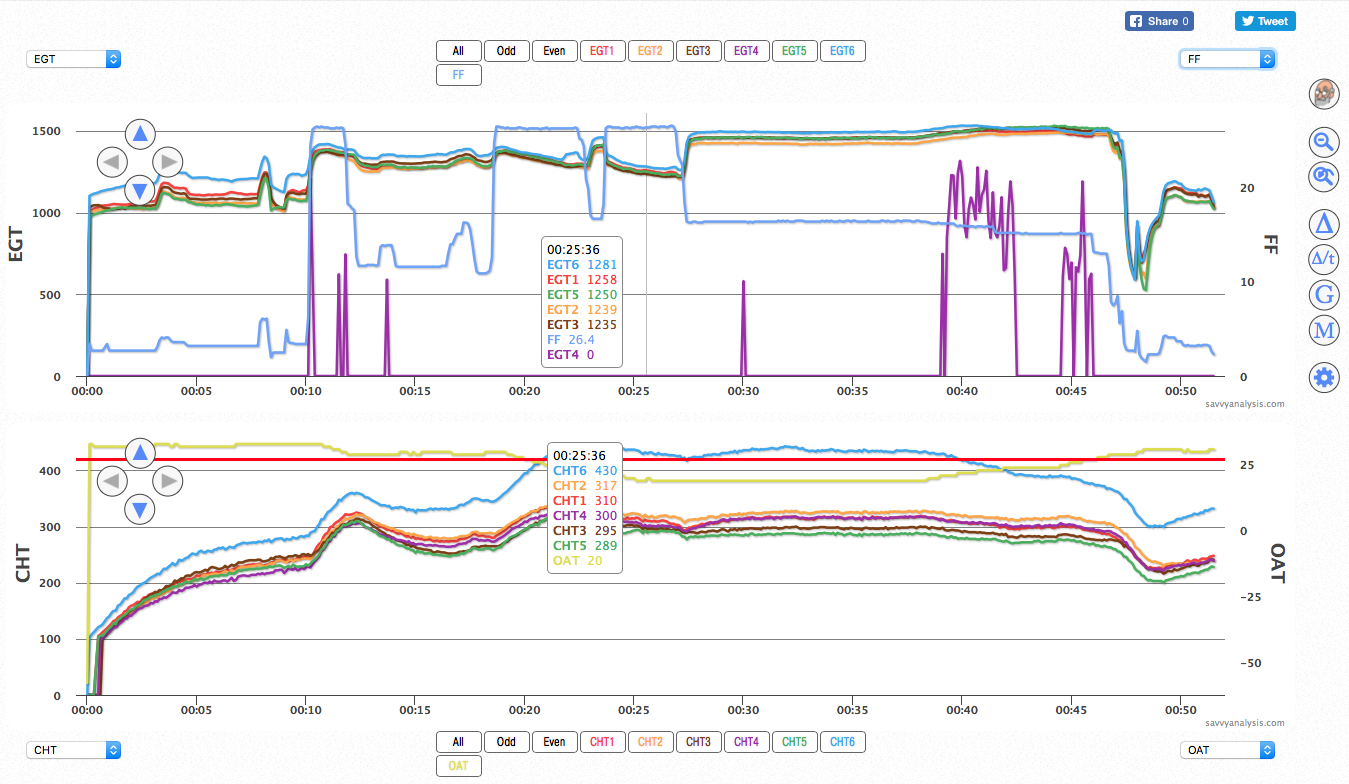
All looks fairly normal except EGT 4 – the purple trace – and CHT 6 – the blue trace. Let’s start there. Because EGT 6’s blue trace is generally high, could EGT and CHT 6 be connected? Weak spark should send EGT higher- to the tune of about 70-100º F. It’s sometimes in that range here, but sometimes it’s only slightly above the pack. Could it be a clogged injector? We’ve got high EGT and high CHT at high fuel flow, but we don’t have low EGT and lower CHT when FF is reduced. In fact, CHT 6 barely moves as FF is reduced from 26 to about 16 GPH. Plus, EGT is only slightly above the pack, while CHT 6 is about 100º hotter. Let’s see what we can learn by zooming in to the beginning of the data.
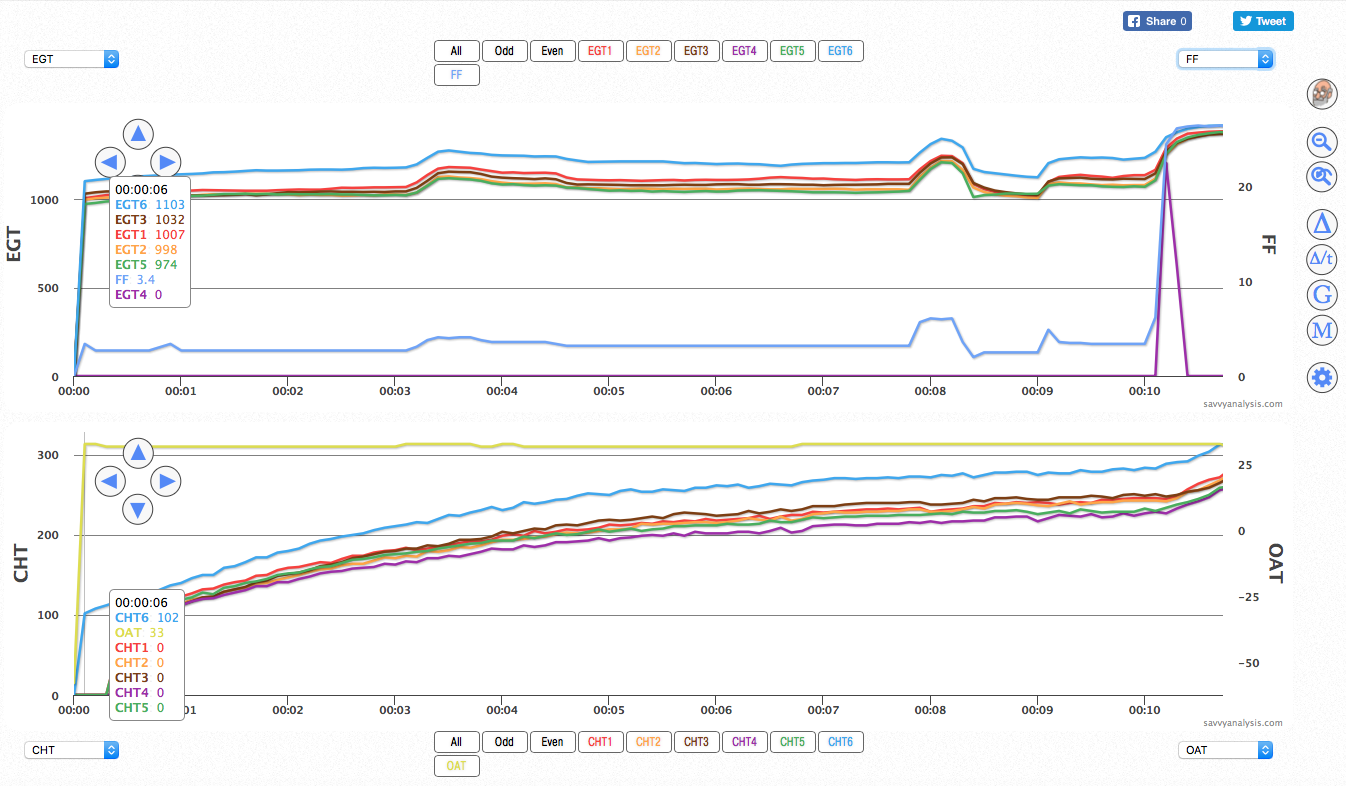
The pop-up number boxes show that as of the first sample – at the 00:00:06 mark – EGT is already about 70º hotter than the next hottest EGT, and CHT 6 logs 102º while the others haven’t sent a signal yet. It’s not often we get to see a failing probe and a loose connection in the same data, but that looks like what we have here. The CHT 6 trace looks possible, although scary, as it hovers above 420º for about 20 mins in cruise. We prefer when a failing probe fails dramatically, with big spikes and erratic data, like the fat lady singing the finale at the opera. EGT 4 shows a little of that, except that with all that time parked at zero, we’d recommend checking the connection for EGT 4 before jumping in and replacing the probe.
We might as well check the connection for CHT 6, but since there are no dropouts or sudden moves, we think it’s a probe that’s announcing its retirement by singing a little sharp – adding 100º to the “real” CHT. How about EGT 6? If the client had reported rough running in cruise, we’d recommend a LOP mag check and expect to see weak spark on one of the plugs. With no report of roughness, it doesn’t look like cleaning the injector would help, and the data’s not erratic enough to suspect a probe or connection problem – yet. Let’s get reliable data from EGT 4 and CHT 6 and continue to monitor EGT 6. By the way, I added OAT because this data is from early March, and that 33º OAT is not Fº, it’s Cº. So it’s not March coming in like a lion, it’s the sunny warmth of the Caribbean.
Next up is data from a Beech Bonanza with a Continental TSIO-520-UB and data from a JPI 800 with a 2 sec sample rate.
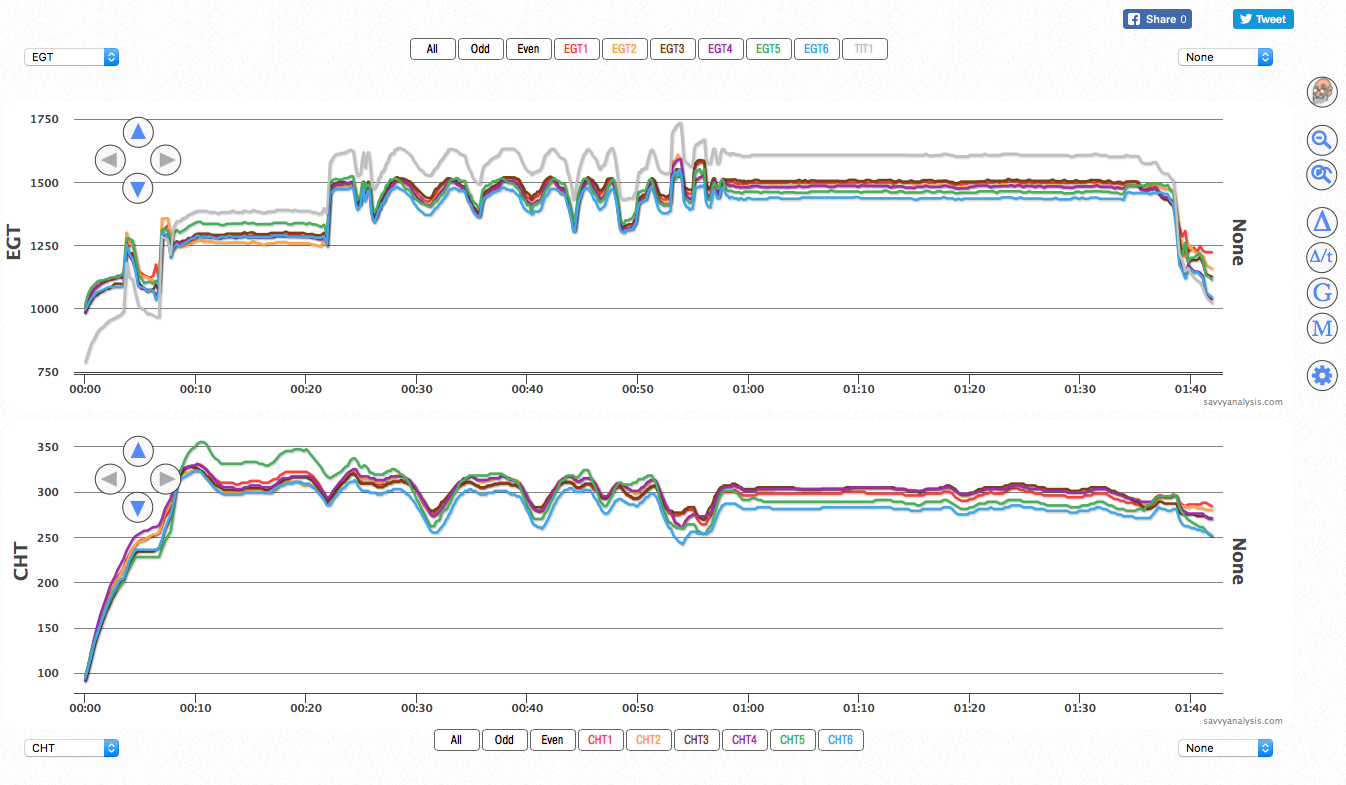
First glance shows EGT and CHT 5 – the green traces – are high at takeoff, then both are lower in cruise. EGT and CHT 6 – the blue traces – are a little lower than cyl 5 in cruise, but they weren’t high at takeoff. And TIT – the grey trace – starts low then gets very high, right at the redline of 1600º in cruise, and even a bit higher during the LOP mag check. Given the choice, Savvy is ok with a brief excursion above TIT redline during the LOP mag check, because the data we gather is valuable, versus prolonged cruise operation right at or slightly over redline.
Earlier we talked about what we’d expect to see with an injector clog – both EGT and CHT high with high FF and lower with low FF – and that’s what we see here. Let’s use the mixture sweeps and see what the GAMI spread looks like.

Data verifies our suspicion that 5 and 6 are lean outliers, peaking at a higher FF than the others. Cleaning those injectors should bring EGT and CHT 5 lower in initial climb, and should bring EGT and CHT 5 and 6 closer to the pack in cruise. It’s tempting to blame the high TIT in climb – from about 10 to 20 mins in the timeline – on EGT 5, but TIT is still very high even when EGT 5 falls. TIT is low at engine start, so it doesn’t appear that we have a probe that “lies” all the time, as we did with CHT 6 on the Cirrus.
Our recommendation was to check the probe and connections, and it turned out to be a bigger deal than that. The mounting bracket for the turbo was cracked, so there was some chafing and rubbing and in the end the entire turbo was overhauled. TITs are normal now.
We’ll end this month with a dramatic chart of an engine failure in flight, and we’re happy to say all walked away after the pilot landed in a field. This is from a Cessna 210 with a Continental TSIO-520-R and data from a JPI 700 with a 2 sec sample rate.
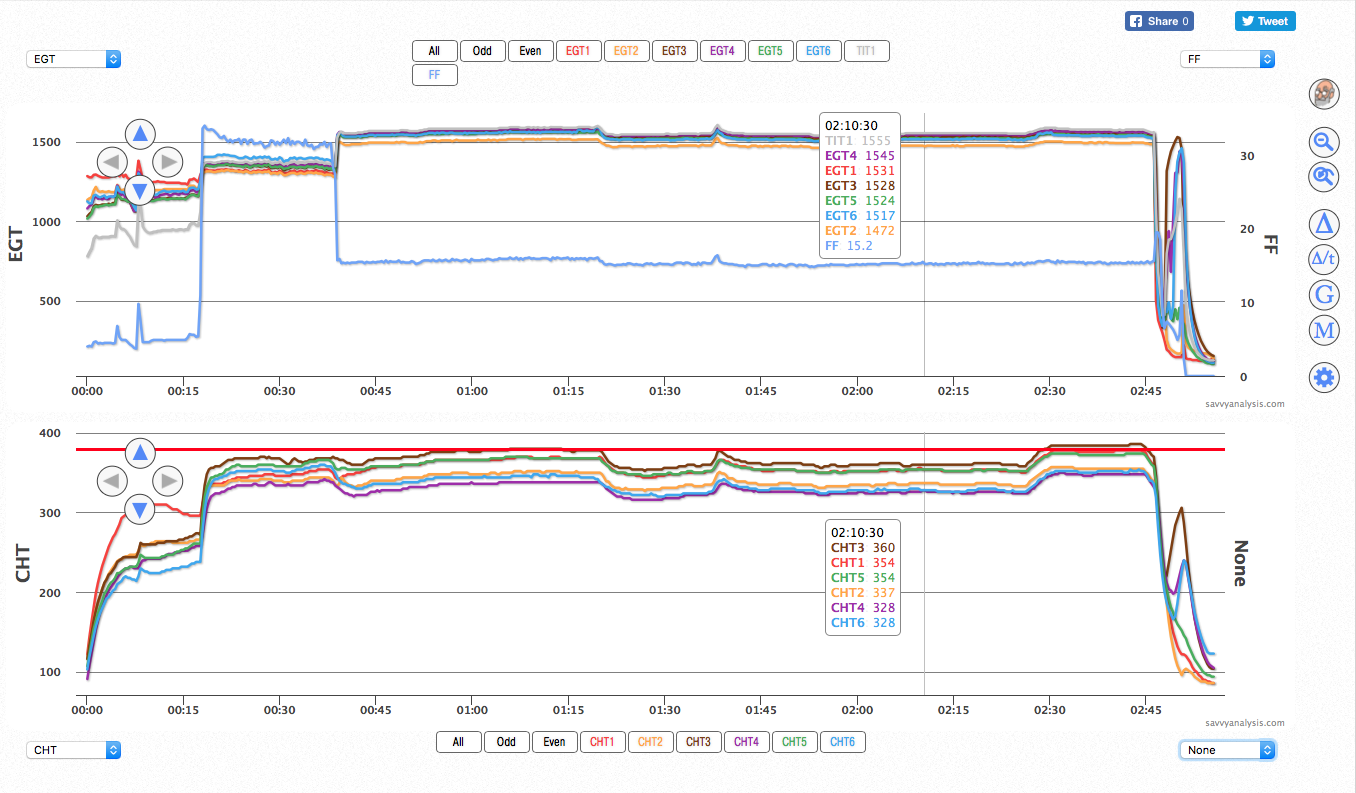
Right after engine start, EGT and CHT 1 – the red traces – are high. So the data right there suggests a clogged injector, but there’s no evidence of that after takeoff power is applied. For the next two hours, EGTs are very stable, CHTs hover just below the alert line of 380º — all looks normal. Just before 02:30 in the timeline, EGTs climb a little and CHTs climb a bit more, but FF barely changed. MAP and RPM aren’t logged on this JPI, but we suspect a power change there. Oil temp isn’t shown, but it’s around 200º F for most of the flight. Highest reading was 208º. Oil pressure isn’t logged.
Then at 02:46:12…

EGT 1 drops first, then the others follow suit. It’s probably instinctive for most of us to grab the mixture when the engine gets rough, and we see that here. All but EGT 1 show some signs of combustion, but by now oil pressure is gone. The cyl 1 con rod failed, punching holes in the case, and as we said the pilot made a successful forced landing in a field and all walked away. He asked if we saw anything in the data that would have telegraphed the impending failure.
Knowing what we know now, can you make a case for attributing the high CHT at engine start to a poorly-lubed #1 bearing? Even in hindsight that’s a tough connection to make. There are a few reasons why EGT and CHT 1 could be high there, but we don’t see supporting evidence once the airplane’s in flight.
