In most of the Northern Hemisphere it’s the time of year to think about icing. If your airplane is certified and equipped for FIKI – flight into known icing – an encounter with ice isn’t the emergency that it is for the rest of us. When an engine data probe fails in flight, most of us will just press on to our destination with the bad data and repair the probe as soon as possible. As I looked through this month’s data I saw a lot of cases where the pilot had bad or unreliable engine data before takeoff, and elected to launch anyway.
One of them is mine. On a recent trip my JPI 830 showed a BAD PROBE alert, so I continued to my home airport, and a few days later I flew the airplane to the avionics shop which, fortunately, is only an eleven minute flight. Because the 830 is not a primary instrument, I decided I was absolved from FAR 91.213 – the rules governing in operative equipment and minimum equipment lists. I decided that placarding the 830 “Inoperative” would be stupid, since 90-something percent of it was reliable and useful. As confident as I was in my interpretation of the rules, I was nonetheless happy that the flight was eventless – so FAA and NTSB wouldn’t be poring over my engine data – and that I didn’t have to test my rule interpretation in a ramp-check.
So I decided this month’s Puzzler would be about a different kind of FIKI – flight into known imprecision – and look at examples of unreliable data that had been revealed before takeoff, which issues would be harder to diagnose once in the air, and was there a “workaround” for the missing data.
First up is a Cirrus SR20 with a Continental IO-360 and data from an Avidyne with a 6 sec sample rate. EGTs on top, CHTs below that, and FF below that. I parked the cursor so you can see when EGT 1 flatlines – the red trace – it’s at 1650º.
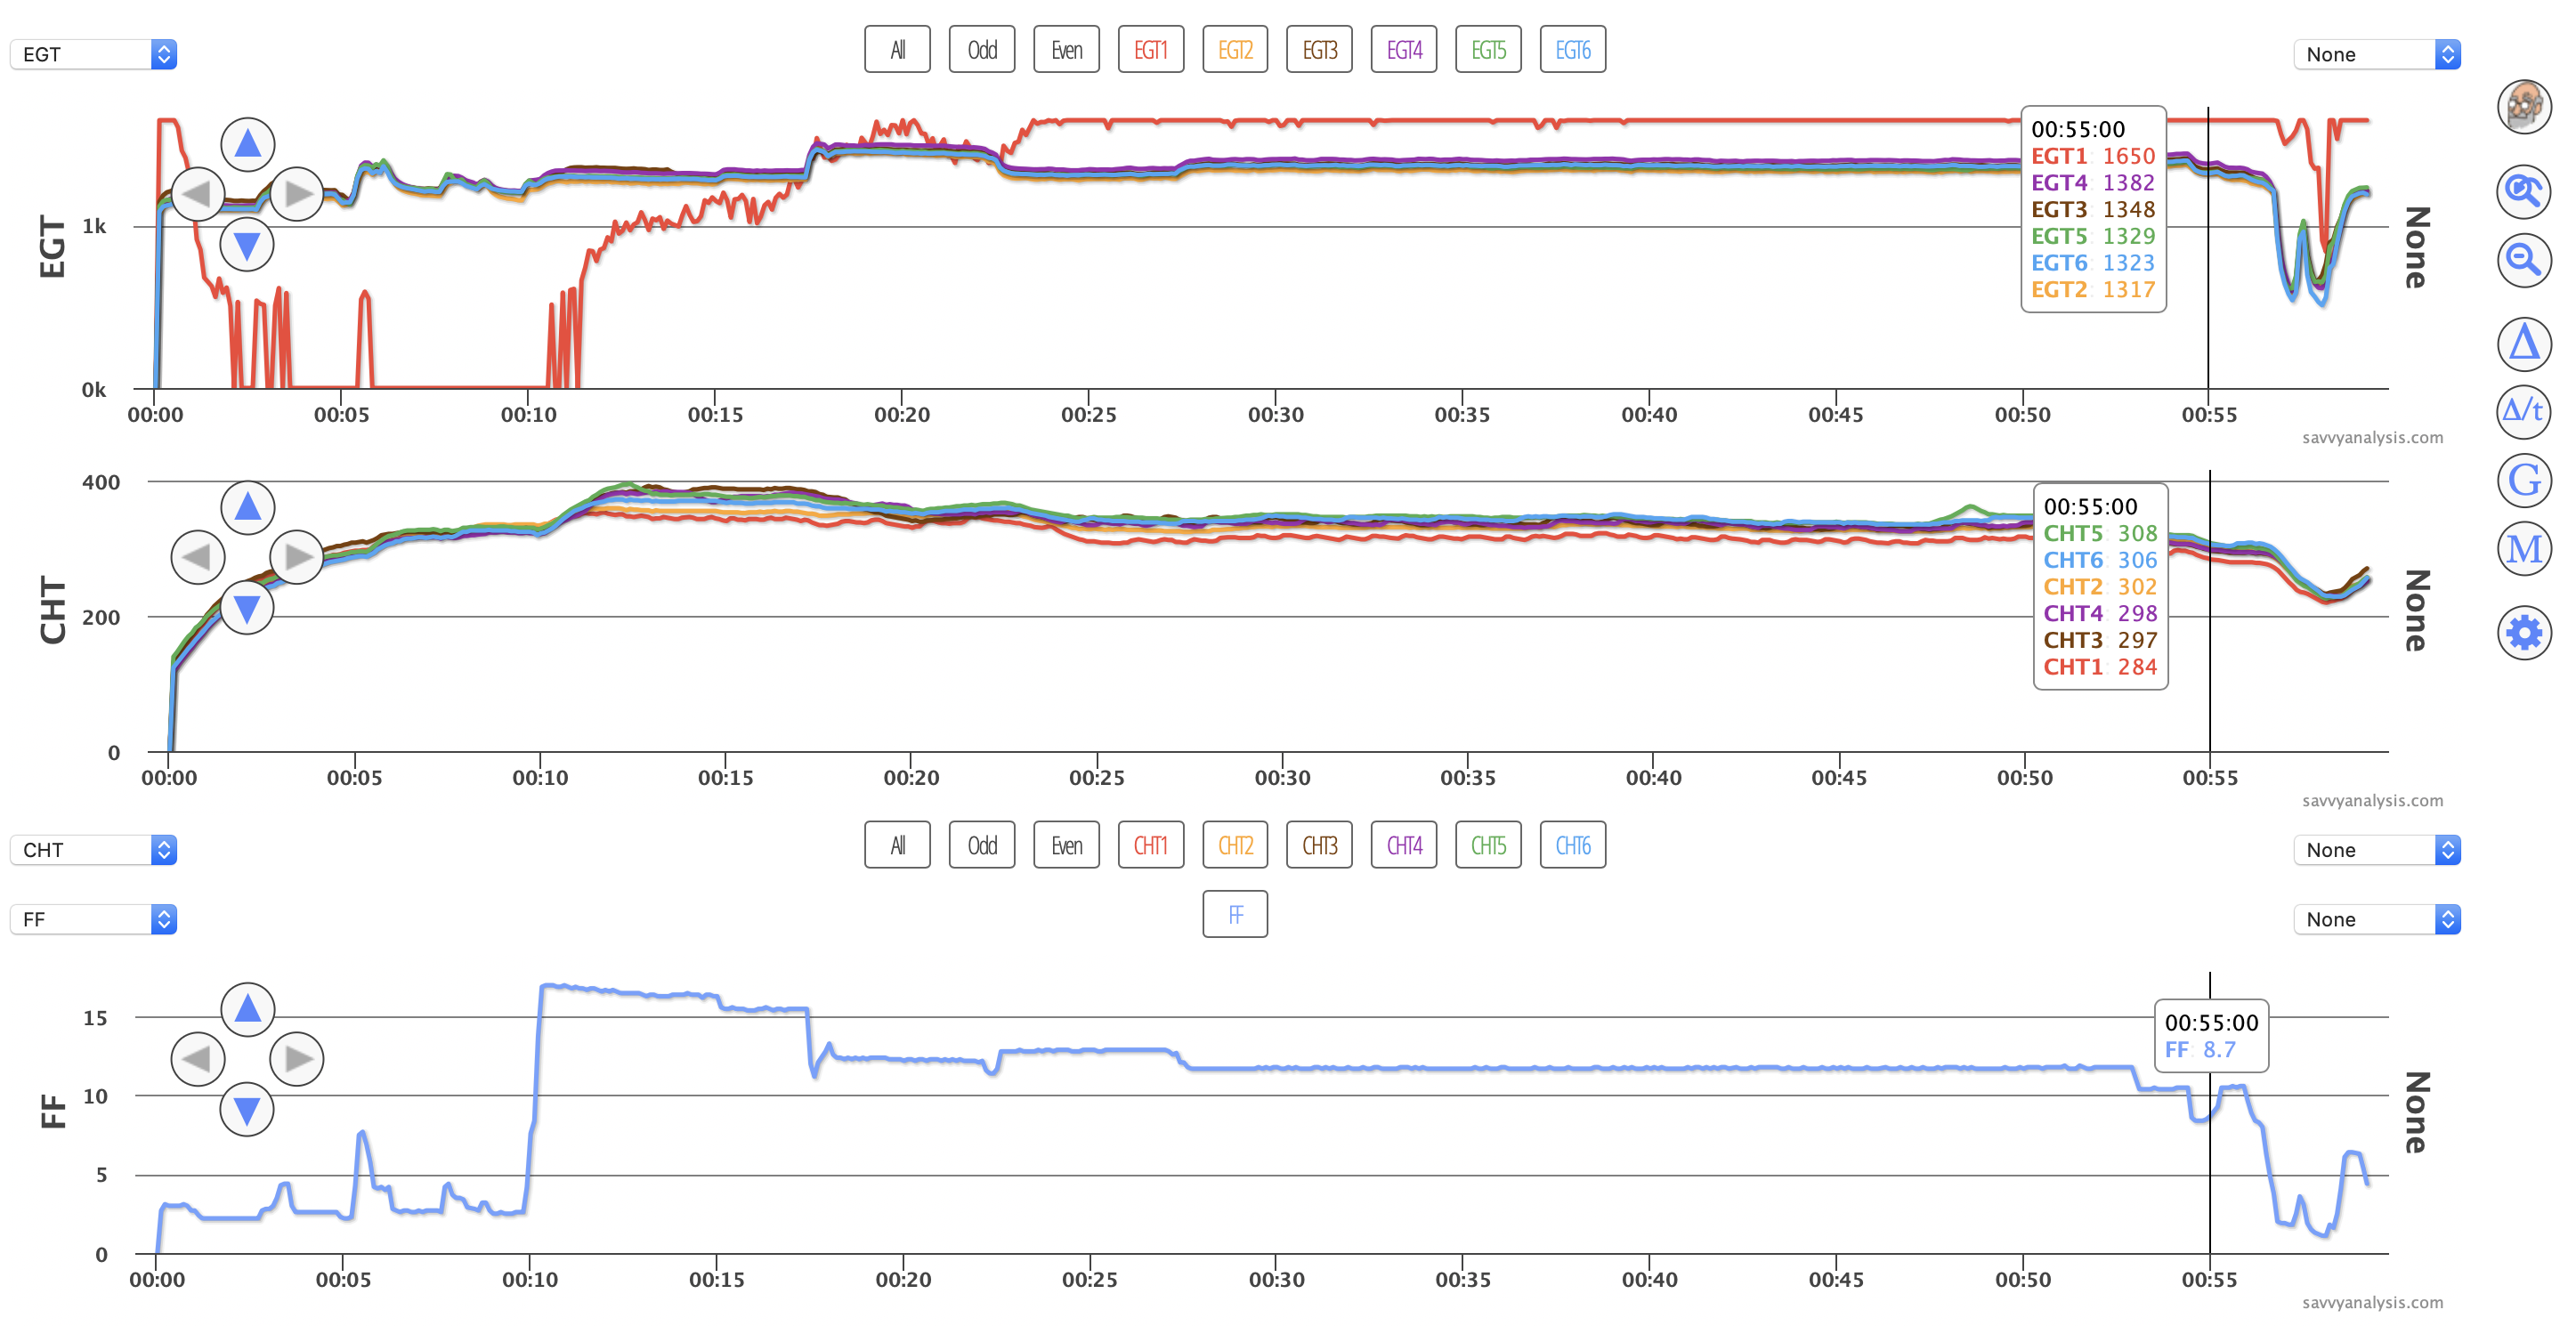
The initial reading is 1650° and as the engine warms up EGT 1 drops below the others, then bounces around between zero and about 500° it’s clearly not reliable, and if it stayed flatlined at zero would be easy to ignore. Power is applied at the 10 min mark, and just after that EGT 1 spikes a few times, then begins a jittery climb that ends with a flatline at 1650°. Since the data is not reliable, it would be hard to spot weak spark from one of the plugs, and hard to diagnose a clogged injector.
The workaround would be to depend on CHT 1. But that’s complicated because once the airplane is flying, CHT 1 drops below the others and develops a wavy pattern that continues until approach. So now you’ve got to ignore EGT 1 and hope that it’s not masking a problem in cyl 1 that could get worse as the flight continues.
Next is the first 1:20 of a longer flight in a Cessna P210 with a Continental TSIO-520 and data from an AuRACLE with a 2 sec sample rate. Again, EGTs on top, CHTs below that, and FF below that. The cursor is parked on the end of the runup where CHT 6 peaks at 599º.
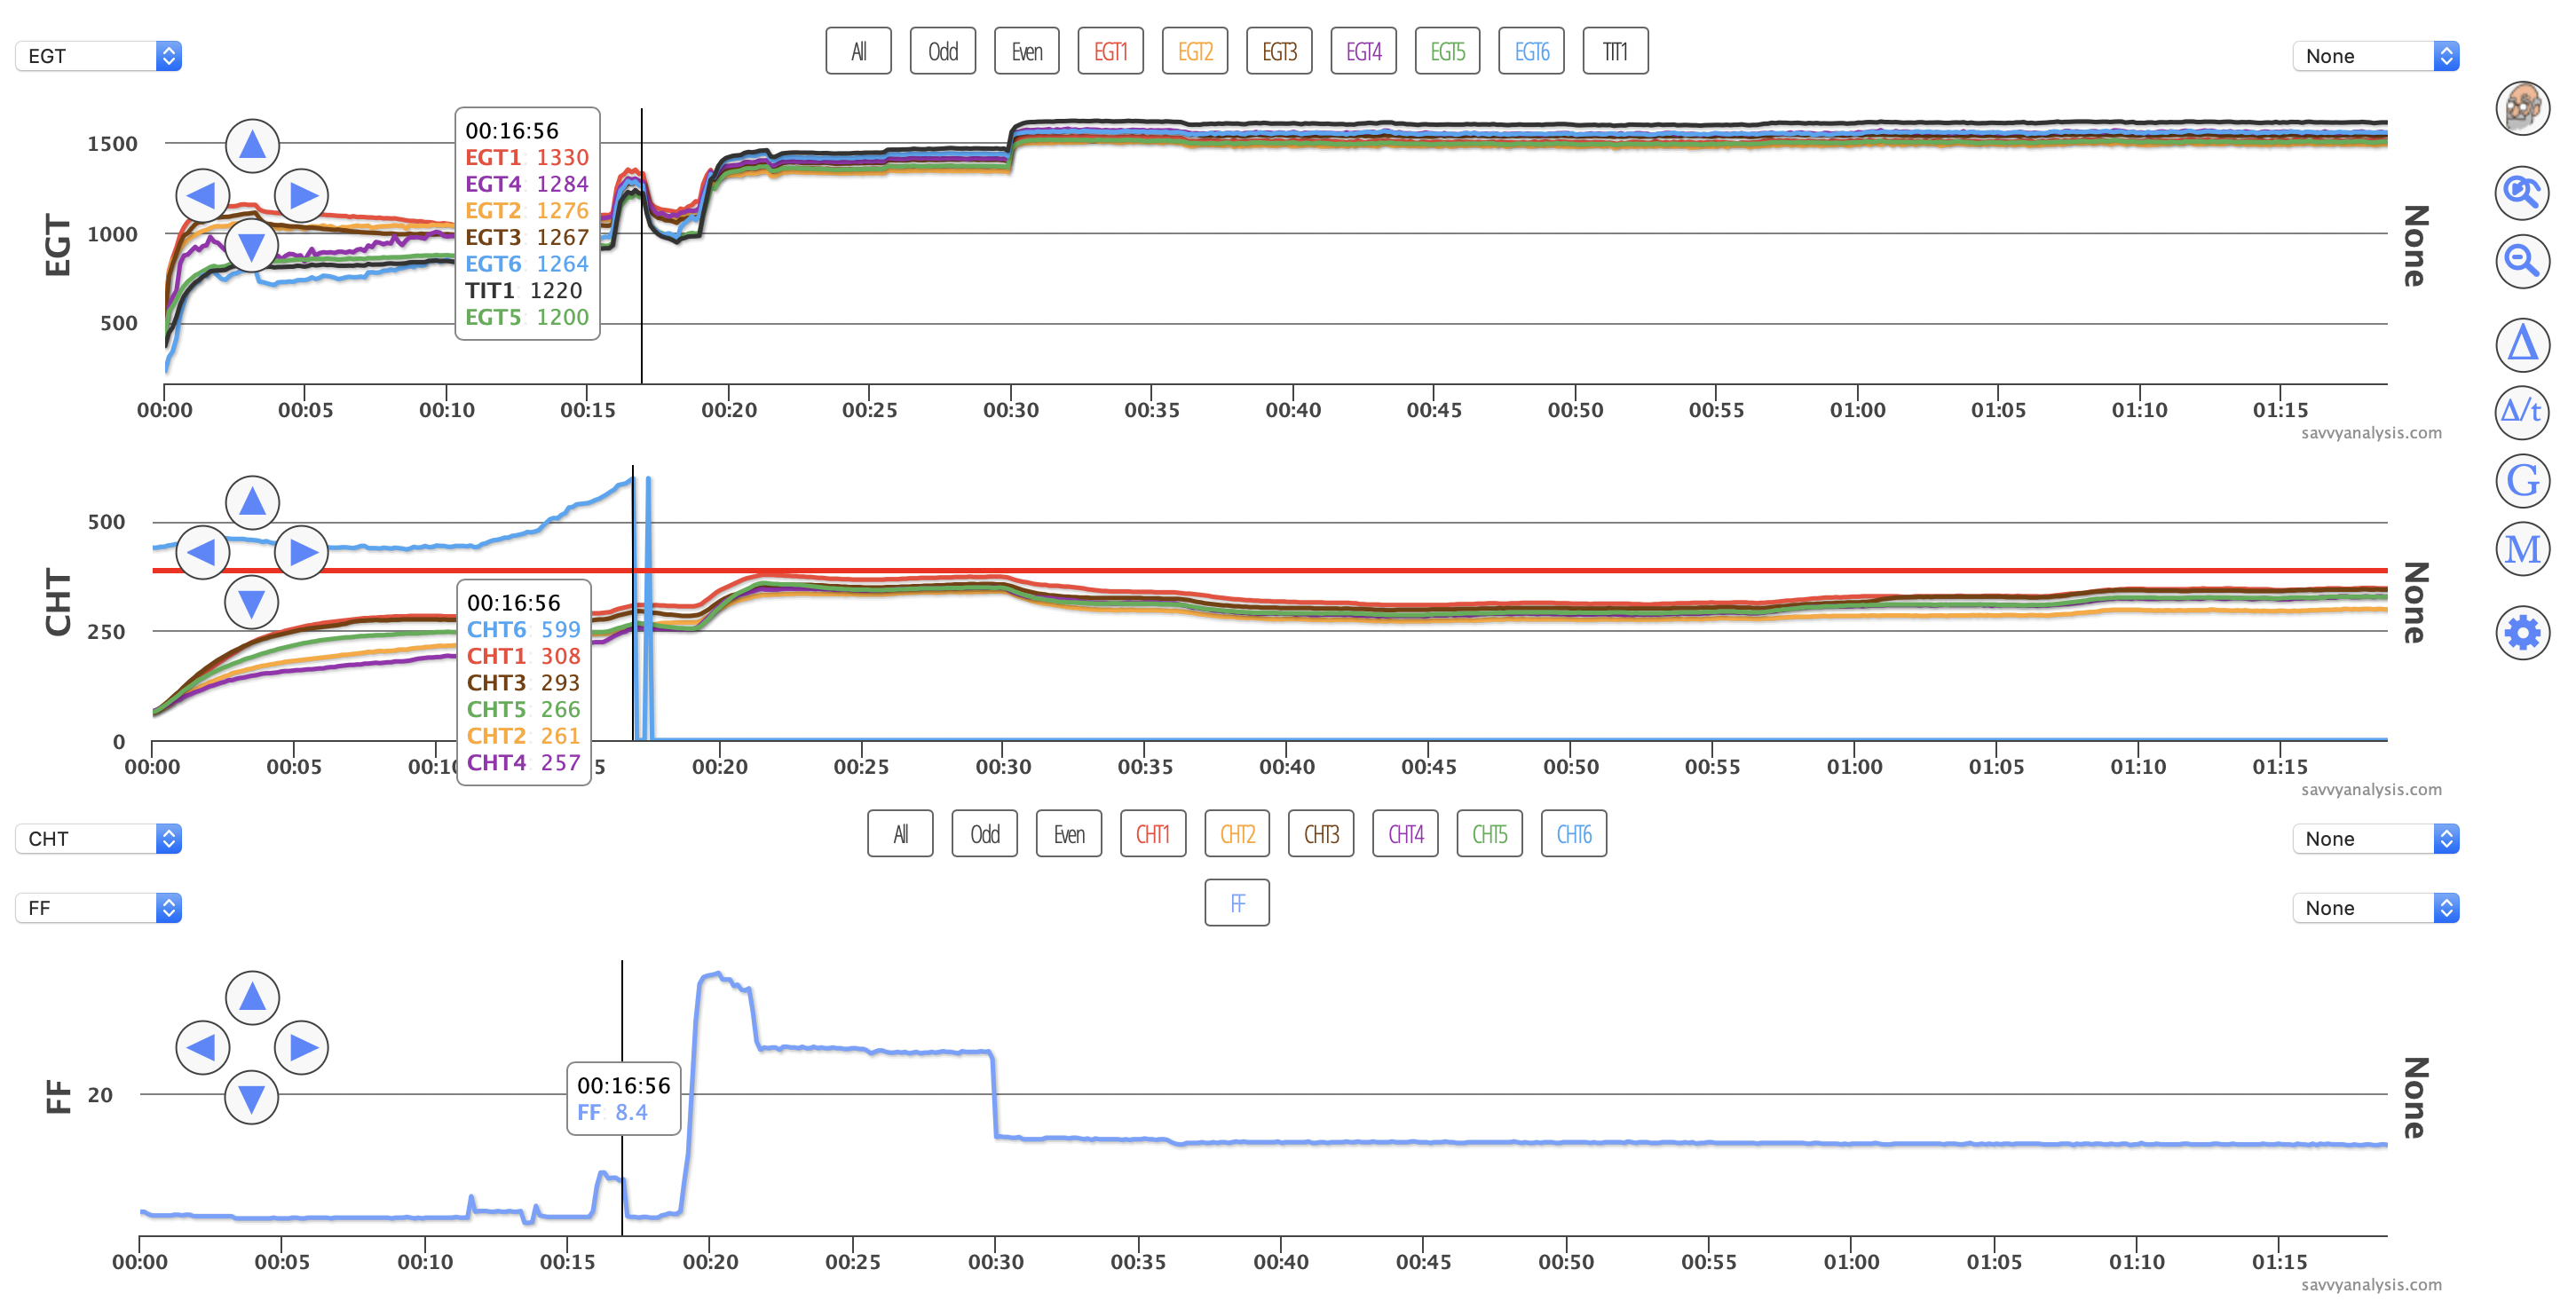
The red horizontal line is the CHT alert, which appears to be in the 400º neighborhood. So CHT 6 starts higher than that, which is instantly suspicious. Then it rises, drops, spikes, then flatlines at zero for the rest of the flight. Since probe failure is fact of engine monitor life, we’d just as soon see this type of “Last Hurrah” pattern when a probe fails.
On taxi out the pilot was probably thinking that CHT 6 was going to show hot during the flight, but by the time power is applied the show’s over. With CHT 6 data out of the game EGT 6 data becomes more important, and fortunately all EGTs and TIT are stable during the flight.
What’s the workaround for missing CHT data from one cyl? This is easier to see in post-flight analysis than in real time, but notice that when CHT 6 reaches its peak, its neighbors CHT 4 and 2 are the coolest. With any abnormality, we’re looking for other data to validate or corroborate or dispute the data. In this case, if cyl 6 were really that hot, we might expect nearby cylinders to read hotter too. We might also look at oil temp for corroboration.
Next is a flight from a Cirrus SR 22 with a Continental IO–550 and data from an Avidyne with a 6 sec sample rate. Once again, EGTs on top, CHTs below that, and FF below that. The cursor is on the first sample after engine start – at the 6 second mark.
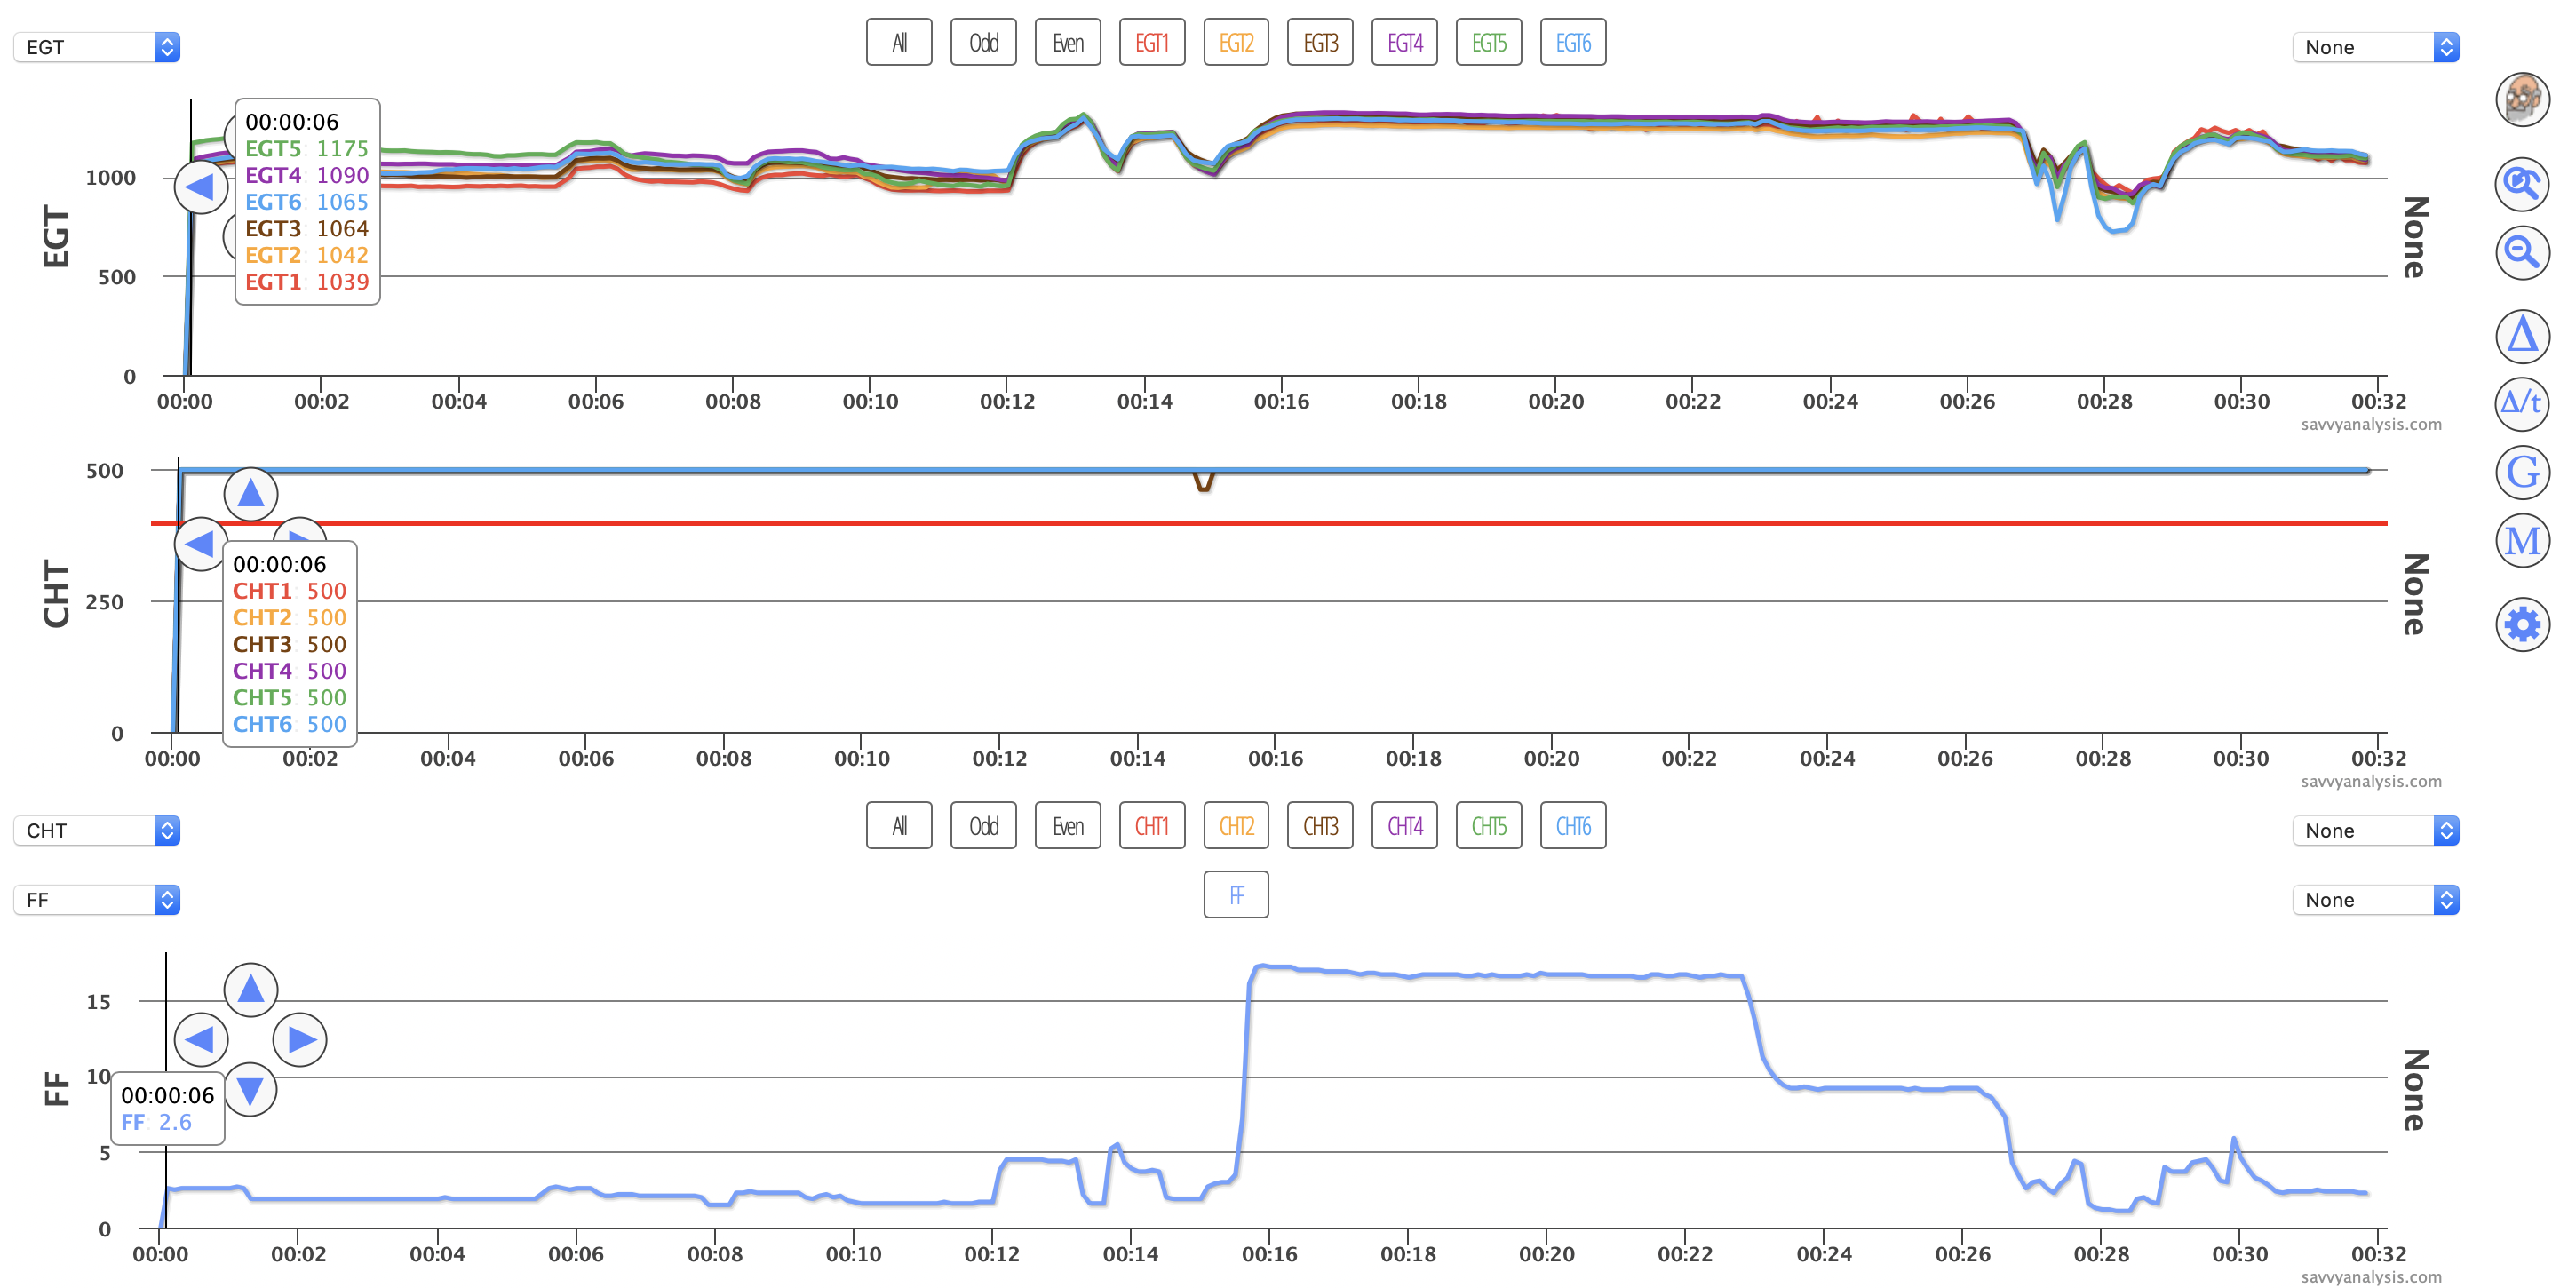
This is the entire flight – 32 mins with takeoff just before 16. Maybe it was always supposed to be a short flight. Part of me wants to believe that the pilot saw that all 6 CHTs were unusable, but thought they might read normally once power was applied. When that didn’t work out, it was smart to get back on the ground and sort things out.
Our CFIs told us to develop and then adhere to personal minimums for weather, stress and fatigue. The AIM calls it IMSAFE. Perhaps you already have personal minimums – stricter than those in FAR 91.213 – for your engine monitor data. Is it like chess, where different pieces have different values? Like a bad EGT probe is less critical than a bad CHT probe? And a failed oil pressure sensor is a no-go item? It’s no doubt different if your monitor is a primary instrument.
Whatever your minimums, there’s really no good workaround for taking off with all of your CHTs hitting the pegs. You could have an unusual combustion event like detonation or pre-ignition and the CHT data isn’t there to help you prevent it.
We’ll finish this month with a flight from a Bonanza F-35 with a Continental IO-470 and data from an EI UBG-16 with an 8 sec sample rate. This time it’s CHTs on top and EGTs below, and those are the only parameters this particular UBG logs. The cursor is on one of two spikes in the CHT data depicting CHTs in the 1400º range. Our parser auto-scales the vertical dimension of the graph, so the horizontal red CHT alert line at 400º is a lot further down than it would be without those spikes.
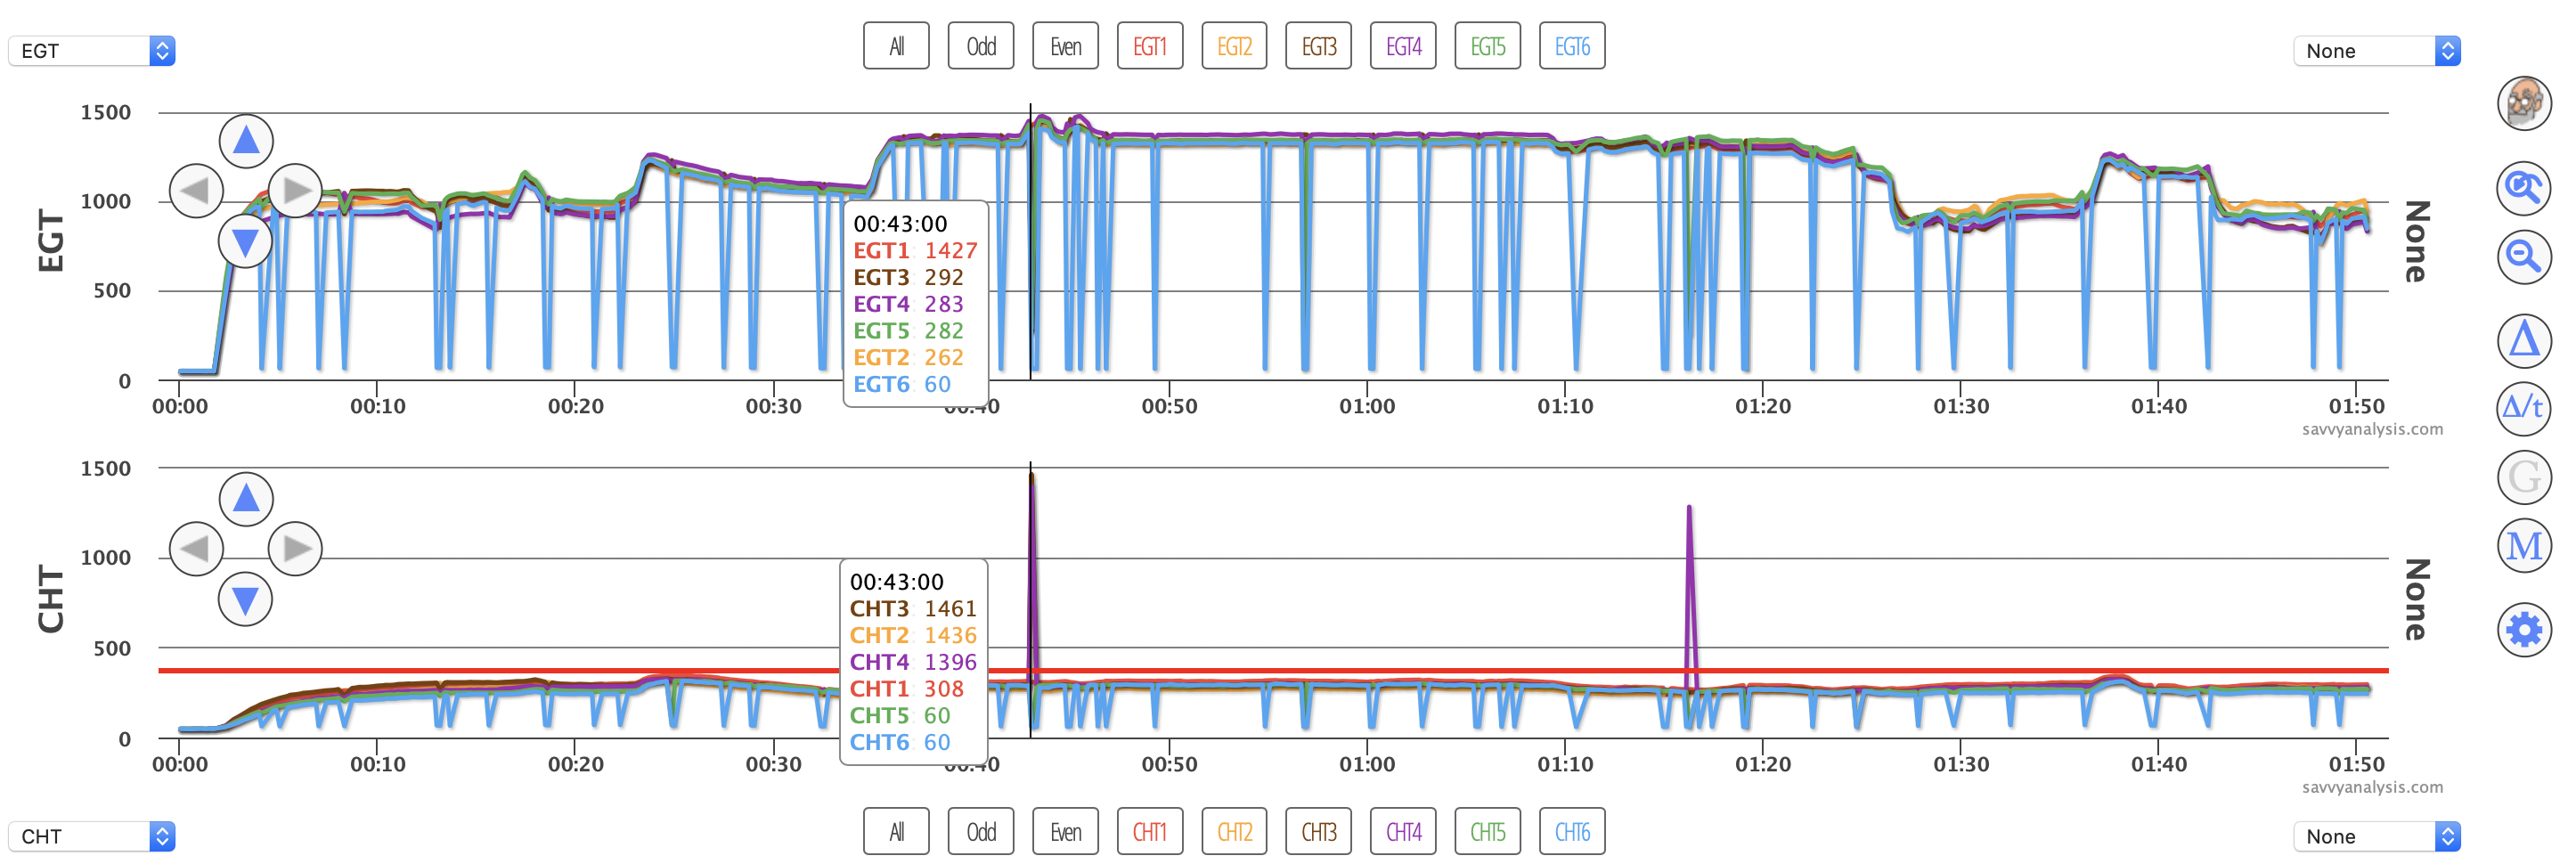
In case you’re saying “wait – the theme of this Puzzler is data we knew to be bad before takeoff, and this data looks ok until power is applied”. All true, and this one qualifies because of bad data in previous flights.
On the first of the spikes, where the cursor is, those EGT rises would seem to be an in-flight mag check. I don’t see a similar EGT rise at the second CHT spike.
Looking closely, the EGT down-spikes include all cyls except cyl 1, and EGT 6 drops more than the others. The CHT down-spikes seem limited to cyls 5 and 6, the up-spikes include 3, 2 and 4, and again cyl 1 seems unaffected. With fairly regularly-spaced events like this, it makes sense to check interference from strobes – although why it would leave CHT 1 alone and bother the others is a mystery.
We value engine monitor data for several reasons, but two stand out. In real time it helps us spot malfunctions and achieve maximum performance and efficiency. Post-flight analysis of a series of flights can help spot trends and achieve engine longevity. But the data in the box is only as good as what it gets from the probes on the engine.
