Someone sent me a link this week for a video of a controlled blast triggering an avalanche. That started me thinking about some of my favorite cinematic explosions: Denzel Washington blowing up an oil tanker in “The Equalizer”, Jeremy Renner’s adrenaline-addicted EOD character inside the kill zone in “The Hurt Locker”, pretty much any Bruce Willis, Stallone, Schwarzenegger or Michael Bay movie, Roy Scheider solving the shark problem in “Jaws”, the gas station in “The Birds”, the “Bridge Over the River Kwai”. “Skyfall” and Slim Pickens riding a missle into oblivion in “Dr. Strangelove.” Explosions are good IF they happen when and where we want them. And then there’s detonation.
Normal Combustion
It’s not fair to characterize the normal 4-cycle combustion event in our Continental and Lycoming engines as an explosion. Air and fuel arrive in the cylinder and wait until the spark plugs fire, typically 20-24º before top dead center. The fuel burns away from the spark until it’s gone; it takes about 6 milliseconds. At 2400 RPMs the crank is turning 40 times a second, so the next event is coming right up.
While there’s fire in the hole, the piston is moving, and peak cylinder pressure occurs at about 15-20º after top dead center, which is the optimum scenario for converting the energy from combustion into spinning the prop. The engine data would show normal EGTs and CHTs.
Detonation
When combustion of the air/fuel mixture occurs early, and the the piston’s not yet in position, we’ll get excessive cylinder pressure and temperatures and waves of pressure in the cylinder – detonation.
We know that detonation margins shrink as CHTs approach 400º. Let’s look at some recent data showing detonation with lower CHTs.
Here’s data from a Cessna 210 with a Continental IO-550-L with a turbo-normalizer, and data from an EI UBG-16.
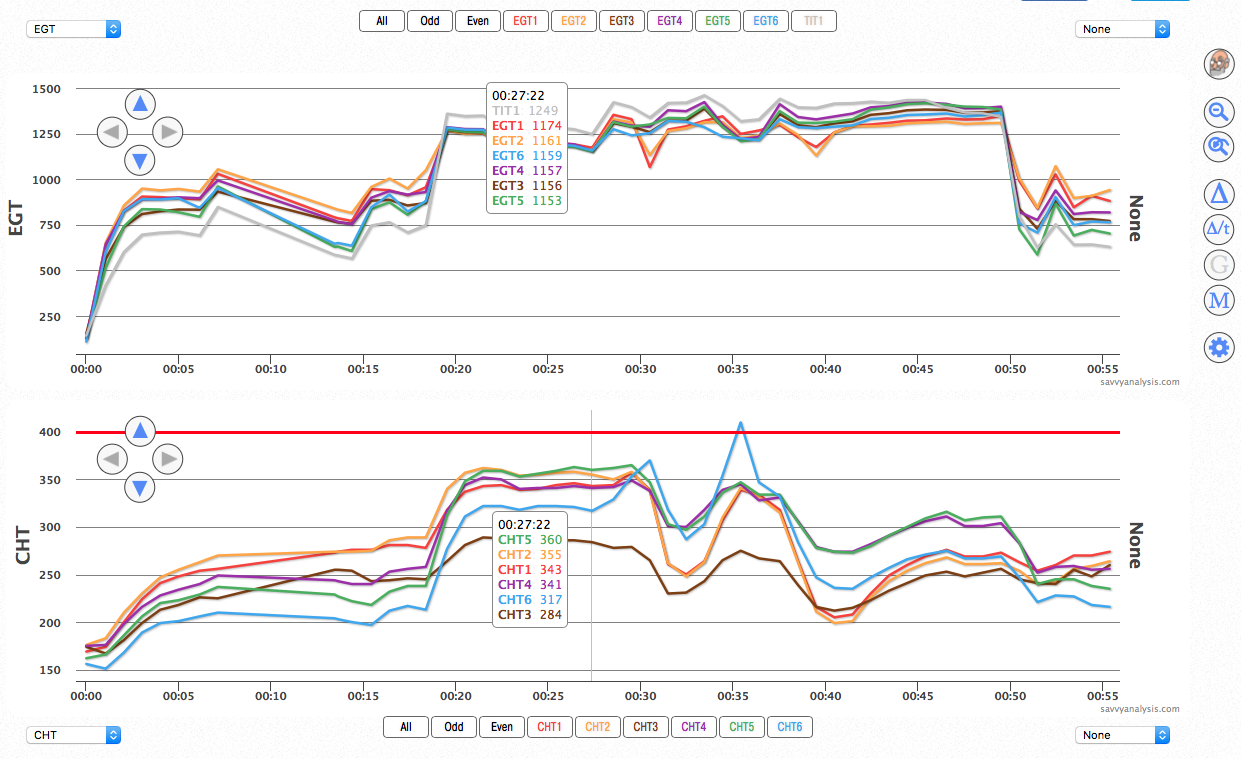
The cursor marks the spot where CHT 6 – the blue trace – starts its first climb. It peaks at about 370º, barely higher than CHT 5, and probably would not get your attention. EGT 6 is a bit lower there than the others, but nothing dramatic. Then just past the 30 min mark CHTs drop (MAP and FF aren’t logged but it looks like a power reduction), then CHT climbs to its peak just above 400º. After that, all looks normal.
Here’s the next flight a few days later.
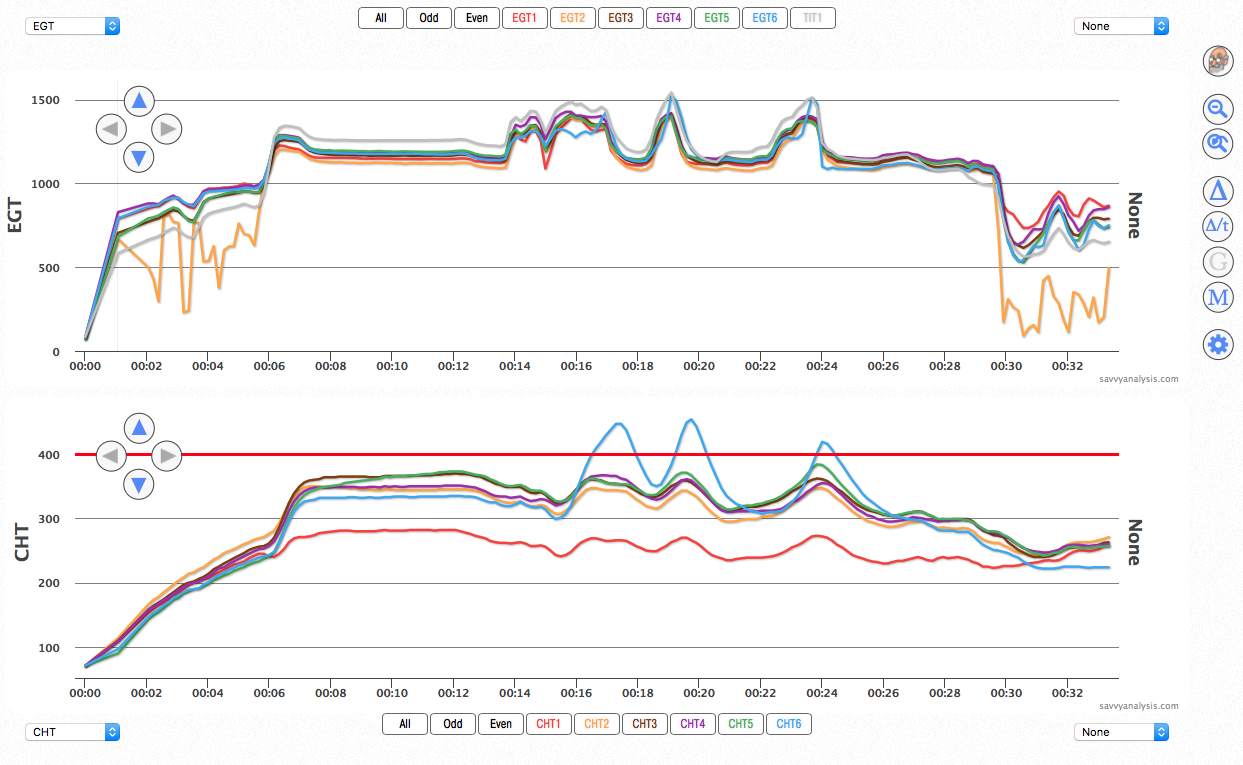
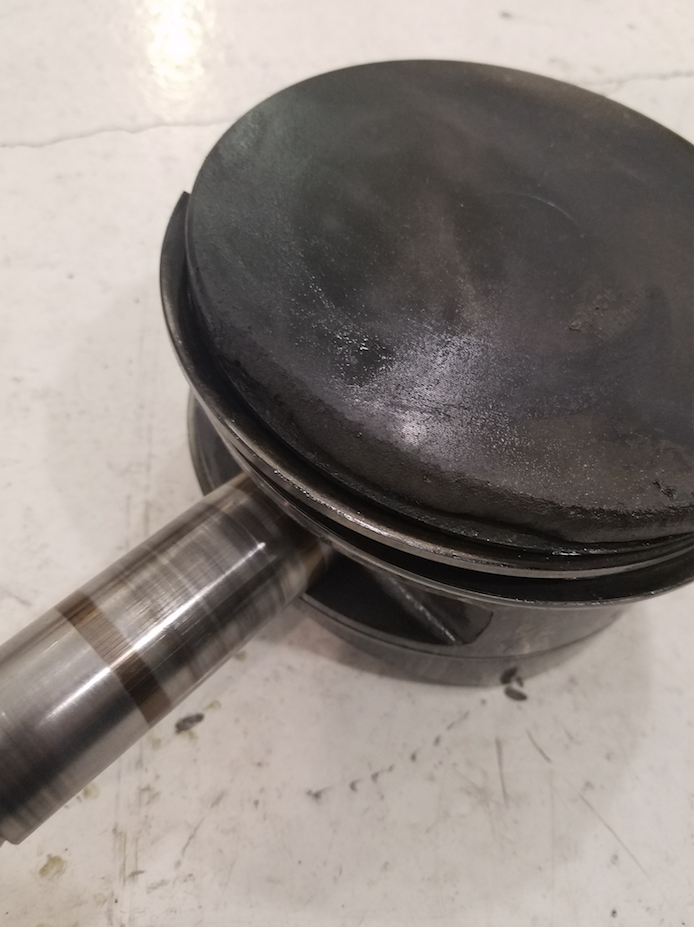
At the 16 min mark CHT 6 begins the first of 3 excursions past 400º. Before the CHT 6 climb, EGT 6 drops, then it mirrors CHT 6. This one caught the pilot’s eye, and when they pulled the cowl to investigate, they found blistered paint on the cylinder (evidence of high temps), and when they borescoped cyl 6 they found the spark plugs intact (sometimes detonation will cause fractured insulators and electrodes) and piston rings intact (detonation can cause broken rings), but there was damage to the piston.
Next we’ll look at data from an Extra 400 with a liquid-cooled Continental TSIOL-550 with data from a JPI 930.
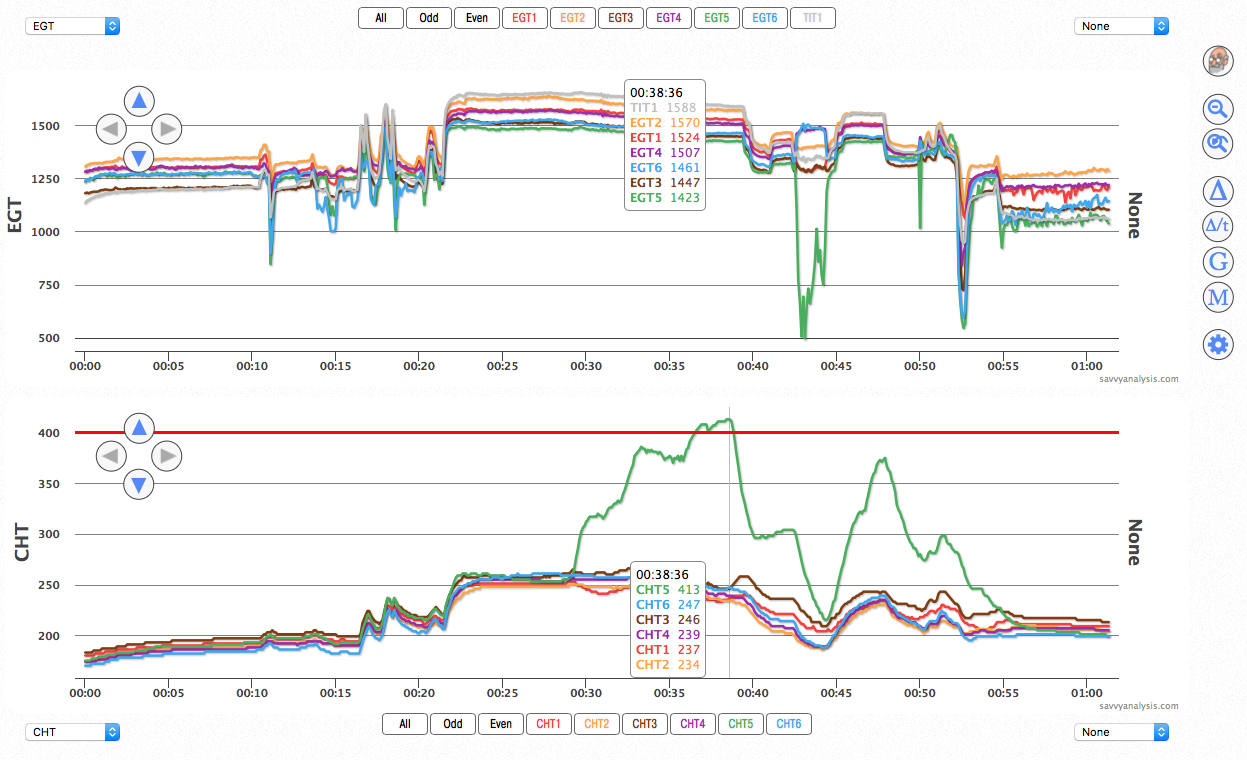
With detonation, we expect dramatically higher CHT and lower EGT – not necessarily dramatic for EGT but this time it is. On this event, CHT 5 -the green trace – just barely reaches 400º, after starting its excursion around 250º. So the liquid-cooling confounds the numbers a bit but the patterns are familiar.
Savvy Skunkworks
If you’re thinking “Hey, you guys came up with a computer algorithm that scans EGTs for the distinctive pattern of a failing exhaust valve (FEVA) – how about developing an automatic scan for detonation??” we’re already on it. It took a while with FEVA to weed out the false positives, so we weren’t flagging benign data. The detonation pattern will require some testing, too, but our skunks are hard at it.
Speaking of Dramatic EGT Drops…
Let’s be true to the article’s name and finish this month with a Puzzler. Here’s data from a Cirrus SR22 with a Continental IO-550-N and data from an Avidyne Entegra. In the first example from the 210 we saw CHT rises without the expected EGT drops. Here we see an EGT drop but its CHT counterpart doesn’t change.
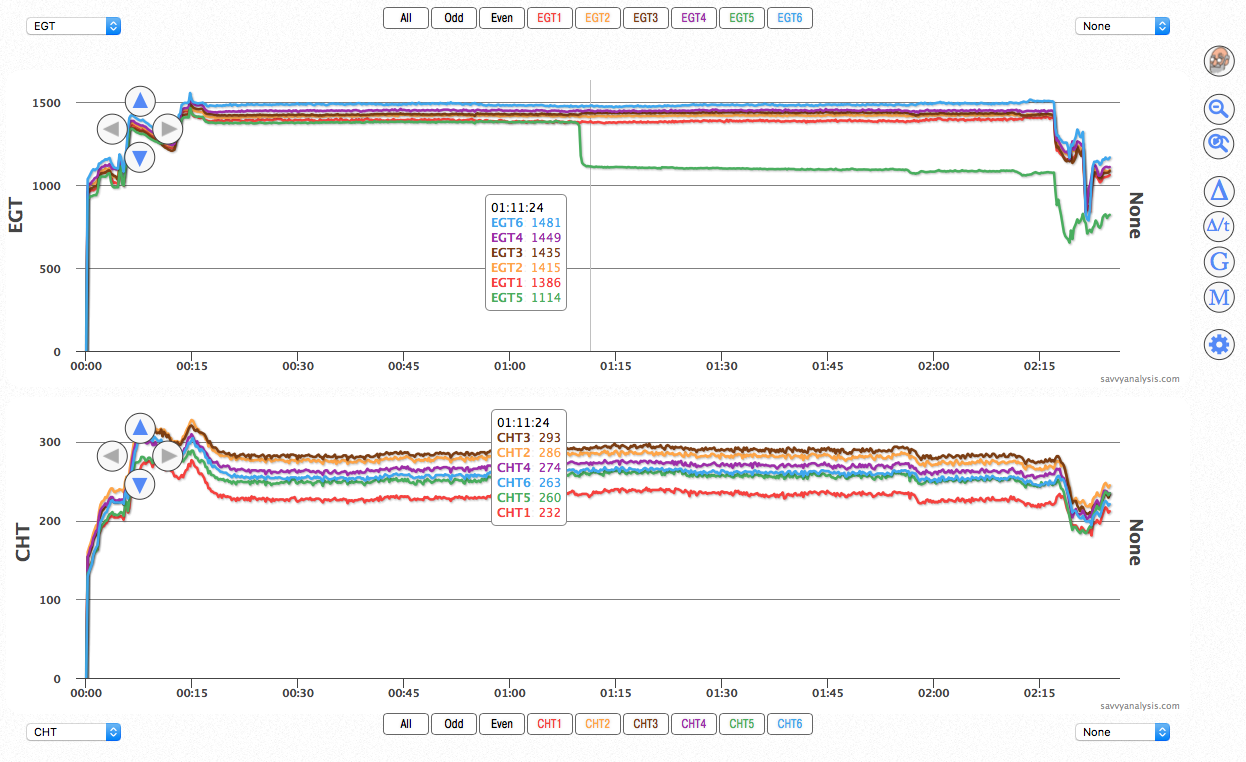
For the record, there were no changes in FF, RPM or MAP when EGT 5 – the green trace – drops. What could cause a drop in EGT with no corroborative drop in CHT? Let’s run through the options. Weak spark should send EGT higher because of less efficient combustion still occurring when the exhaust valve opens. A clogged injector should send EGT and CHT higher when rich of peak and lower when lean of peak. An induction leak should cause EGT and CHT to be higher throughout. Probes fail in a variety of ways so you can’t rule that out, but this looks like solid data that shows lower EGT all of a sudden.
We suggested checking the probe because even if the thought of a fine crack all the way around the exhaust riser right where it meets the head flange had occured to us, we’d have expected to see more symptoms – like higher CHTs in that area from the leaky exhaust, or maybe rough running because of the change in backpressure, or EGT being a little less stable.
No, the crack wasn’t big enough to torch nearby components, just big enough to let exhaust mix with incoming air (5 is in front on this engine) and lower the temp of the gases passing over the probe.
Before the overhaul, the owner made sure to Mouse-Milk the exhaust slip joints at every oil change. He didn’t get that chance, because this event happened 20 hours SMOH.
