NTSB concluded that Eastern flight 401 crashed into the Everglades in 1972 because all three crew members were fixated on a failed landing light. The lemonade was aviation’s adoption of CRM. As valuable as trustworthy engine data can be for the success of a flight and the goal of engine longevity, bogus data can create an uneasy feeling, and could cause a pilot to fixate, or do something unwise or unsafe or unnecessary. I thought I would devote this Puzzler to unusual patterns in the data, with the hope that reviewing these without a handful of airplane hurtling through the sky will make it easier to diagnose scenarios like this and make good decisions in the air.
First up is data from a Cirrus SR22 with a Continental IO-550-N using an Avidyne with a 6 sec sample rate. Fuel flow is displayed along with EGTs.
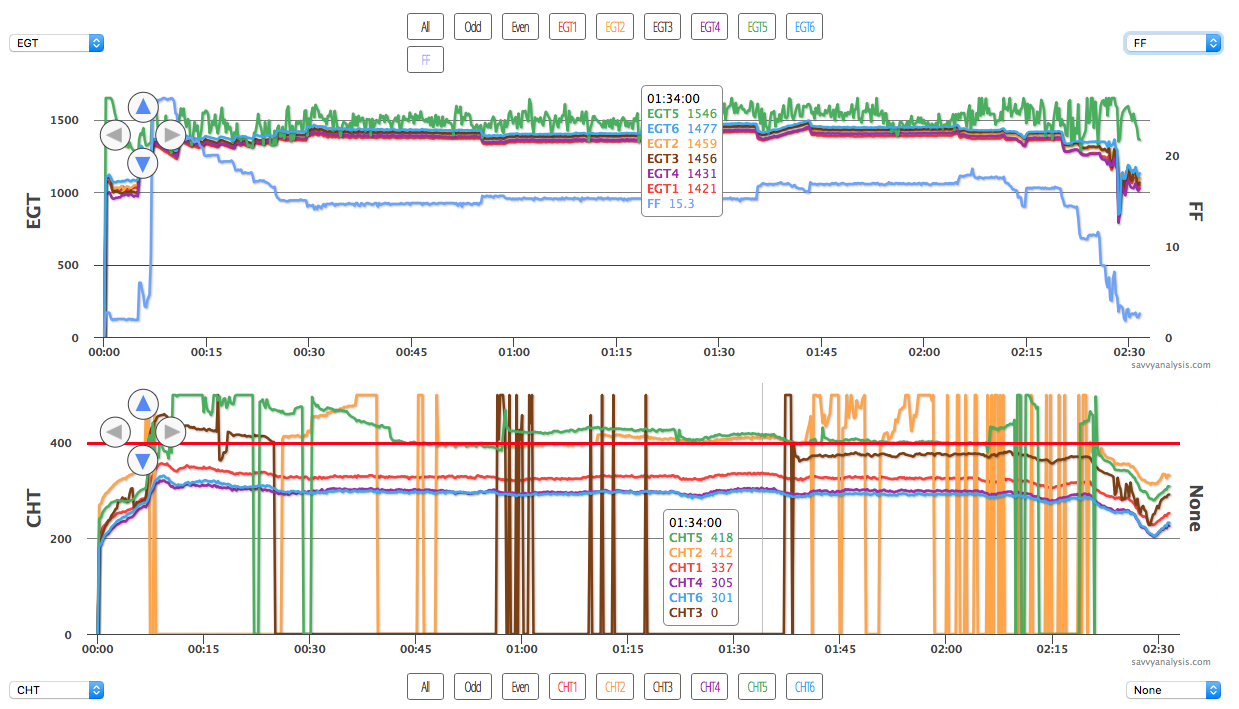
From my point of view, data like this is worse than having no data at all. Let’s start on the top with EGT 5 – the green trace. Its first reading is high, about 600º higher than the others according to the Y-axis scale on the left. Then it becomes jumpy and erratic for the rest of the 2.5 hr flight. If this truly reflected poor combustion in cyl 5, we’d expect the engine to be rough – and probably too rough for a 2.5 hr flight. But let’s think it through.
A clogged injector should send EGT higher at high fuel flows – then EGT should drop when FF is reduced, and might not have enough gas to support combustion. A clogged injector should also send that CHT higher, but CHT 5 is one of three CHT traces that are so erratic that we have to try to ignore them. EGT 5 doesn’t change when FF changes, so it’s not acting like a clogged injector.
A bad plug could send EGT higher, and this 70-100º range (above the average of the others) is in the area where we’d suspect weak spark. Since CHT is useless for corroboration, next best thing is vibration in the yoke. If it’s rough, it’s probably a bad plug or harness; if it’s smooth, it’s probably a bad probe or connection.
What can we say about the CHT probes? Three of them are normal, and the three that act up seem fairly normal at the bookends of the flight – during taxi. Cirrus uses Molex-type connectors to get data through the firewall, so when we see a group of three acting like this we’d start there. If EGT 5 isn’t a plug, it’s probably the probe. It always makes sense to check the connection first, but since there are no drops to zero or spikes to the ceiling – like we see in the CHT data – it’s probably the probe.
Next up is data from a Cessna 182 Skylane with a Lycoming IO-540 using a JPI 700 with a 4 sec sample rate. FF is displayed along with EGTs. CHT 3 – the dark brown trace – uses a spark plug gasket probe which reads lower.
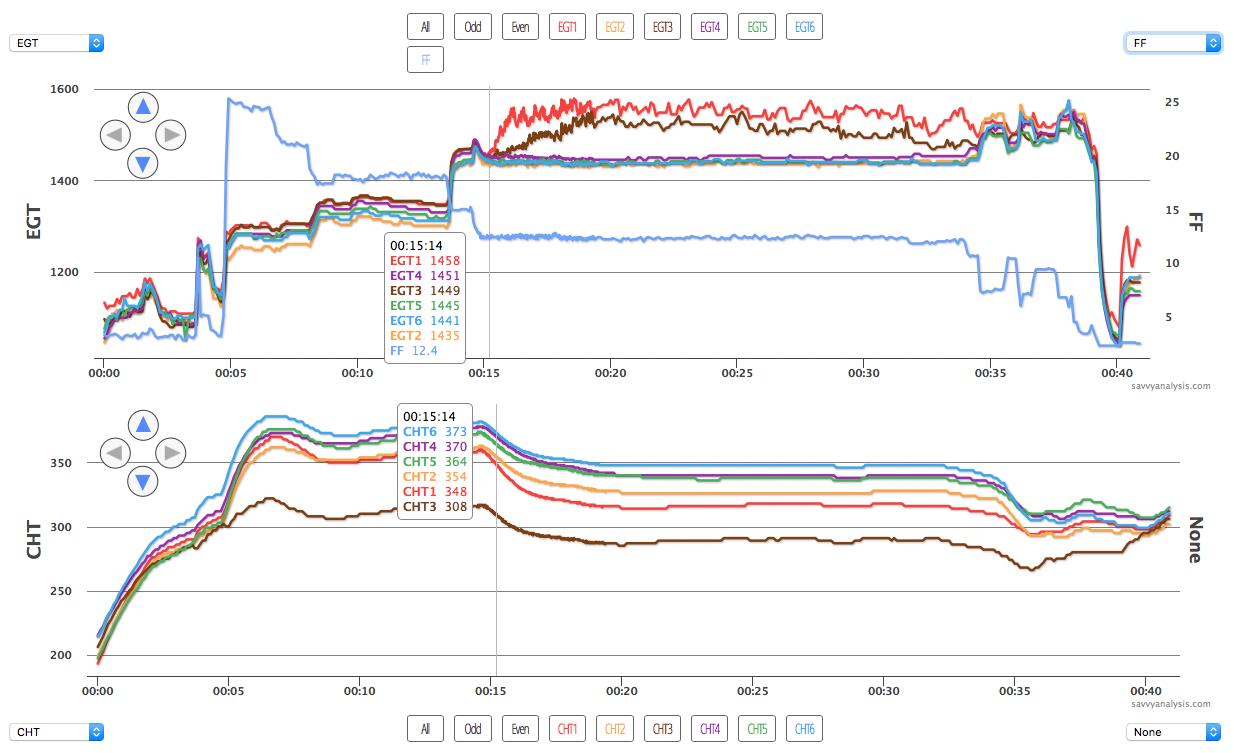
All’s well until the final leaning in cruise, then EGTs 1 and 3 jump out of the pack and begin bouncing around. All CHTs go lower there, but the trajectory of 1 is a little more than the others – 3 is about the same. They don’t act like clogged injectors because EGT and CHT move in opposite directions, and neither CHT was high earlier in the flight with higher fuel flows.
Here again empirical evidence is important. If the engine is running as smooth after the FF move as before, it’s probably bad data. If it’s as rough as we’d expect two – of six – cylinders misfiring to be, it’s probably bad plugs in 1 and 3. The fact that the pilot doesn’t try an increase in FF as a remedy is our clue that the engine was smooth and the data was just a distraction.
Next up is a Cessna 400 Corvalis with a Continental IO-550-N using an Avidyne with a 6 sec sample rate. MAP is displayed along with EGTs.
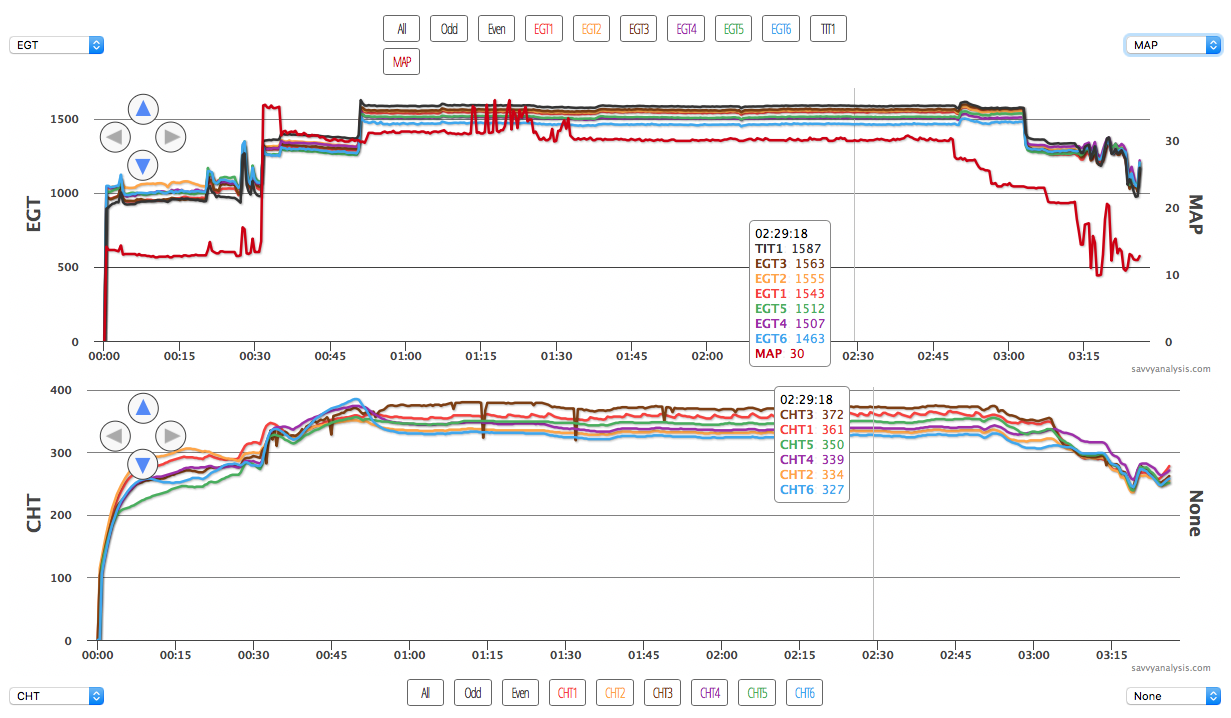
Let’s put this one into some context. We’ve got about a 3 hr flight ahead of us. The takeoff at about the 30 min mark suggests a prolonged wait for a clearance. Maybe the pilot needed a climb into the clag, maybe he just wanted a clearance through busy airspace. In the takeoff roll, CHT 3 drops a little, then recovers. It does that again in the climb. Minor nuisance, but still nothing requiring a change of plans.
The level-off at about 55 mins looks good, except CHT 3 goes higher than expected – but EGT 3 is ok. Then at 01:15 MAP starts jumping around, and in the middle of that CHT 3 drops again, further this time. No change in performance, FF and RPMs are steady and the engine is smooth. Are you already digging out approach plates for your “divert-to” airport, or are you comfortable ignoring the spikes and pressing on?
Then, about 15 minutes after MAP started its jumps, it settles down. CHT 3 gives you one big and one little drop, but it settles down, too. Then you notice that CHT 1 isn’t as steady as the others. That wavy pattern is easy to spot once the data has been uploaded for analysis – not so easy as it happens in real time. It goes up, it goes down again. Is it going to go higher, or lower, next time? And even if you’re perceptive enough to sense the pattern in real time, should you be devoting that much time to one engine parameter?
Next up is another Cirrus SR22 with a Continental IO-550-N using an Avidyne with a 6 sec sample rate.
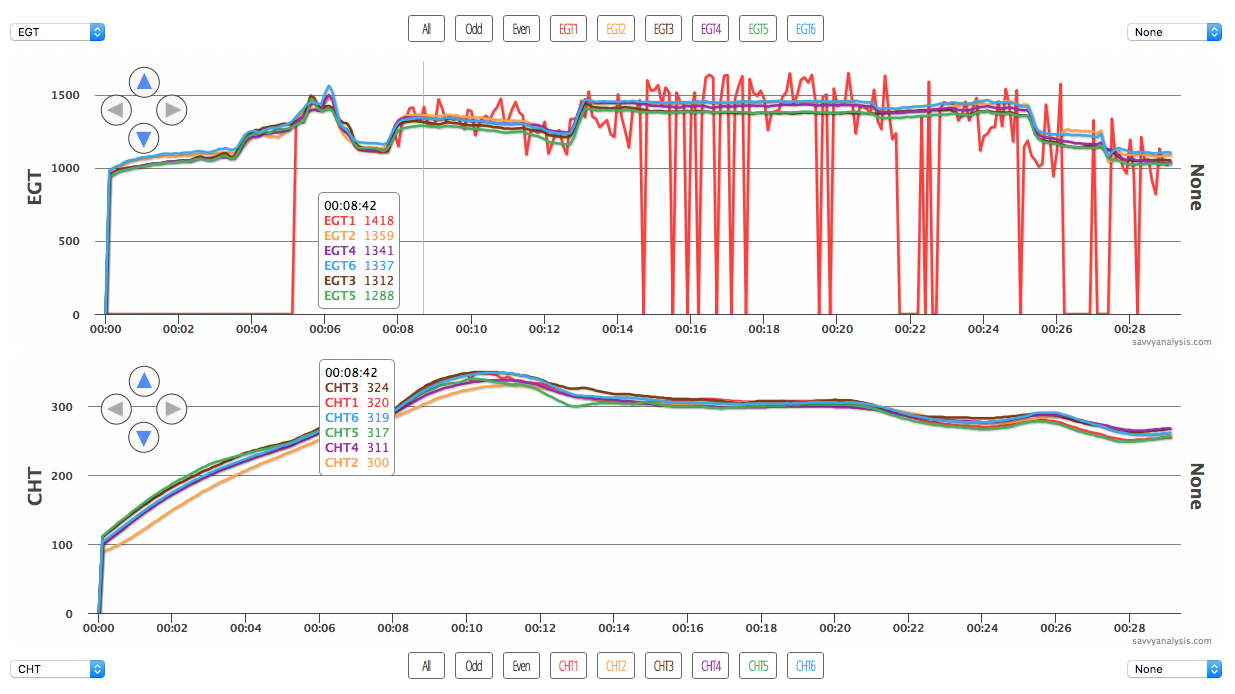
Realizing that Murphy has his own agenda about when you’re going to get your distracting bogus data, let’s say it’s your birthday and you get to choose one. Do you want your bad data right after engine start, so you have to consider whether to postpone the trip, or during the takeoff roll, so you have to consider aborting the takeoff, or in climb, so you have to consider returning to land, or in cruise, so you have to consider diverting from your destination? Of course you want it on short final or as you rollout after landing so you don’t have to change a thing – that wasn’t one of the options.
On this flight, the pilot gets a little of each. At engine start, EGT 1 is zero. But CHT 1 is ok and the engine’s running smooth, so clearly cyl 1 is firing and the data is bad. Then in the taxi-out EGT 1 looks ok and passes the two EGT humps of the runup. Takeoff is fine, then EGT 1 starts bouncing up and down. Dang, it was easier to ignore when it was zero. You finish the climb, level off and then it goes nuts. Makes you wish we had one of those rubber soap-dish things that we use to cover up a failed gyro instrument – but just for EGT 1.
We’ll finish this month with another Cirrus SR22 with a Continental IO-550-N using an Avidyne with a 6 sec sample rate. Fuel flow is displayed along with EGTs.
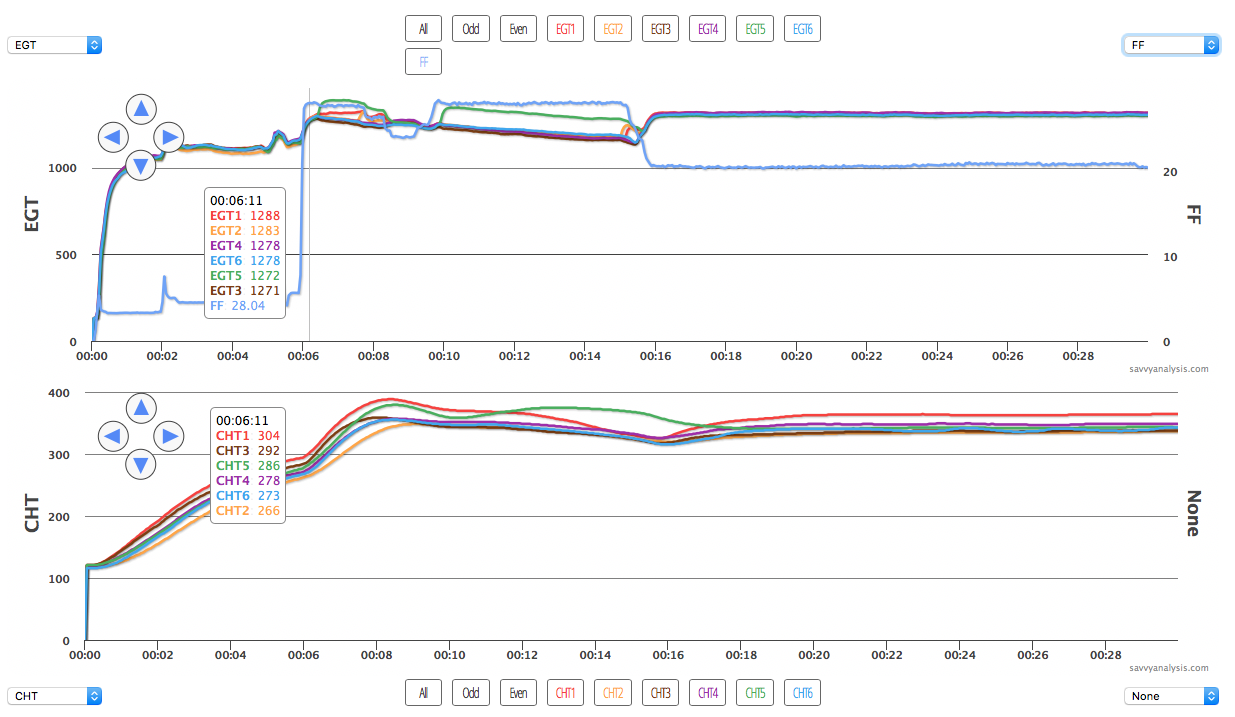
Earlier we ruled out clogged injectors based on what we’d expect to see – here’s a real example. EGT and CHT 5 are fine at idle FF, and actually fine right at the cursor when takeoff power is applied. A couple of samples later, EGT and CHT 5 climb, as do EGT and CHT 1. When the pilot briefly reduces FF in the climb, EGTs 5 and 1 respond instantly – CHTs 5 and 1 take longer to dissipate the extra heat. When FF goes back to max, this time EGT and CHT 5 go up but cyl 1 stays normal.
When two or more injectors clog, you have to consider the spider – the fuel distributor at the top of the engine – especially if we see clogs moving around the engine randomly. In this case, it’s more likely at the injector end, and the clog is small enough to allow for normal ops at idle and cruise, and almost full fuel flow at takeoff. It’s the last couple of GPH where it shows up.
Perhaps someday our engine data monitors will come with BS detectors – the marketing department will probably rename them reliability evaluators. “Your EGT 1 data has four Pinnochios – ignore it and continue your flight.” Until that day comes, we have to be the BS detectors and use the data that helps us and try not to fixate on the bogus stuff.
