Years ago, when we noticed that one of the data signatures of a burning valve was an oscillating pattern in the EGT trace, we got excited about the prospect of setting up automatic scans for other parameters. Would we be able to write a program that would identify a bad probe, or a clogged injector or an induction leak as part of the upload? As we started to incorporate more machine learning and AI into analysis, we kept getting closer to the day when the we could rely on the software to triage the data and gather files with anomalies into a queue for further review. And now we’re here.
It’s still very much a work in progress and there’s plenty left to do, but GADFly is scanning the data of normally aspirated Cirrus SR22s and flagging files for a closer look. Once we’re confident that we’ve properly trained the model, we’ll deploy it to other makes and models. I got into a couple of discussions at Oshkosh with fellow data nerds, and we agreed that the data gathering is in a pretty good spot. Probes are pretty reliable, and the data displays are comparable to what you would find in a biz jet or a newer model high-end sedan. It looks like the upcoming action and innovation will be in analyzing and comparing the data. Bring it on.
Let’s start this month with a Cirrus SR22 powered by a Continental IO–550 with data from a Garmin Perspective with a 1 second sample rate. GADFly flagged an anomaly in oil pressure. Here are EGTs and oil pressure, with CHTs and FF below.
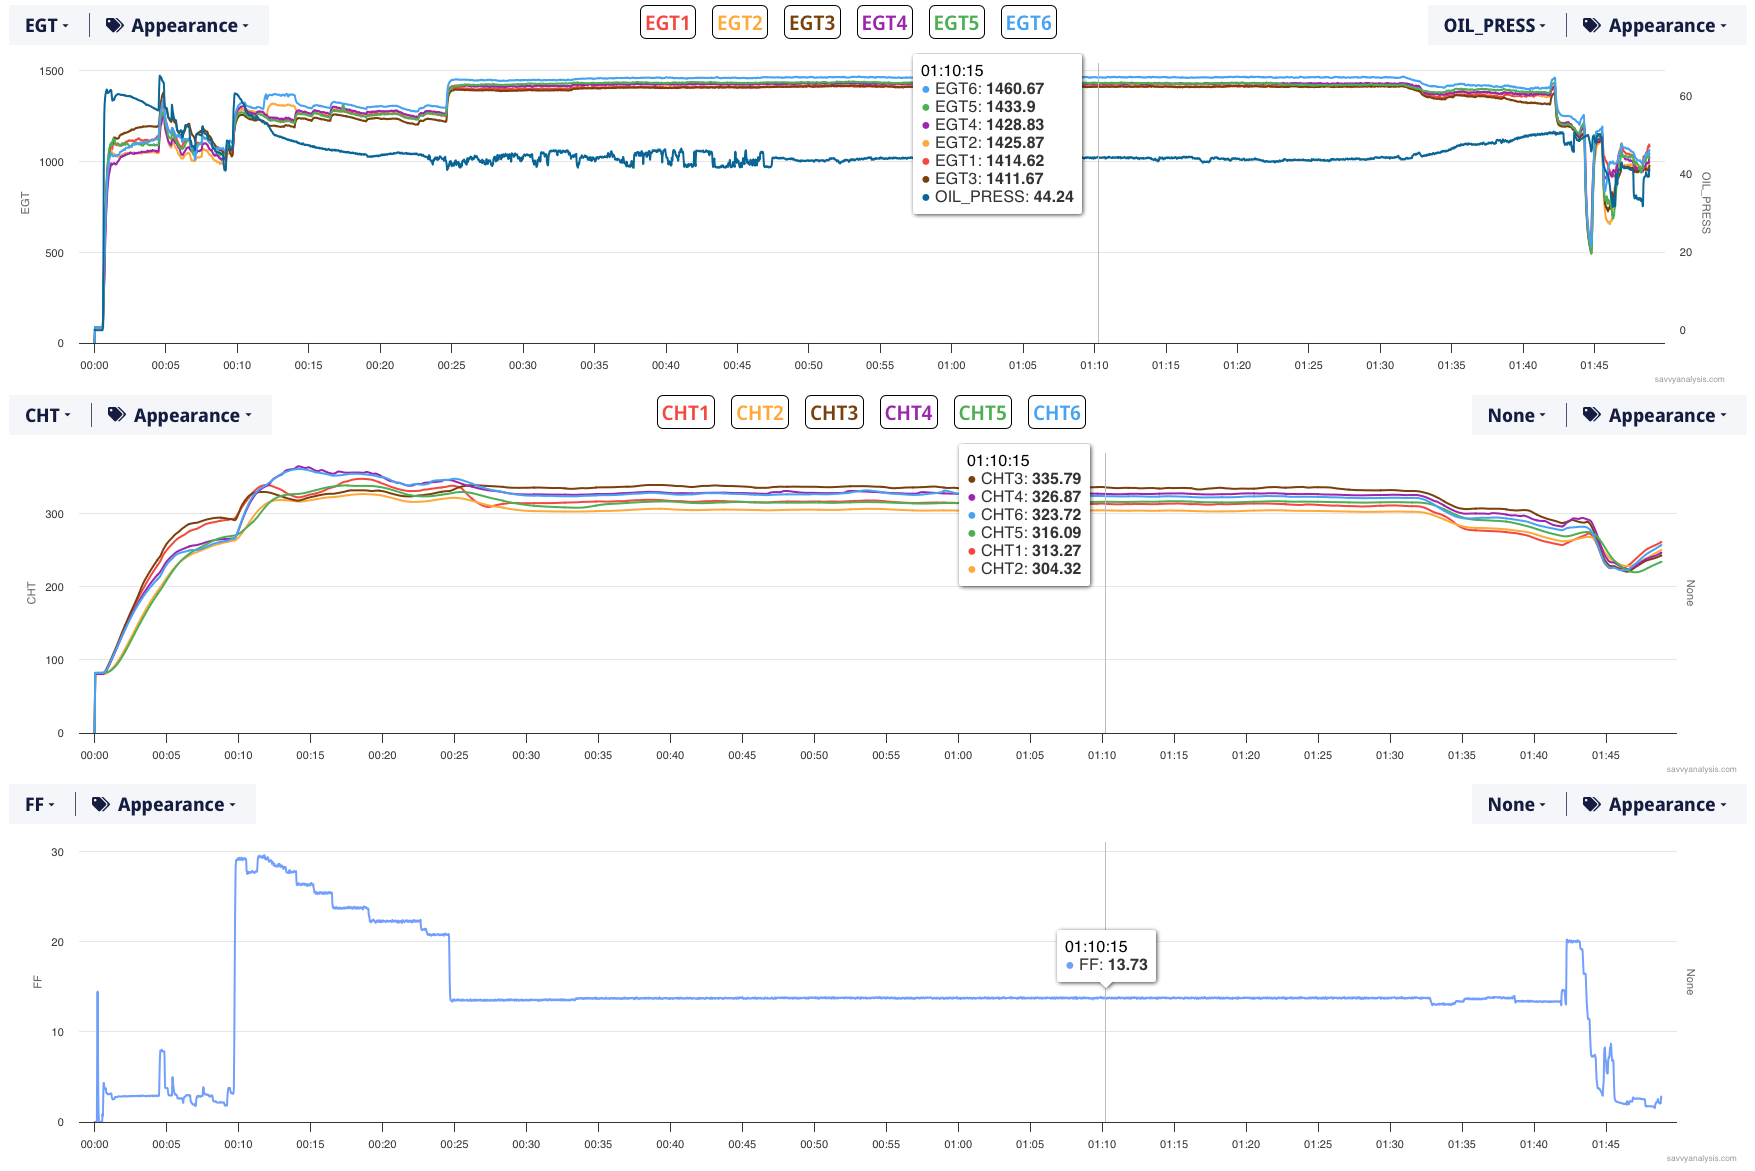
Pressure steadily drops throughout the climb, then gets jittery when the pilot noses over for cruise. Let’s take a closer look at that. Here’s the climb and early cruise with altitude and true airspeed depicted.
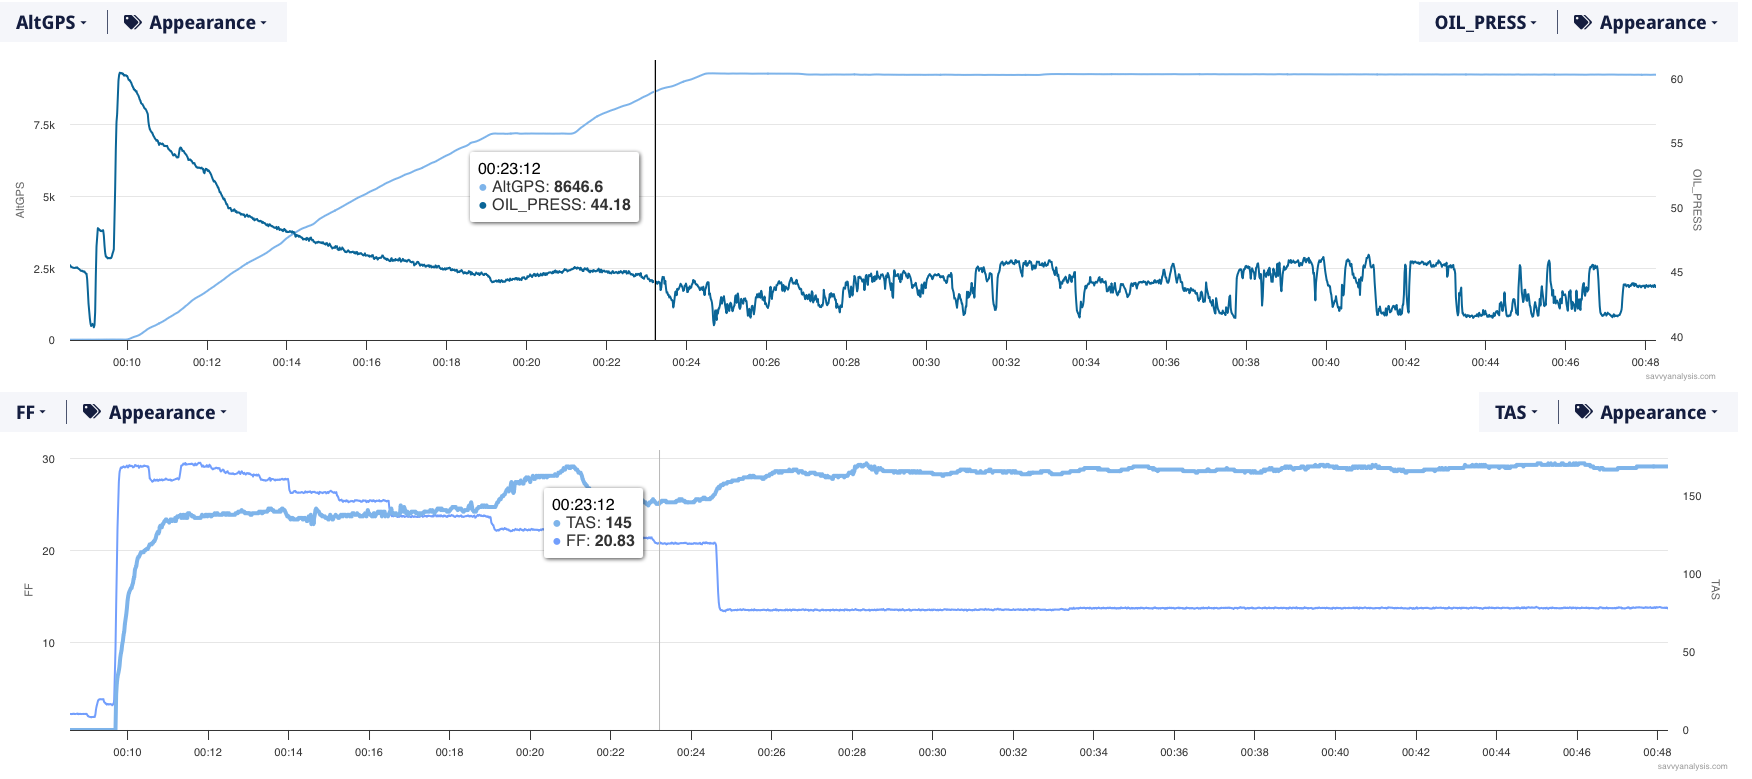
Are these real fluctuations in oil pressure or is it a sensor malfunction? If the jumpiness began at or after the nose-over and the increase in speed and airflow, you could make a case for a loose wire. Then you have to answer why does it stop 15 minutes later when altitude and speed haven’t changed. But you have the same problem if you think these fluctuations are real. In either case, the jumpiness begins just before the nose-over and after TAS has dropped a little. So what looked like connected dots when the data was zoomed out aren’t making the case up close.
When GADFly finds an issue like this a human reviews it, and we either dismiss it or we contact our client. In this case the question was, did you notice the fluctuation and was there any engine roughness during that time?
The client did notice the fluctuation, but there was no roughness. Looking at other flights just before, and just after this one, we saw similar moves in oil pressure in a few of them, but not all of them. It was starting to look more like a sensor issue. This client has Savvy QA, so I asked Brandon to take a look. And right away, he suspected a sensor issue which was addressed in SB2X-79-08. In 2018 Cirrus began recommending remote-mounting the oil pressure sensor to reduce vibration. Nice catch, GADFly.
Next is a Cessna Turbo 210 powered by a Continental TSIO–520 with data from an insight G2 with a 1 second sample rate. Here are EGTs, CHTs and FF for a recent 3 hour flight. Cursor is off to the left to keep it out of the way.
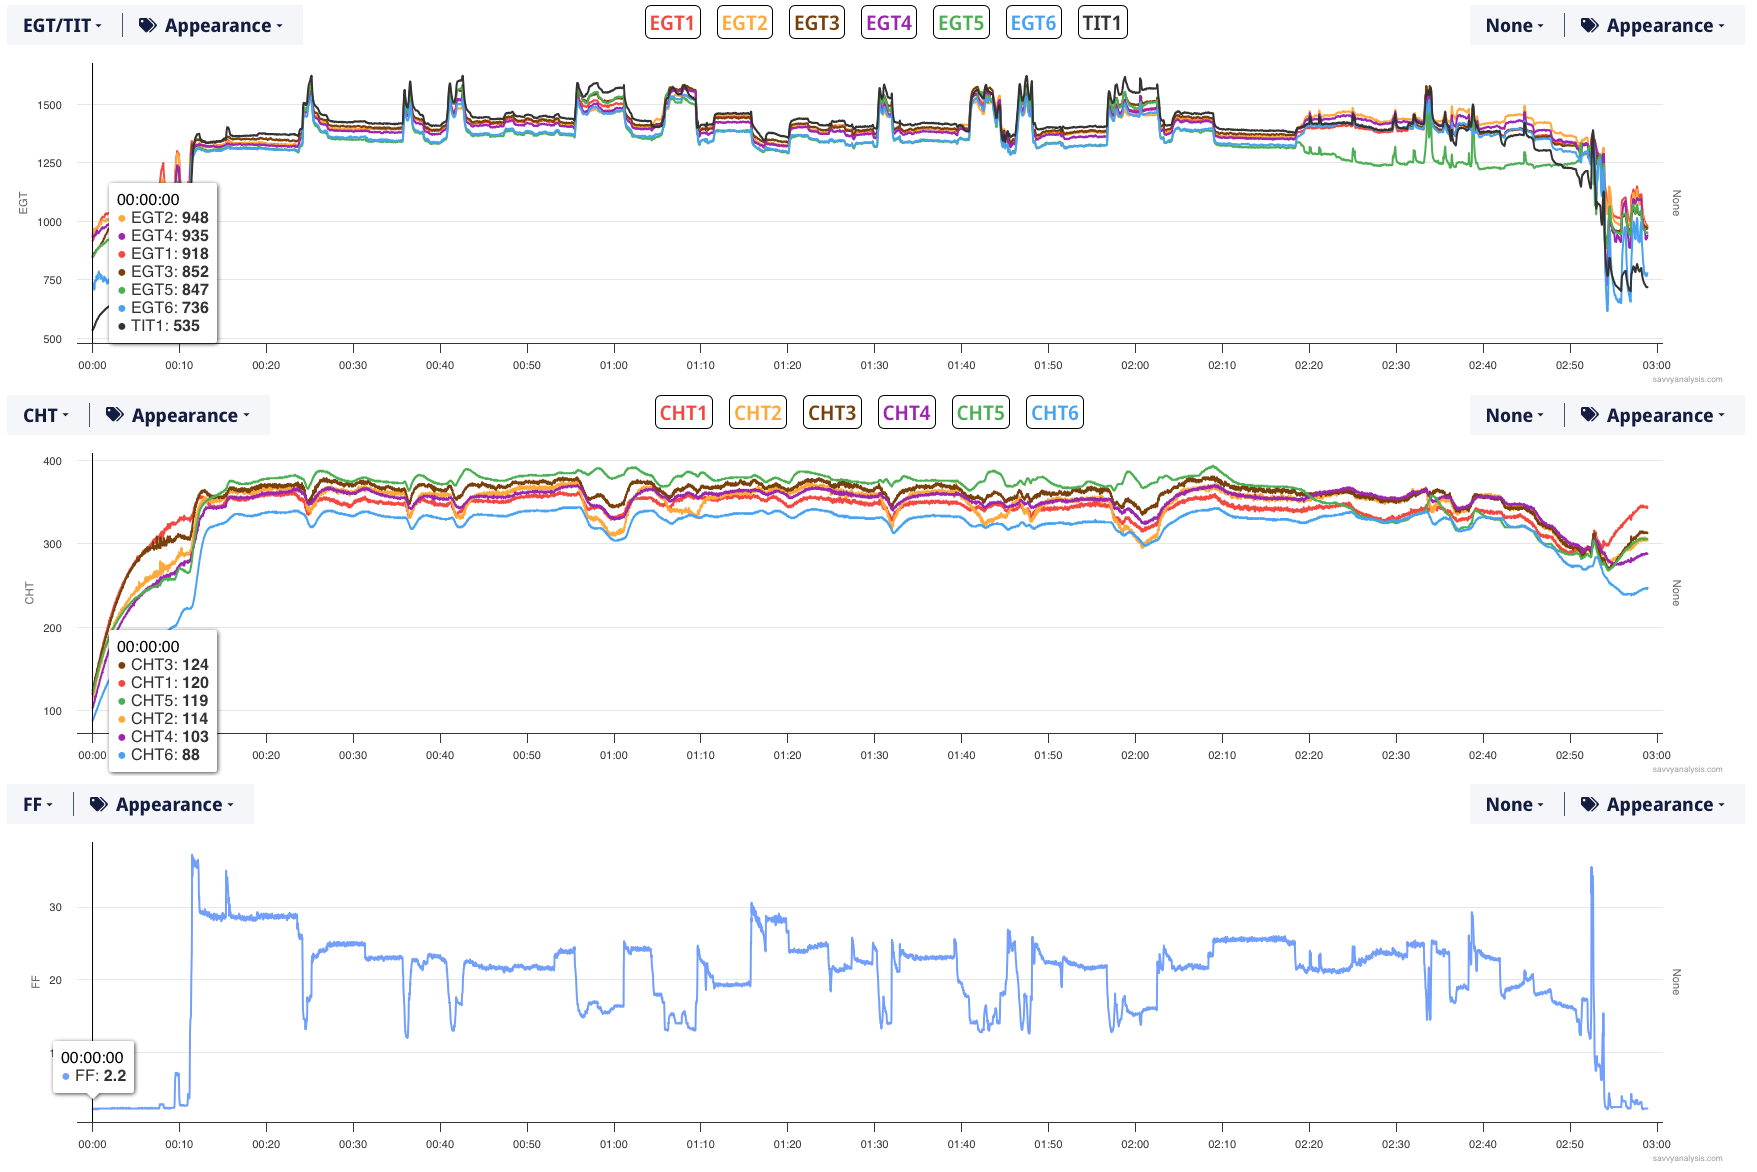
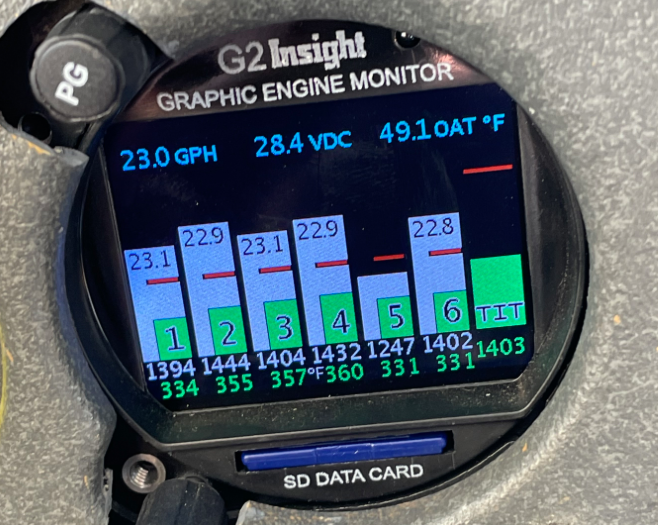 Our client reported that this was 7.5 into the break-in period for a factory rebuilt engine. CHT 5 is high throughout then at 2:20 EGT and CHT 5 both drop, with “no noticeable roughness”. But the “jack-o-lantern” pattern on the G2 caught his eye.
It seemed like a fuel issue because EGT and CHT moved together. We didn’t have a proper set of mixture sweeps, but the ∆ in FF throughout the flight showed that 5 was on the rich side.
EGT2 peaked at 16
EGT1 peaked at 15.7
EGT3 peaked at 15.3
EGT4 peaked at 15.2
EGT6 peaked at 14.9
EGT5 peaked at 14.7
GAMI spread is 1.3
Could this be a valve issue? Maybe a broken valve spring? Once the cowl came off the culprit was easy to spot.
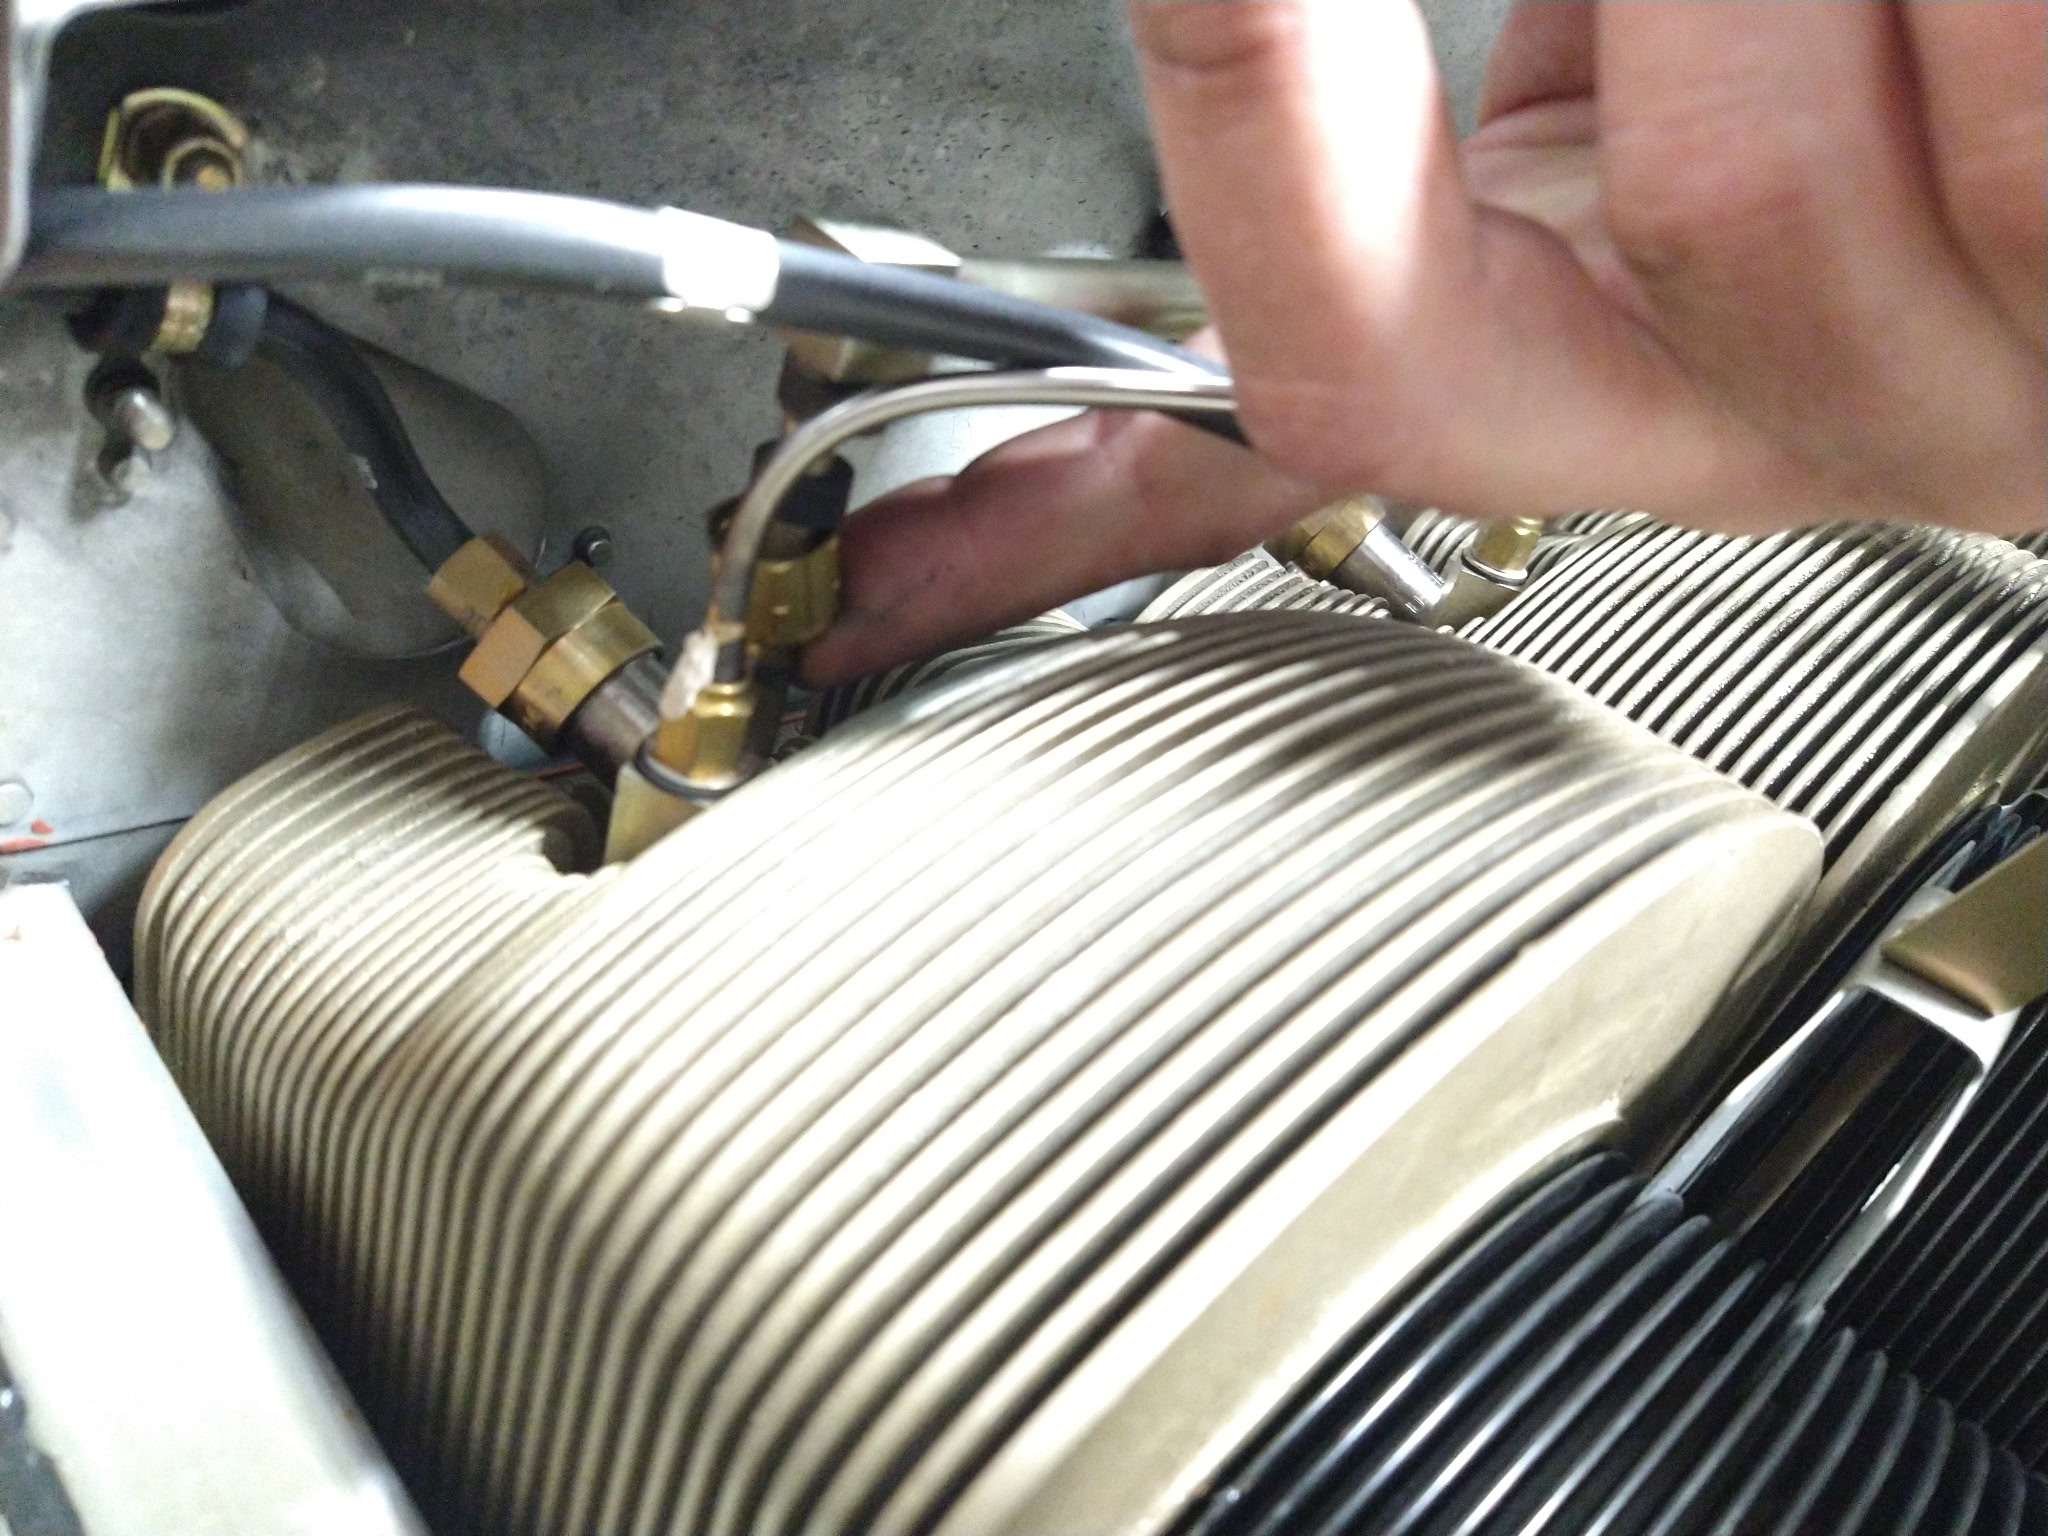
Our client reported —
What we found on CHT5 was that the upper deck air line to the #5 injector had worked its way loose so that injector was just squirting raw gas directly into the cylinder. That loose line affected all 3 cylinders on that side.
Next is an RV-10 powered by a Lycoming IO-540 with data from an Advanced Flight Systems AF-5500 with a 1 second sample rate. This is EGTs only.
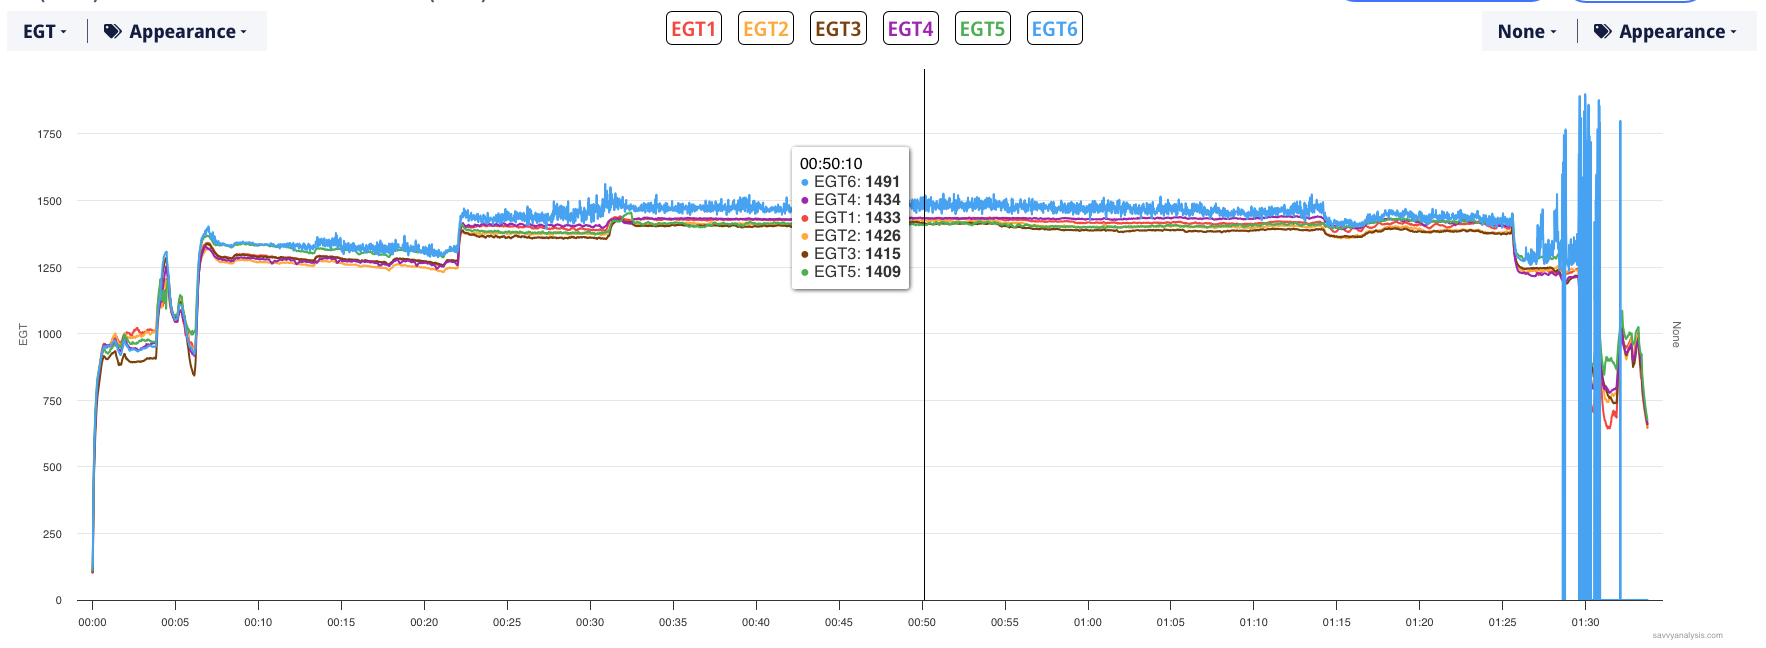
The only anomaly in this flight is EGT 6. It starts out tracking normally, starts chattering about 12 minutes in, then fails on approach. Here’s the next flight.
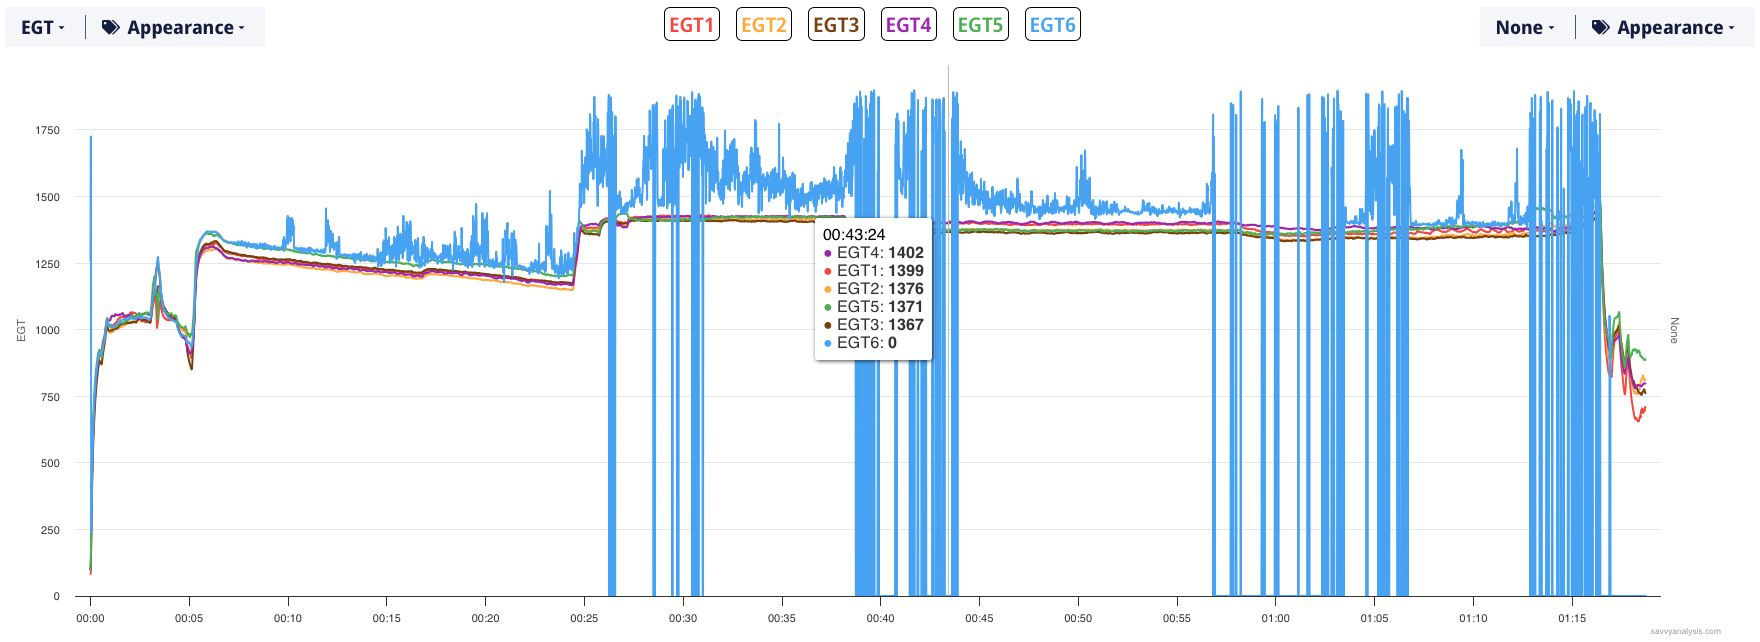
Pretty much the same pattern, except the chatter is noisier and the zero to 1800º jumps are ugly here and would have been maddeningly distracting in flight. Note to self: take a Post-it note and slice it thin so you can cover up just one EGT.