Recently I was talking with fellow pilots about flight diversions – things that pop up in flight that would cause you to change your plans and make a precautionary landing. We covered the obvious examples like fire and engine failure, then added control failure, engine roughness, and deteriorating weather, but we were kind of split on equipment failures. Some said “get on the ground and sort it out” and others said “carry on cautiously.” Not surprisingly, the carry on group has more flight time than the other group, meaning they’ve had to assess more scenarios and decide if it’s wise and safe to continue as planned, and they’ve built some confidence in their ability to do so.
Then we talked about flying IFR and how to work the engine data into your scan, and I was surprised to hear how many pilots – even those with lots of hours – don’t. We’re not here to criticize flight training, but engine data is at least as important when IMC as it is on a CAVU day.
There’s a lot of training on how to recognize instrument failures, but almost nothing on engine data monitor anomalies. So let’s devote this month’s Puzzler to interpreting unusual patterns, and someday it might make the difference between you deciding to continue on, or deciding to get on the ground pronto.
The twist this month is that we’ve had a lot of multiple sensor failures. So as you interpret the incoming data, does seeing a second parameter acting weird make it easier to dismiss the first one, or does it compound your sense of urgency?
Probe Failures or Loose Connections, or One of Each?
Let’s start with data from a Cirrus SR22 with a normally aspirated Continental IO-550-N, with data provided by an Avidyne running Release 7 using a 6 second sample rate. It’s just a nice coincidence that the patterns are appropriately creepy – with Halloween coming up.
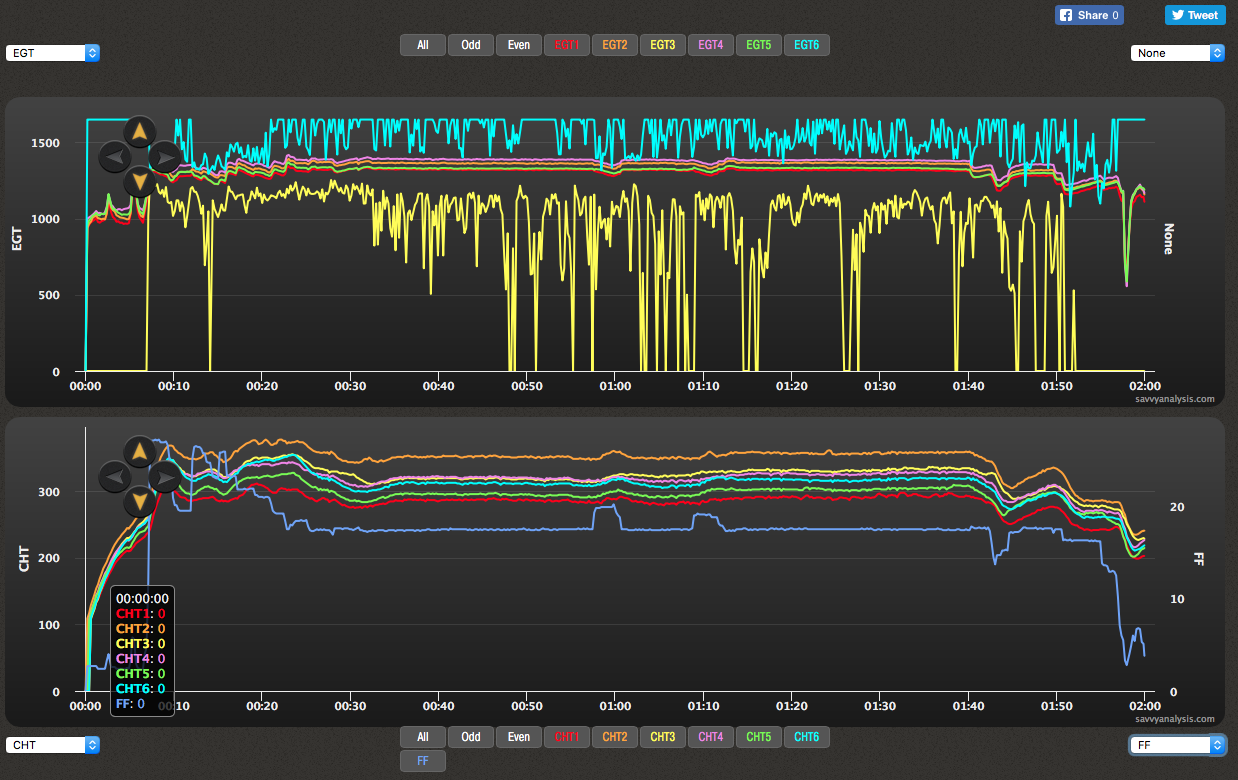
Two identical EGTs, same engine – why is one spiking to 1650º and the other is spiking to zero? We think that the probe for EGT 6 (the cyan trace) is failing, but between flatlines it jumps down and posts a reasonably normal value. Looking at CHT 6 (also cyan) there’s no corroboration of unusual combustion. While we’re there, there’s also no corroboration of unusual combustion in CHT 3 (or any other cylinder for that matter.)
EGT 3 (the yellow trace) looks like its trying to track, but it never quite gets up with the pack, and drops to zero between efforts. This looks more like a loose connection or maybe a bad cable. Too bad they’re on opposite sides of the engine because swapping these two EGT probes and seeing if you got the same pattern with a different color would be a good test. It’s always smart to check the connections before jumping right to probe replacement, but in this case it looks like we have a probe failure and a loose connection.
Phony, Real or One of Each?
Next up is data from an RV-7 with a Lycoming IO-360 and data from a Dynon Skyview with a 1 sec sample rate.
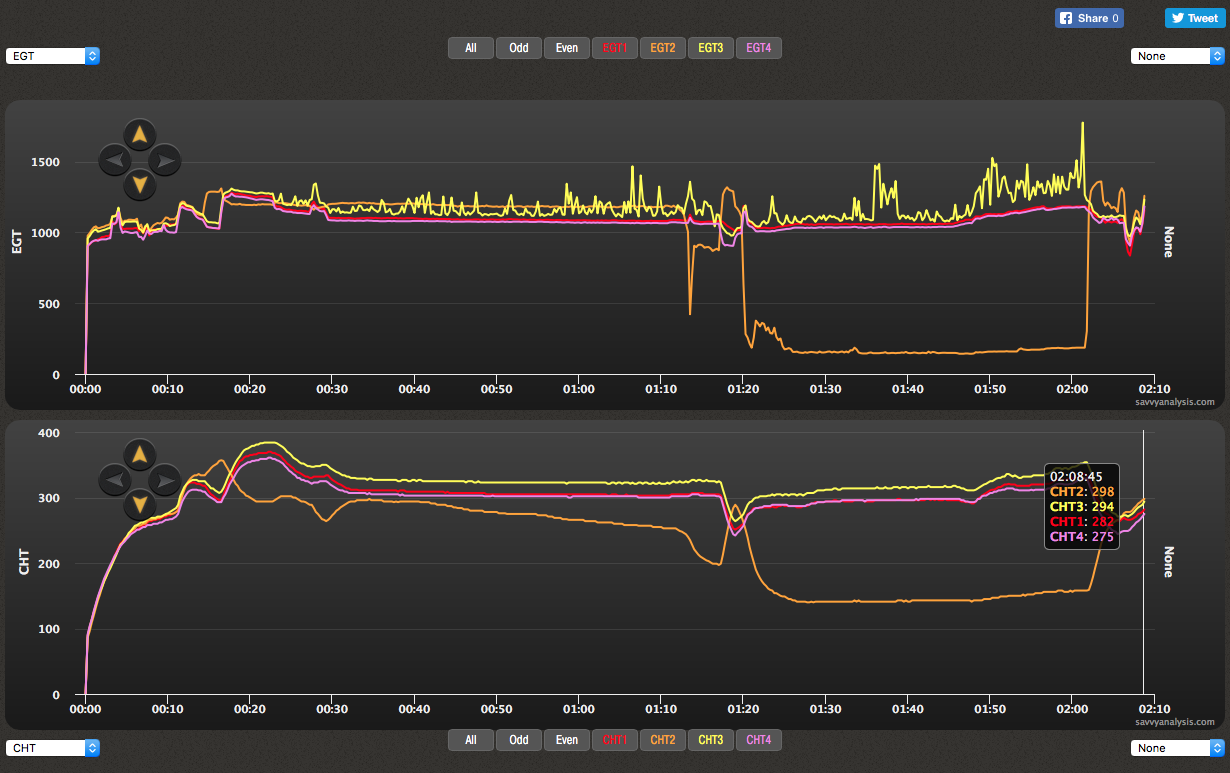
Let’s start on the left. Everybody’s normal after engine start. Takeoff is about the 12 min mark, and EGT and CHT 2 (the orange traces) both rise there. Then EGT 2 settles down, but CHT 2 drops, recovers, then drops again. The client who submitted this reported manageable roughness (and it helps us to know if roughness corroborates the data), which seemed to rule out catastrophic mechanical failure like a rod through the case. It looks like cyl 2 is not making good power, and because EGT 2 is a little high, maybe that’s because of weak spark. A little after 01:10, EGT 2 flames out, recovers, then gives up making power.
It’s tempting to dismiss the jumpiness of EGT 3 (the yellow trace) as bad data, except there are little waves in the CHT pattern that suggest something’s going on. It’s common for EGTs – measuring the temperature of air – to have dramatic jumps while the CHT for the same cylinder – responding to the thermal mass of metal – moves fractionally.
After this event, our client determined that the spark plug caps for 2 and 3 had worked their way loose, and once that was fixed, subseqent flights were normal.
Negative Oil Pressure? Are You Positive?
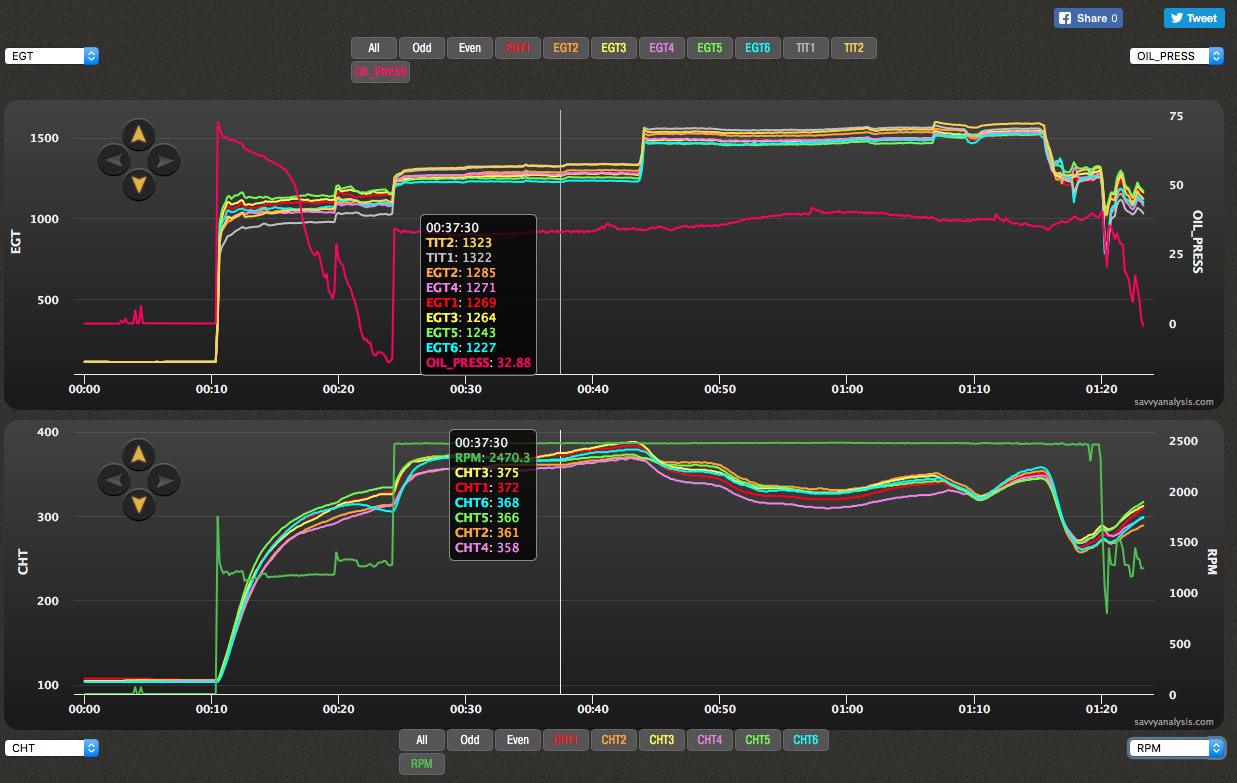
Here’s data from a Cirrus SR22T with a Continental TSIO-550-K with data from a Garmin Perspective using a 1 sec sample rate. EGTs and CHTs look good, and oil temp (not shown) looks good. Of all the data we have to process in flight, I don’t think there’s anything more alarming than a quickly rising CHT or quickly dropping oil pressure.
Let’s start on the left. The first 10 minutes of data is before engine start. Oil pressure there is negative 0.14, which, had it been noticed, would have been a clue for later interpretation. At engine start it peaks at 73, then drops to about 9, up to 23 then back to negative 14. RPMs are in green on the bottom to make it easier to spot takeoff. At takeoff pressure jumps to about 33 – still much lower than the 50 or so we expect from this Continental engine. Oil temp and pressure sensors have the distinct disadvantage of working near lots of – you guessed it – oil. So they’re particularly prone to connection problems.
Extra credit if you noticed the drop in CHT 6 (the cyan trace) when oil pressure reaches rock bottom. We don’t know for sure, but we’ll float the theory that since it’s right before takeoff, that’s when the nose got pointed into the wind and 6 – being in front – got the biggest benefit of that.
I’M SHOUTING SO IT WILL BE EASIER TO IGNORE ME
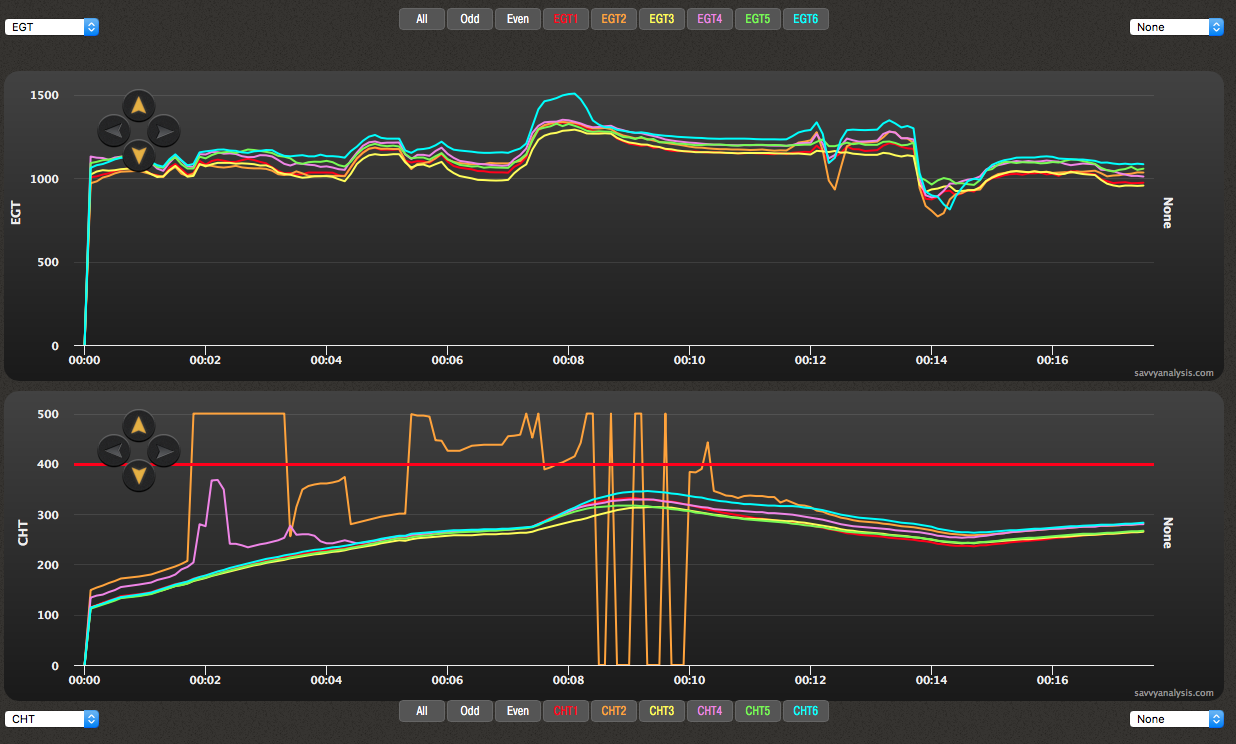
Here’s data from another Cirrus SR22 with a normally aspirated Continental IO-550-N, and data provided by an Avidyne running Release 7 using a 6 second sample rate. Say what you will about the CHT 2 probe, it knows how to get your attention. It’s literally jumping up and down to tell you that it’s ok to ignore its specious data. Of course, it’s smart to look at EGT 2 to see if there’s any hint of trouble – and there isn’t. And just when you’ve learned to ignore CHT 2’s antics, it calms down and behaves for the rest of the flight.
CHT 4 (the purple trace) starts high along with 2, then has a little episode, then it looks ok – corroborated by EGT 4.
A Three-fer
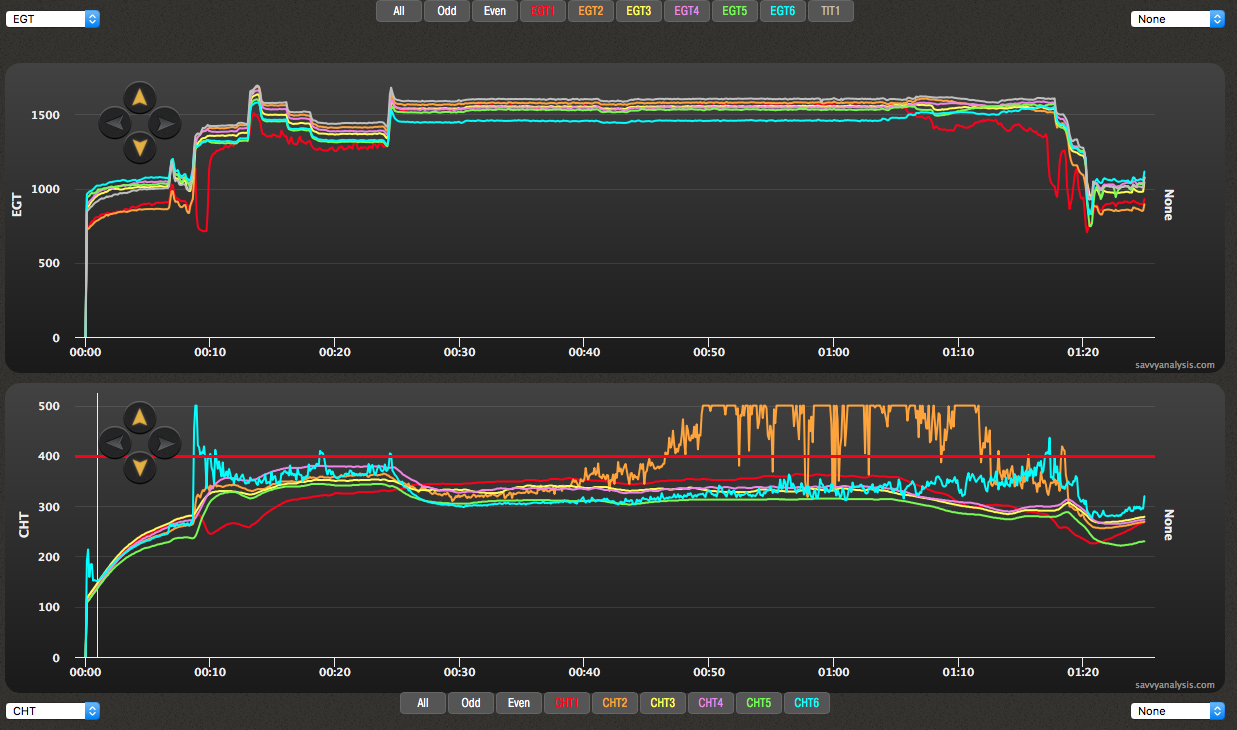
Here’s data from a Cessna 400 Corvalis with a Continental TSIO-550-C and data from an Avidyne running Release 8. CHT 2 (the orange trace) shows the hug-the-rafters pattern that we saw earlier, and CHT 6 (the cyan trace) looks more like a loose connection. Notice it’s flatter during ground ops at both ends, a little jumpy in cruise, and jumpiest during climb and descent. Those both look like data issues.
EGT and CHT 1, on the other hand, corroborate one another and suggest poor power in climb and descent, but ok in cruise. They’re both low together, which is a characteristic of an injector clog, but a clog should cause lean running at high fuel flow – no evidence of that – and even leaner running in LOP cruise – no evidence of that, either. Weak spark usually causes less efficient combustion and higher EGTs – not lower.
The lower EGT at takeoff, along with the erratic EGT in climb, point towards ignition vs fuel. But this is a case where we’d like to see the Savvy Test Profile before drawing conclusions.
Get on the Ground, or Carry on?
Like our navigational instruments, most of the time our engine data monitors and sensors give us useful and reliable information. And, like those instruments, when the data is not showing what we expect to see, your ability to distinguish bogus data from real warnings can make your flying safer and more enjoyable.
