For this Halloween Puzzler I chose three charts. The first was trick-y, and finding the source of the problem was a treat. The next one is a little scary, and the last one is downright spooky. Let’s get started.
First up is the Right engine of a Baron 55, a Continental IO-550-E. Here’s the whole 40 minute flight, with FF displayed on top with EGTs.
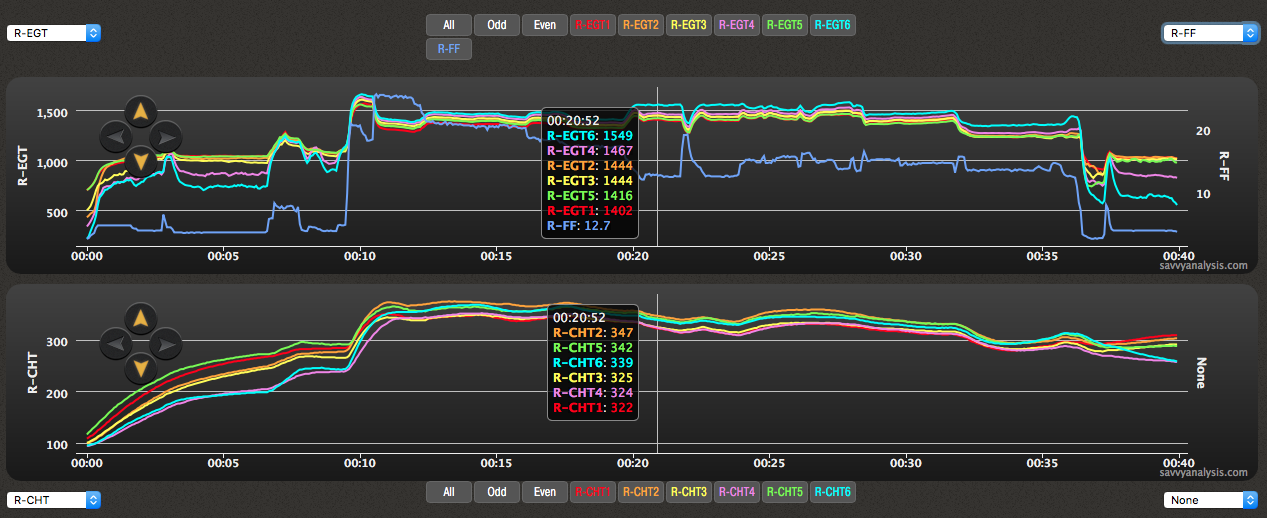
Things look pretty normal except EGTs and CHTs for cyls 4 and 6 show a problem during ground ops – before and after flight – and EGT 6 is an outlier once FF is reduced. Let’s table cyl 4 for the moment and concentrate on what’s causing cyl 6 to run hot. The usual suspects are a clogged injector or a bad spark plug. With an injector clog, we expect to see hotter EGT when ROP and cooler EGT when LOP – that didn’t happen. There’s no rank change in EGT or CHT. So the data is pointing away from fuel and toward spark.
When EGT 6 goes high, it hovers about 70 degrees above the others. There’s a clue, becasue that’s in the range we see when one plug stops firing – as in a mag check. We don’t have a mag check to refer to, which gives me a chance to suggest that whenever ignition is suspicious, a LOP mag check is a valuable way to isolate mags and plugs and diagnose the problem. We did have GAMI sweeps to refer to, which showed cyl 6 as last to peak, or richest. So this didn’t look like a fuel issue and our recommendation was to check the plugs for cyl 6.
Complicating the issue was that the owner was working with GAMI on perfecting the spread, including a new injector for 6. The new injector made 6 a little leaner and improved the spread to 0.2 GPH, but EGT was still about 80 degrees high, and the owner reported roughness when LOP. Factoring all that in, the data still suggested ignition vs fuel. We recommended testing the plugs with an ohmmeter.
Plugs for cyl 6 — which were new Tempest massives — were tested and came back 1850 and 1630 ohms, We like to see 800-1200 ohms, and anything over 5000 should be replaced, but 1600-1800 and clean (no evidence of fouling) should have been ok. When the data points to a perpetrator, and the perp comes back clean, you wonder “what am I missing”? And just about that time, the owner sent this picture.
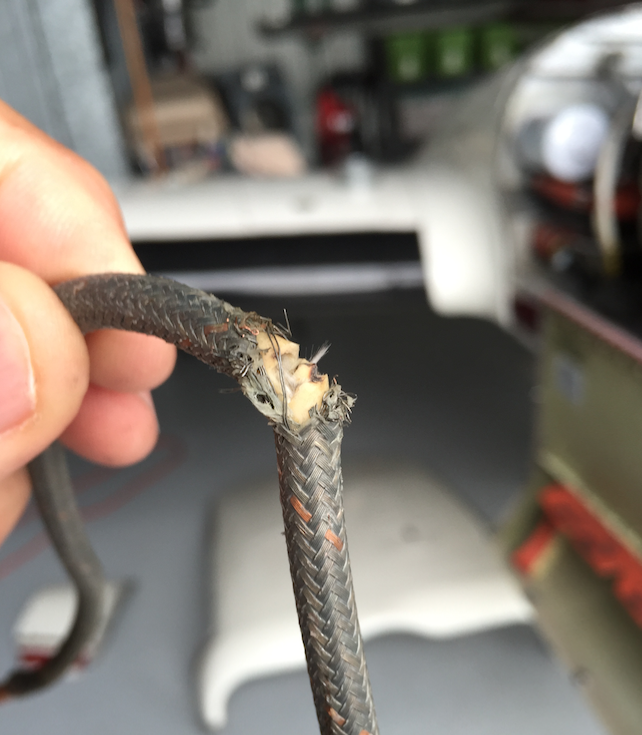
Like a 3rd grader hiding behind a Darth Vader mask, this wounded ignition harness was hiding inside an Adel clamp. Thanks a lot, Adel clamp. You had ONE JOB….
Next up is data that we’re happy to be able to show, because it could have ended quite differently. Did you ever wonder what engine data would look like if the engine quit? This is from an RV-9 with a Lycoming IO-233 that suffered catastrophic failure of the cyl 3 connecting rod.
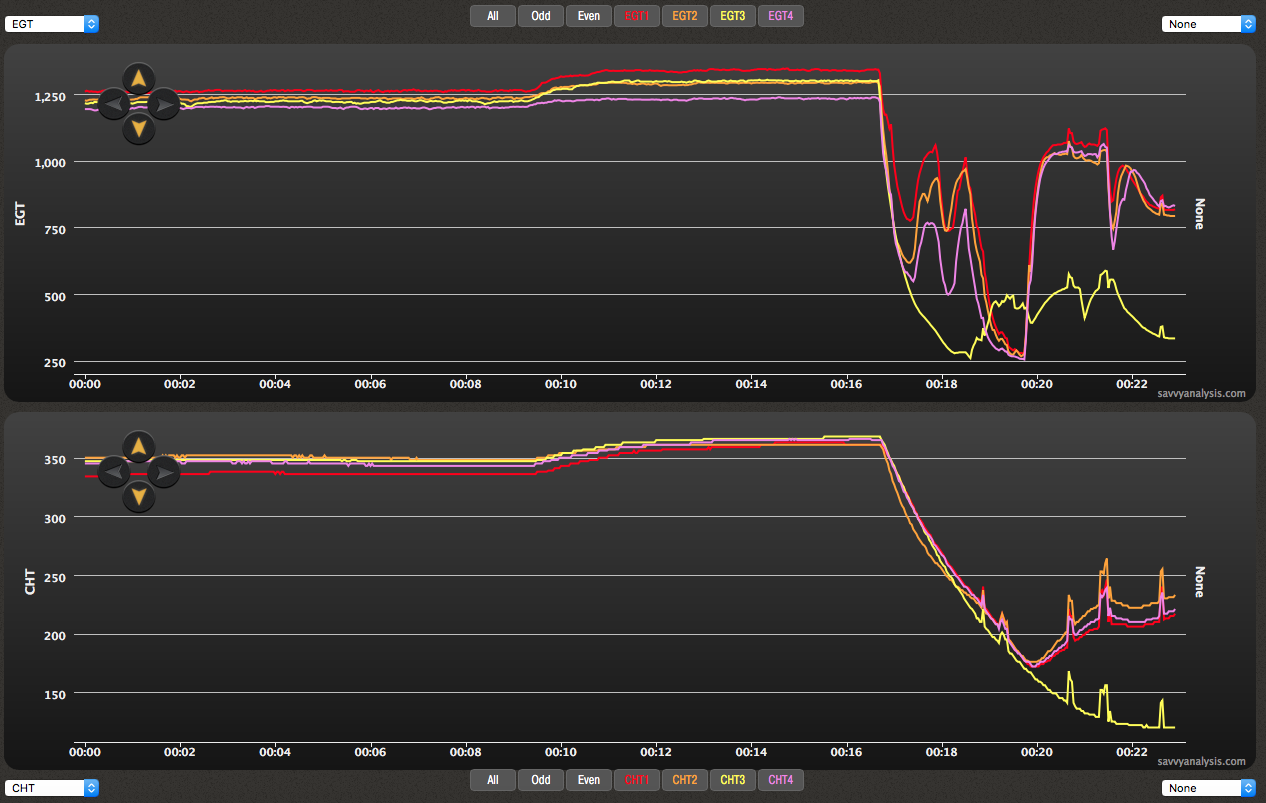
The owner was testing the autopilot, flying ovals at 5,000 ft about 5 miles from his home field, which has an elevation of about 150 ft. He was beginning the final set of laps when the con rod failed. Fortunately, good training kicked in, he pointed the nose toward the field and set up best glide. Oil pressure dropped to zero after about 30 secs, and the prop windmilled at about 2000 RPMs. The engine was still making power, so he decided to use what he had and hope the engine didn’t sieze. It didn’t – he was able to get the airplane onto the runway and now has a great story to tell, and engine data to share.
CHT 3 is hottest before the event, but just barely. There’s certainly no big flashing neon light in the data suggesting what’s about to happen. Not surprising is the rapid EGT falloff, as the pipes stop filling with exhaust. But we were a little surprised at the rapid CHT falloff, and attibute it to the metal cooling quickly when it didn’t have the heat sink of warm oil circulating around it, plus the case now had an air vent filling the space with a blast of ambient air.
We can report that the RV-9 has a new engine and is back in the air.
And now for something completely spooky. This data is from a Cessna Turbo 206 with a Lycoming TIO-540 – about 2 and a half hours worth. Often when we get an analysis request, we look at the flight requested, but also at other flights before and after, to see if the anomaly persists or went away. That’s the case with our next chart. This isn’t the “issue” flight, which started about 1500Z and lasted just over 5 hours. This data started about a half hour after that flight ended. That’s your first clue.
I’ll admit that when I first looked at this my brain went straight to suspecting a malfunction of the EI CGR-30P.
Gee, it didn’t capture startup, or shutdown, and the malfunction kept getting worse as the flight went on…
This must be electrical, otherwise he would have landed by now…
Man, this is a real case of get-home itis. But wait – he just flew a 5 hour flight TO his home field…
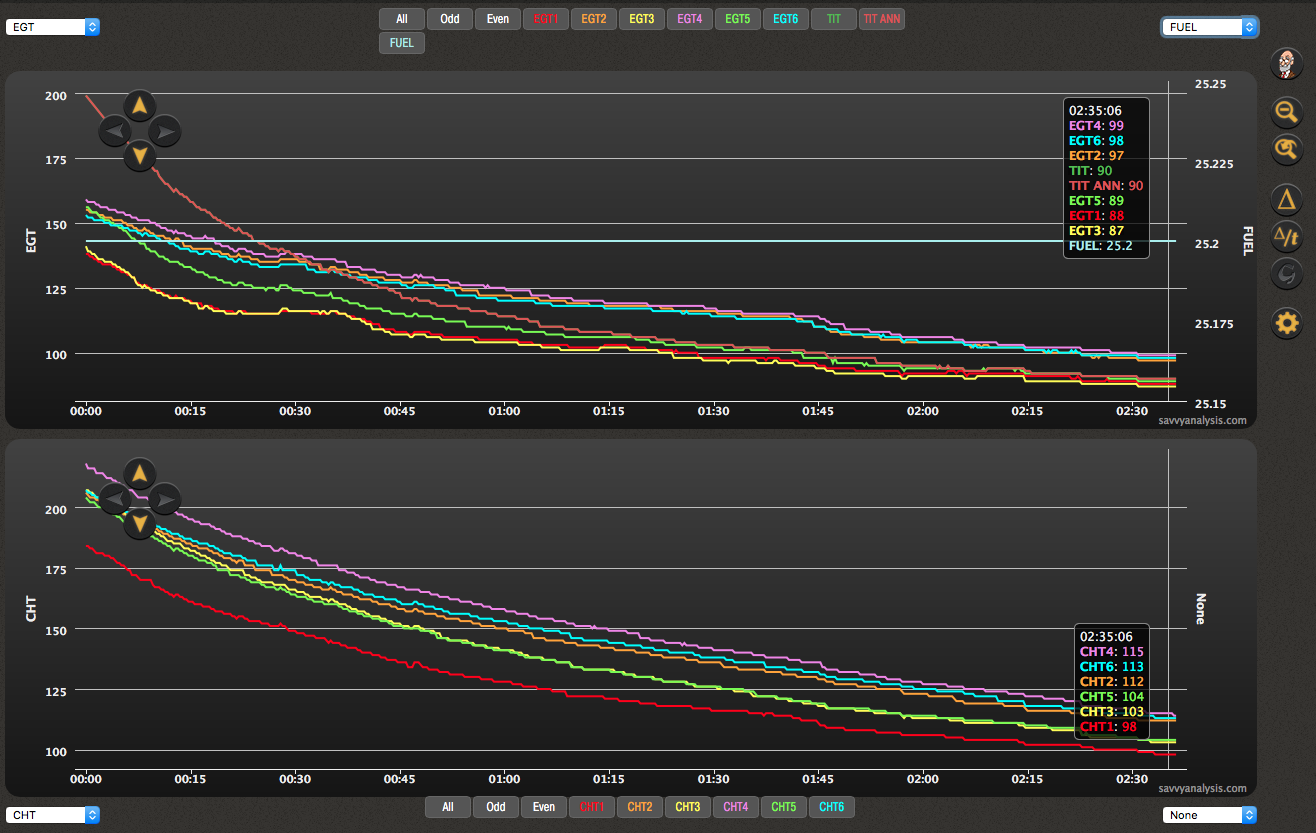
And that’s about when my lights went on. I noticed that the GAMI button was greyed out – as it is when FF isn’t available.
Since the “issue” that triggered the analysis request was fuel flow, I activated fuel flow in this chart to see if the condition persisted. At least I thought I activated fuel flow. What’s displaying here is Fuel – not Fuel flow – but Fuel in the tanks. And Fuel stays at 25.2 and never changes because the airplane isn’t flying. Enough clues?
Here’s what happened. The pilot landed at the home field with 25.2 gallons in the tanks. He asked the FBO to top the tanks and put in in the hangar – then he went home. The saying goes “There are those who have and those who will” — except in this case it’s not “forget to put the gear down”, it’s “leave the Master Switch on”. It must have gone off after the 5 hour flight, because that data is intact, then gone back on again – maybe to check fuel remaining? In any case, what we’re seeing is a perfectly functioning CGR-30P with a 1 sec sample rate dutifully logging the engine temps as it cools down after a 5 hour flight, until the fuel-person turns it off about 3 hours after that landing.
I thought it was a rare chance to see something we ordinarily wouldn’t see, and just spooky enough to include in the Halloween Puzzler.
