When I taught in the classroom one of my favorite scenarios was teaching software. Typically I would introduce a concept, give examples of its application in the real world, and then show the students how to do it in the software. Inevitably, in a group of 25 students, there would be one or two who missed an important setting or step, and they were stuck. Sometimes the hand would go up right away. Sometimes you would see them look at the screen of the student next to them and try and figure out why that one was working but they were stuck. And then the hand went up.
So the fun part as an instructor was the walk up. After a couple of years of teaching, I had seen all the rookie mistakes, and often I could spot the incorrect setting or the missing step before I even got to the student’s workstation. Of course, the real satisfaction in teaching came from the students who breezed through the exercise, and left the classroom knowing more than they did when they arrived. But there was something fun about quickly looking at the display of a stuck student and seeing the clue that would fix it. Also fun to have the answer ready before they even asked the question. And rewarding to have a teaching moment.
Sometimes I get that little tingle with engine data analysis. Weak spark, clogged injector – whatever it is. This month’s first example is data from a Piper Archer powered by a Lycoming O-360 and data from a Garmin 275 with a 1 sec sample rate. EGTs on top, then CHTs and FF. Nothing special about cursor placement – just getting it out of the way.
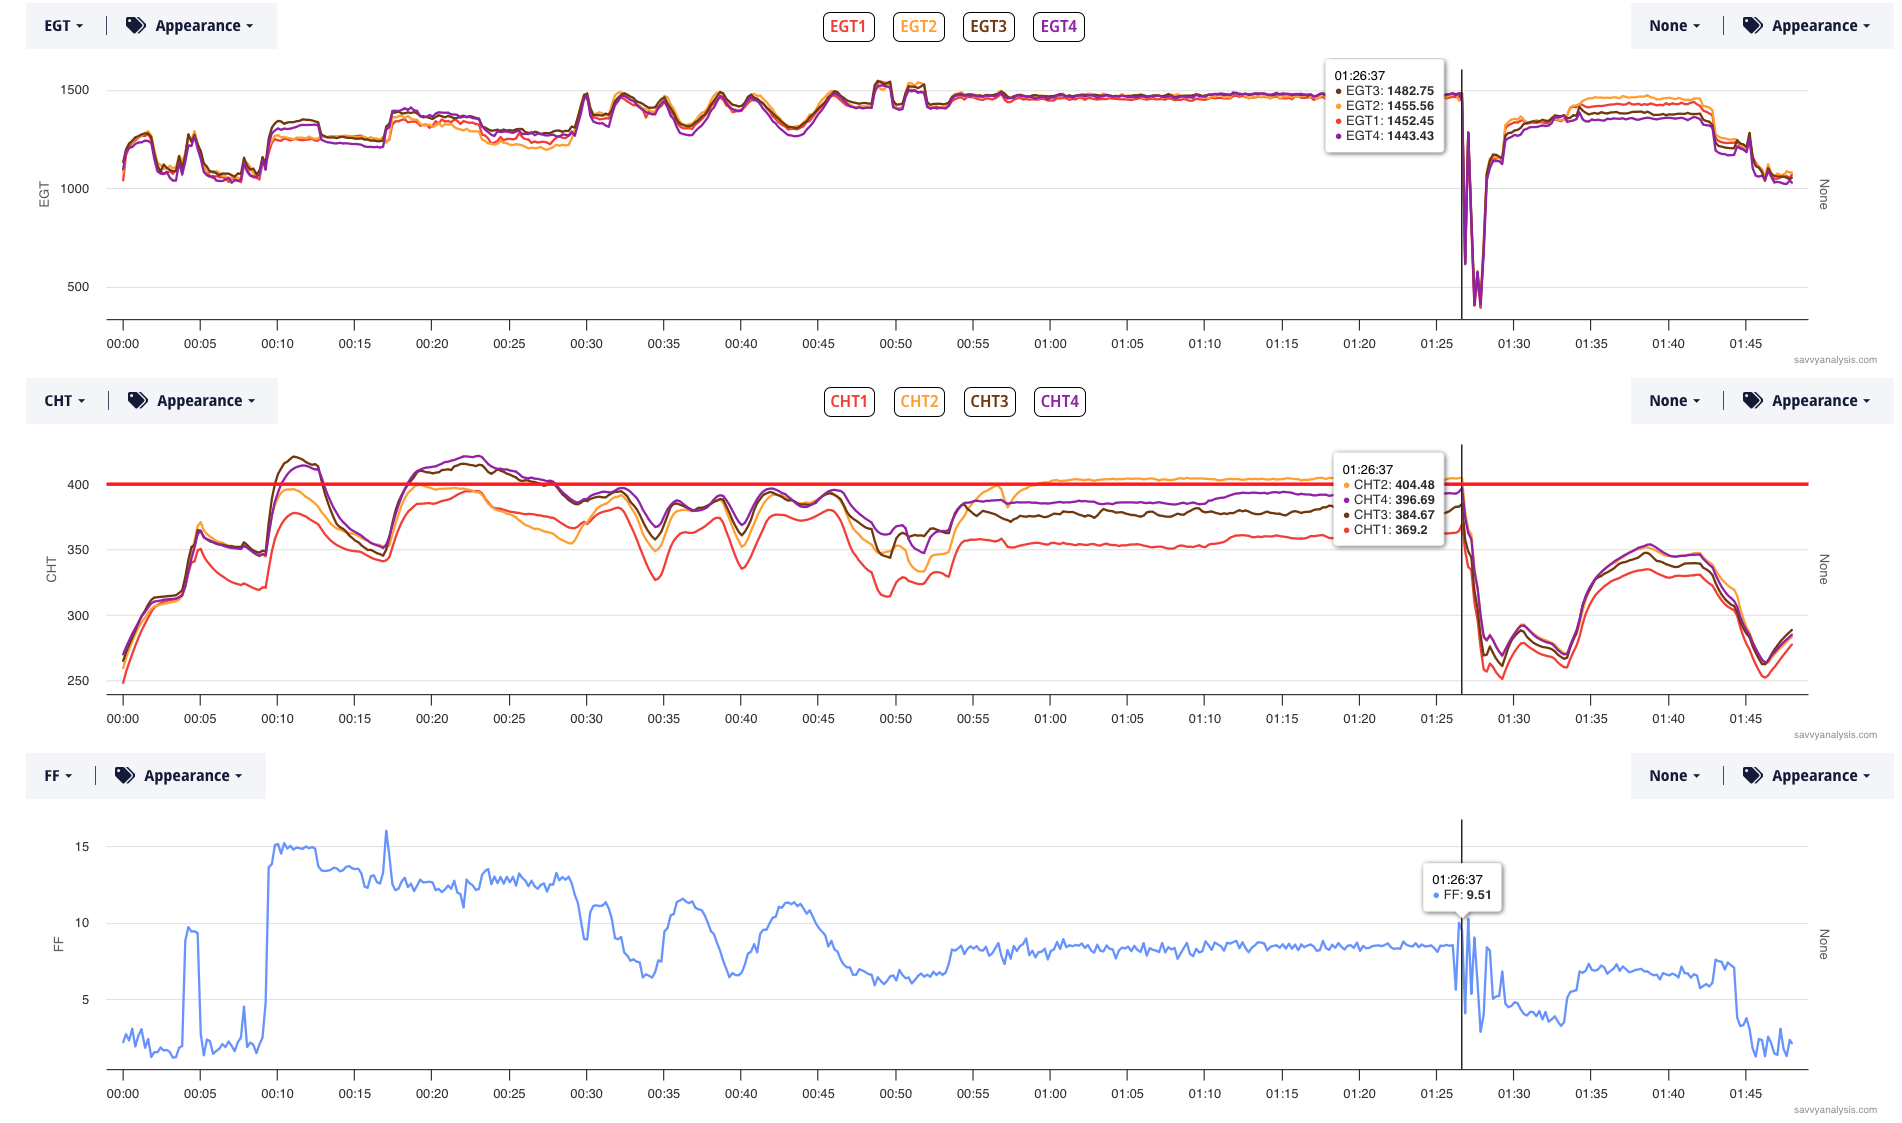
EGTs in cruise are remarkably uniform – starting at about the 55 min mark until the cursor. Even as the FF trace jumps around a bit, EGTs are stable. In climb – from about 15 to 28 mins – they’re not as uniform but still not bad for a carbureted engine. In the takeoff roll and initial climb – 10 to 15 mins – the gap is highest. There’s another spot at the one hour 35 minute mark where FF is about half of what it was in the takeoff roll and this time the gap has EGTs 1 and 2 higher than 3 and 4, which is the opposite of the rank at max FF.
Before we leave EGTs, notice the mixture sweeps from 30 to 45 mins. I won’t zoom in but here are the numbers for the spread —
00:44:53-00:46:41
EGT2 peaked at 8.58
EGT1 peaked at 8.26
EGT3 peaked at 8.26
EGT4 peaked at 8.18
GAMI spread is 0.4
That’s about as good as you’ll ever see for a carbureted engine. All of that is a long way of saying EGTs indicate uniform combustion, at least in the FF range where the airplane spends most of its time. Which is in sharp contrast to CHTs.
It’s not quite as simple as cooling is OK for 1 and 2 and crummy for 3 and 4. That’s true in climb, but at the 55 minute mark CHT 2 jumps up and becomes hottest. It seems safe to say that the focus of maintenance ought be directed towards baffles and cooling – versus spark and fuel. This one gave me that little tingle at first glance – my initial observation held up pretty well under stricter scrutiny.
Next up is data from a Cessna Turbo 206 powered by a Lycoming TIO-540 and data from a Garmin G1000 with a 1 sec sample rate. EGTs on top, with CHTs and FF below.
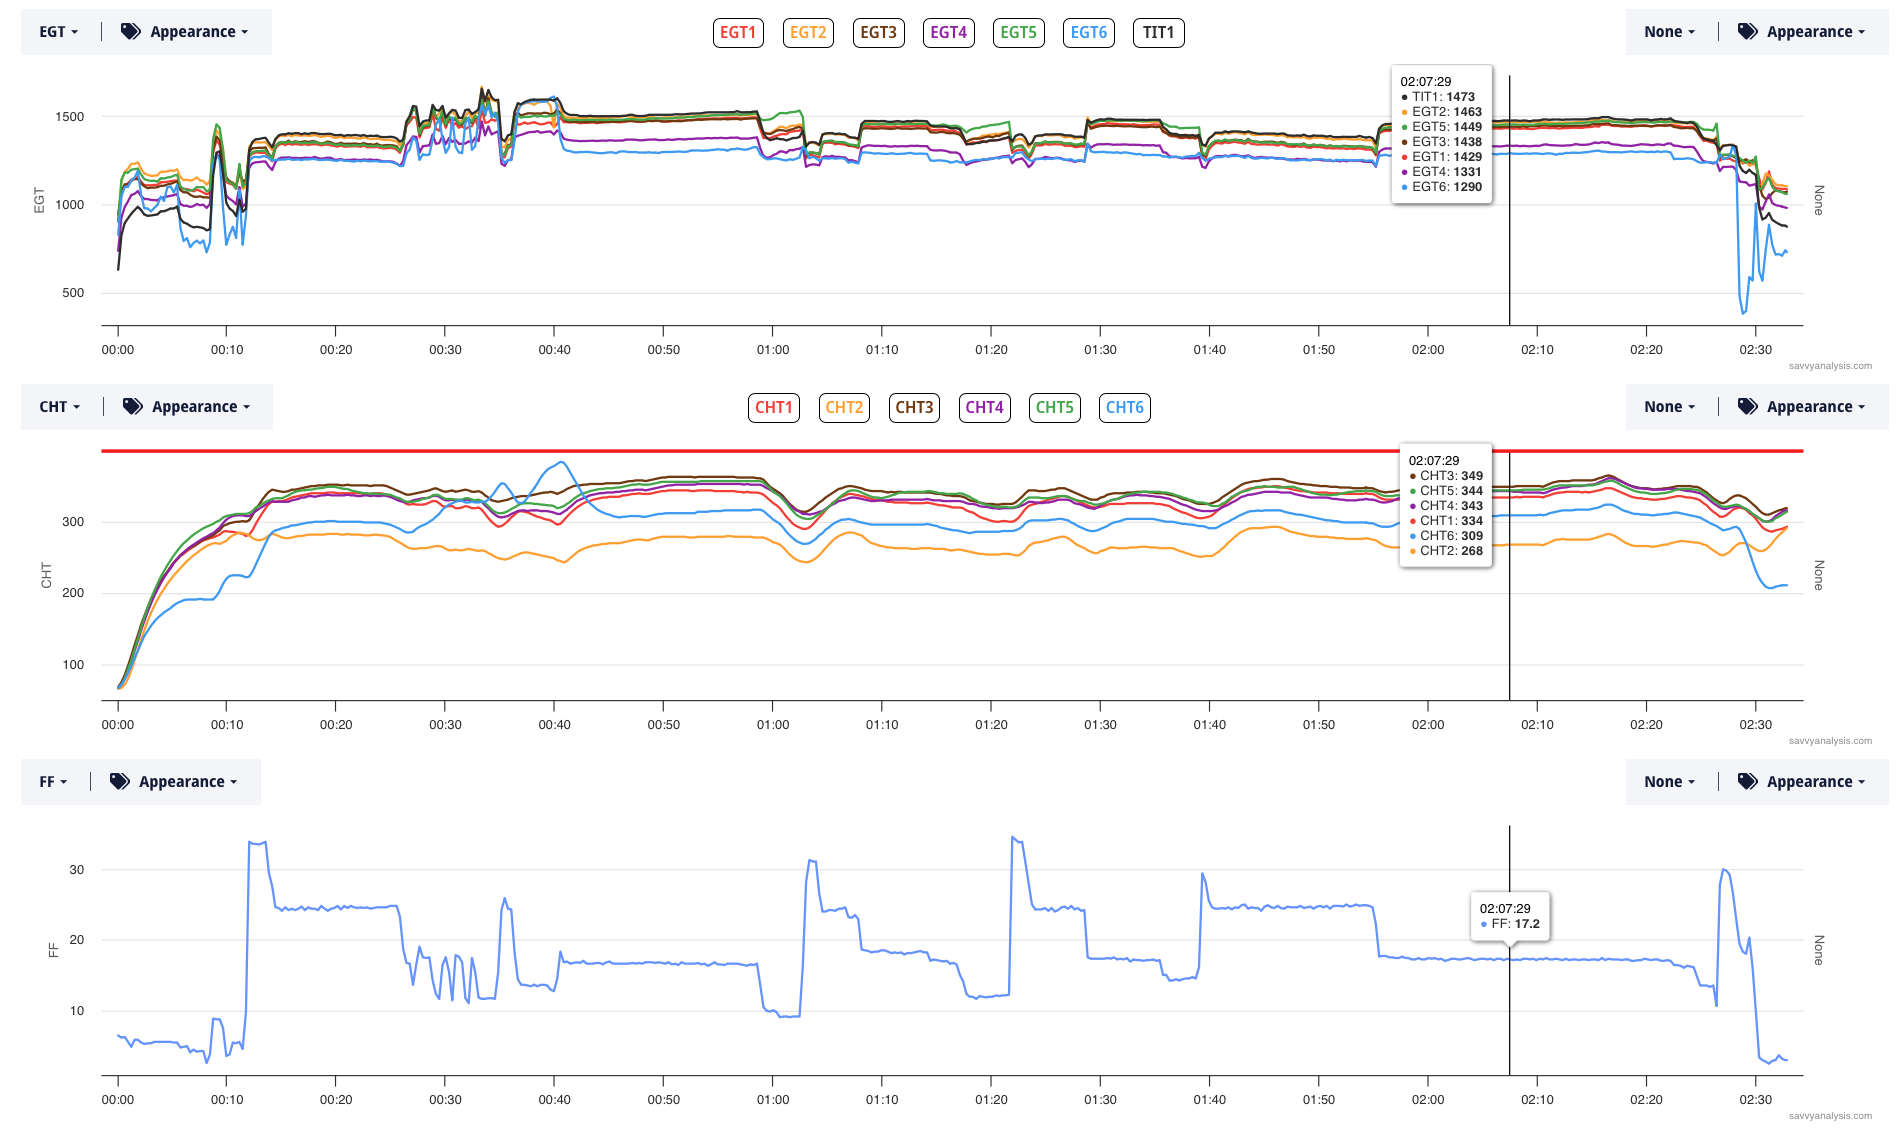
This is not one where a quick glance tells the story. A quick glance tells you that EGTs 4 and 6 are low throughout, and CHT 6 is low except when it’s higher than all the others, and CHT 2 is low in flight but closer to the others during ground ops. Those are tough dots to connect. Fortunately, the pilot gave us mixture sweeps and a LOP mag check around a 25 minute mark so let’s zoom in to that. The bold blue trace is FF.
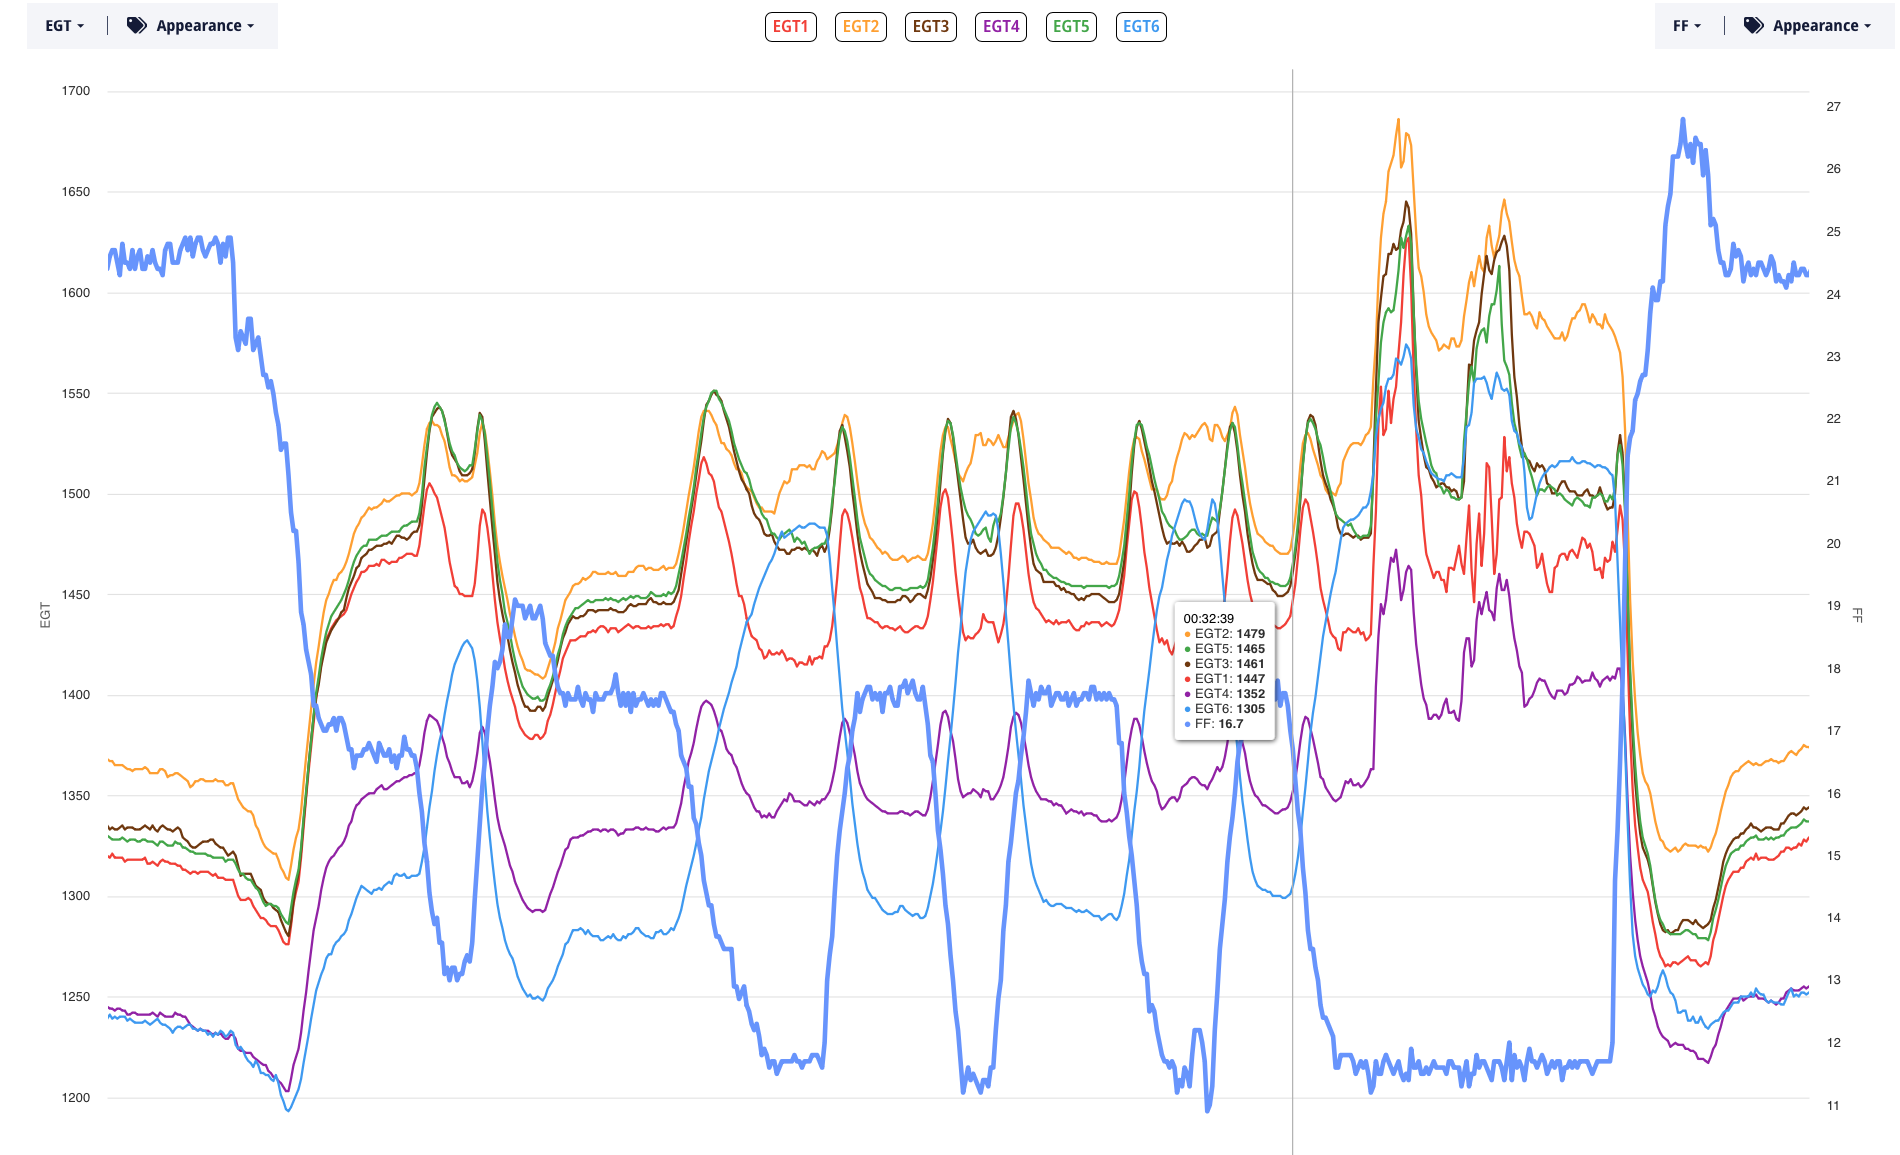
Earlier we saw a carbureted engine with the best case scenario for mixture distribution. Here we see an injected engine with just about the worst case scenario for mixture distribution. Here’s a clue – this engine is equipped with GAMIjectors and its baseline shows a spread under 1.0 GPH with no outliers. In this case, if we saw the mirror-image of 6 – an injector peaking well ahead of the others, it might suggest that those two had been swapped during maintenance. Since we don’t see that, trying a new injector to make 6 run leaner seemed like the best next step.
We’ll finish this month with data from a Glastar powered by a Lycoming TIO-540 and data from a Garmin G3X with a 1 sec sample rate. EGTs, CHTs and FF.
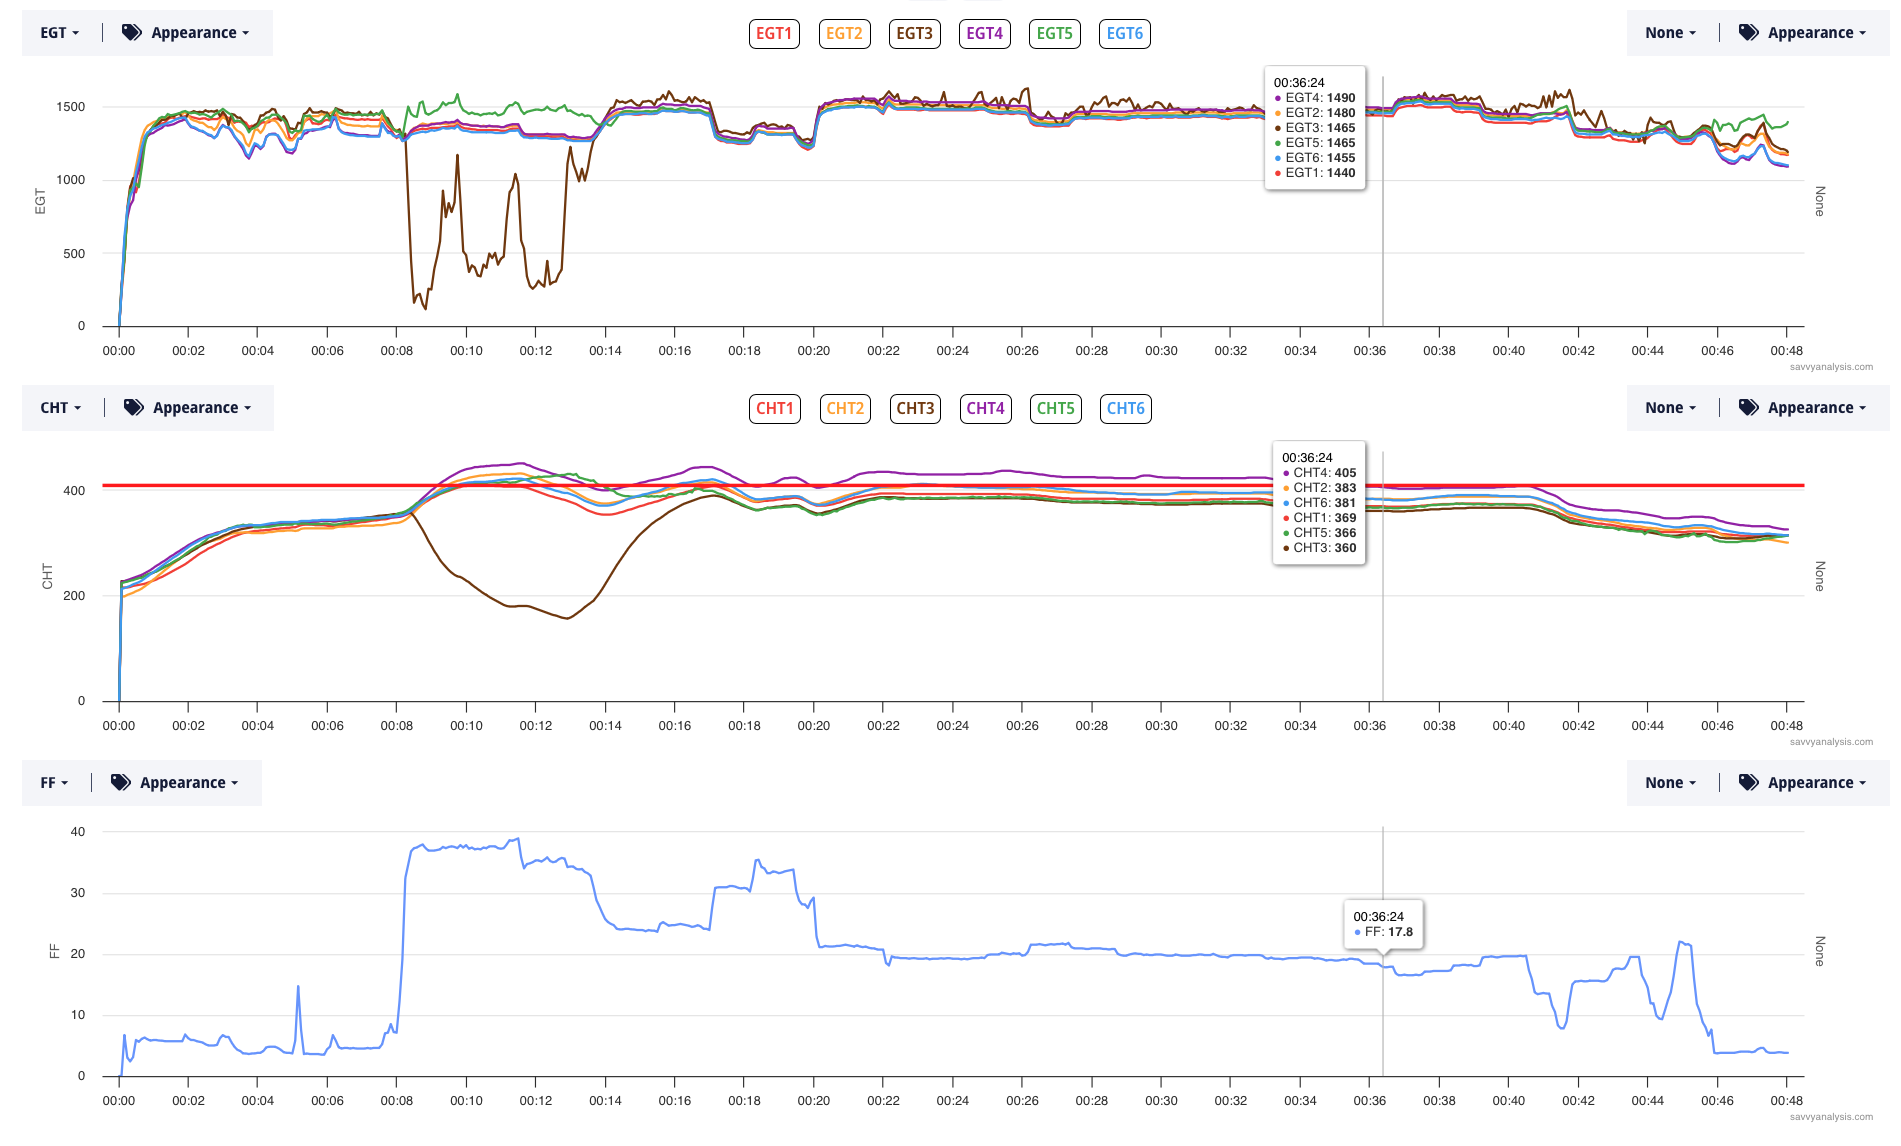
The elephant in this room is the giant drop in EGT and CHT 3 at the 8 min mark – right in the takeoff roll. Then in cruise starting at the 40 minute mark there are erratic jumps in the EGT 3 trace, and no downspikes that are visible at this zoom level. A weak plug will often send EGT higher by about this amount, but that big drop from 8 to 14 mins doesn’t look a like weak spark. It looks more like a stuck valve.
There’s a first time for everything. As an analyst, there’s a first time that you see a clogged injector, or a mistimed mag, or a cooling issue like the Archer. I remember the first time I saw a big drop like this at max power, followed by an erratic trace at lower power. I stared at it for a while before wondering what a broken valve spring would look like. We really don’t like to recommend unnecessary maintenance, but checking a valve spring is not very invasive and not very time consuming compared to other powerplant maintenance. When the client checked, they found an exhaust valve spring broken in a few places.
