I’ll be honest. Writing this month’s column about engine data as thousands continue to die from the virus seemed – trivial. Then two things came to mind. First, you’re probably reading this to get a short break from the news. Second, so much of the story – the hockey-stick spike in unemployment, the colored maps, the flattening of the curve – relies on infographics. And SavvyAnalysis is all about interpreting the graphic depiction of data. So with sincere thanks to the caregivers and all those keeping us healthy and safe, and a tip of the hat to the infographic creators helping us process this pandemic, let’s see what’s in this month’s collection of data.
First up is data from a Cessna 400 with a Continental TSIO-550 and data from a Garmin G1000 with a 1 sec sample rate. The image is EGT only because everything else looked normal.
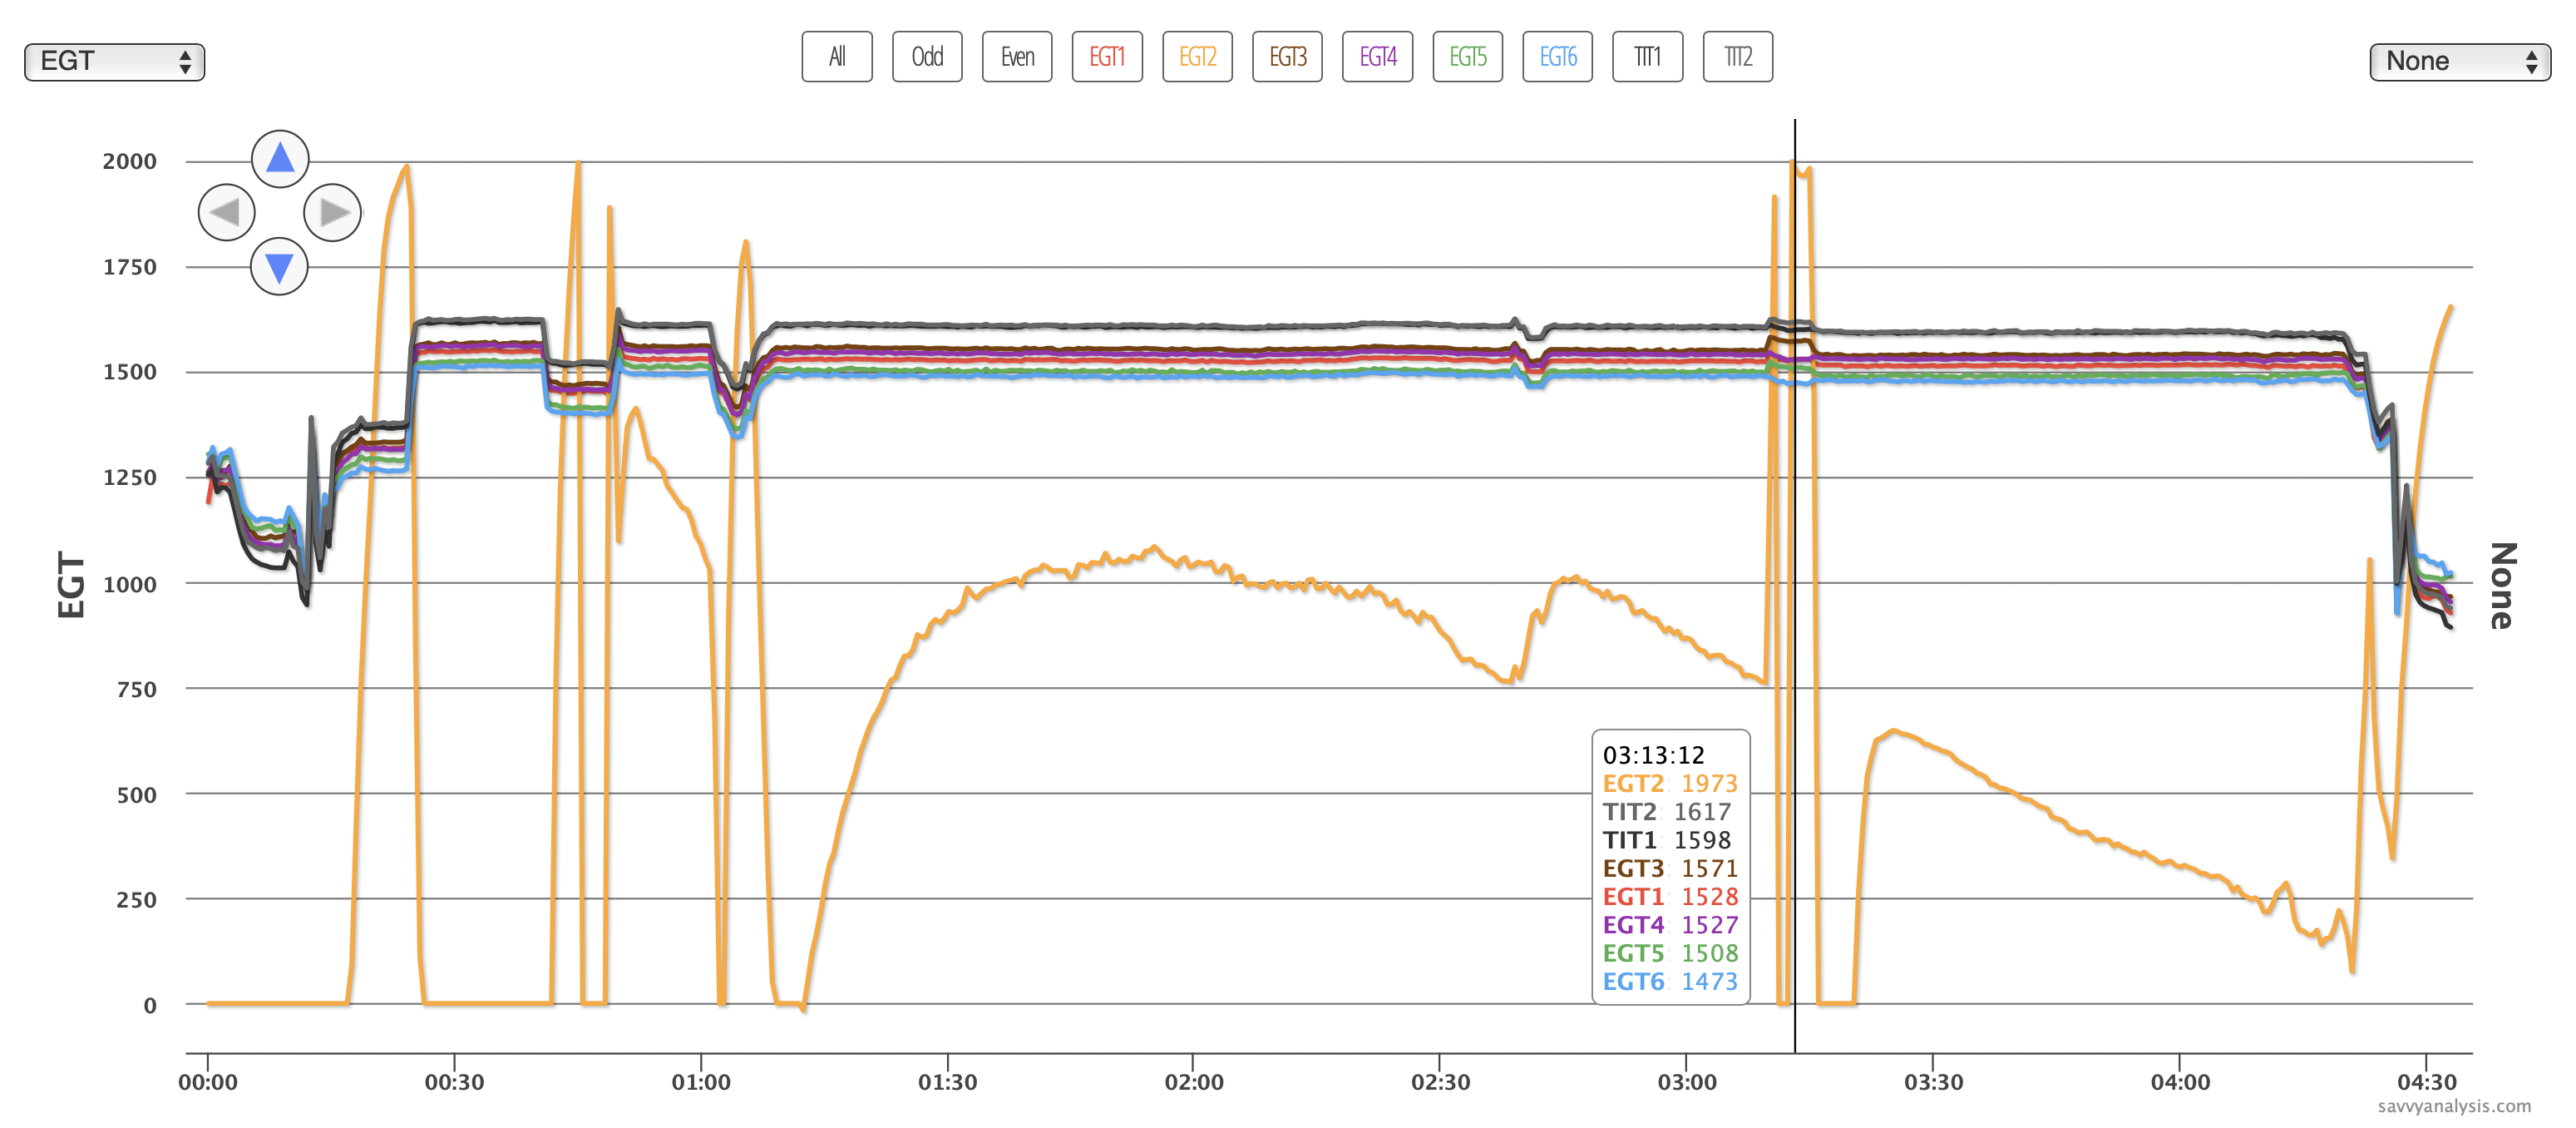
With probes, it almost always makes sense to check the connection first. In this case, that’s probably a step we can skip because of the wild swings in EGT. With a loose connection we’d expect to see normal tracking interrupted by drops to zero or spikes to the high limit for that brand of probe. This one’s jumping between zero and 1973º where the cursor is – never quite gets to 2000º – and for a while it stops spiking for a while and gives us a different flavor of unusable data. The silver lining here is we don’t have to spend a lot of time wondering whether we can trust the data or not.
Next is data from a Beech Debonair with a Continental IO-520 and data from a JPI 700 with a 2 sec sample rate. EGT on top, CHTs below.
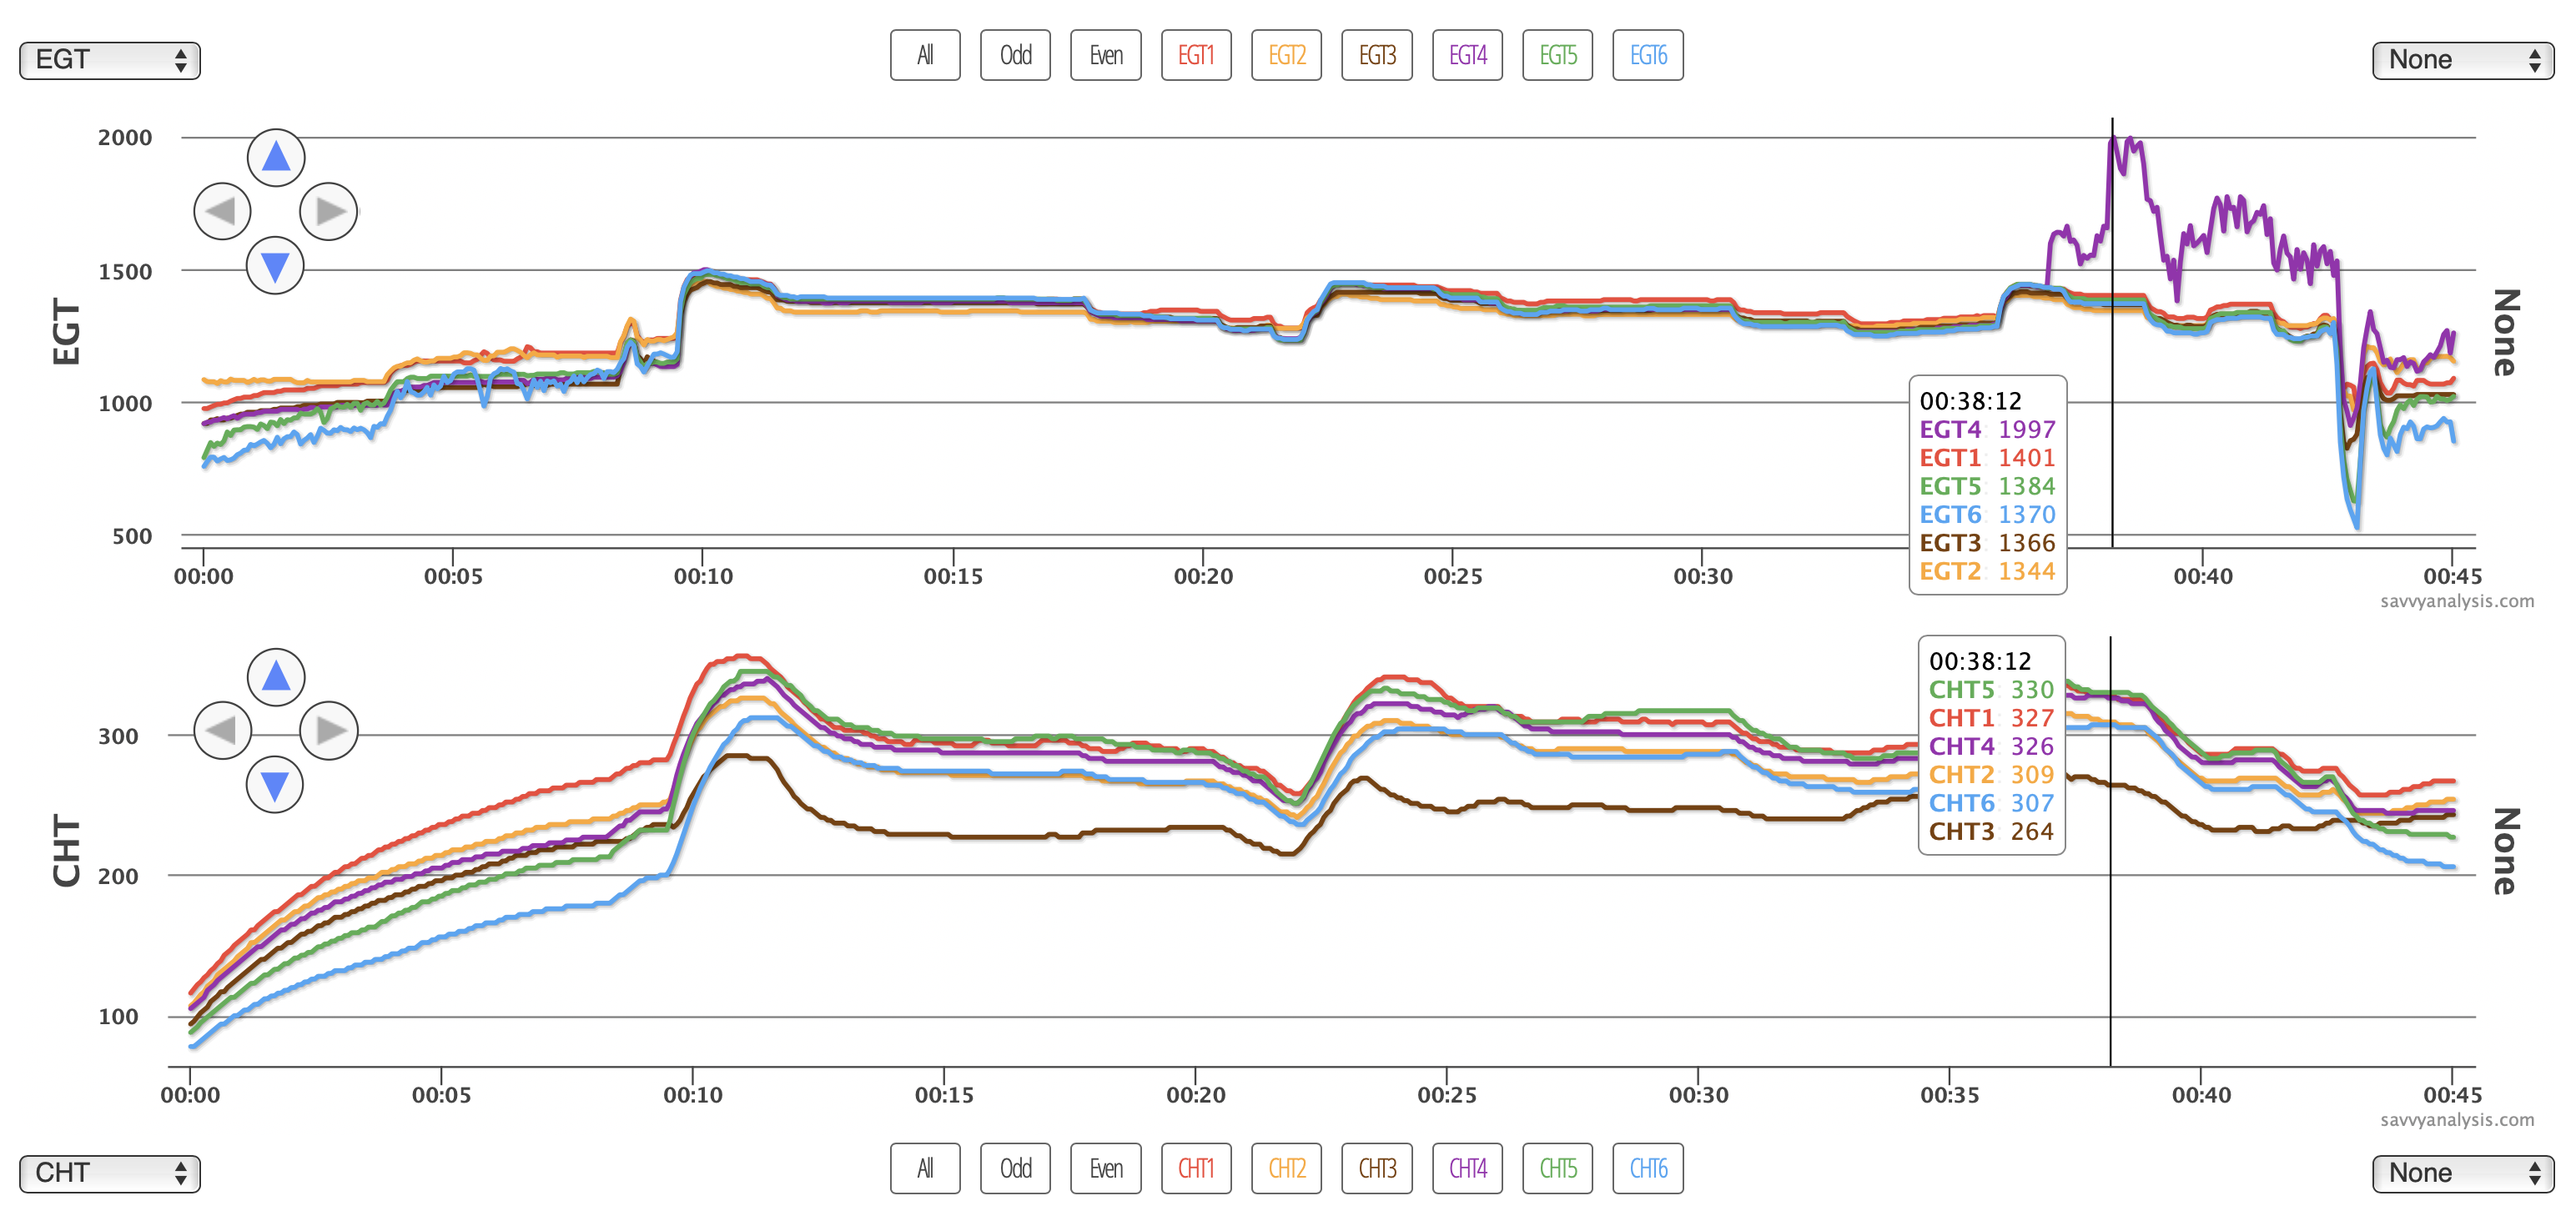
All of a sudden around the 37 min mark EGT 4 takes off and doesn’t quite get to 2000º either but 1997 is pretty close. Before that cruise EGTs are stable and uniform. When the analysis request arrived, there was no mention of roughness. We could assume that if the client didn’t mention roughness it must have been smooth, but if we ask you about it it’s because we’d rather not assume. This time it’s the EGT excursion by itself – no roughness and CHT 4 stays right where it was.
The client did mention that the JPI had recently been moved as part of an avionics upgrade. So now the question becomes is that a red herring tempting us to draw the wrong conclusion? Is it a bad plug, a bad probe or a wiring problem? That first jump up is to about 1650º. If a plug failed we typically see a rise of about 70-100º as we see in a LOP mag check when one set of plugs is turned off. This is already much higher than that, and that second jump to 1997 is uncharacteristic of a fouled plug.
Could it be detonation? We should see that in CHT, and we don’t. Is it a wiring problem left over from the panel work? Can’t rule that out, but why did it wait 37 mins to show up? Of all the possibilities, a failed probe seems most likely.
Here’s data from a Cessna 206 with a Continental IO-520 and data from an EI MVP-50. Our parser recognized a 0 sec sample rate which might have been a contributing factor. It looks like 12 secs of a 1 sec sample rate to me.
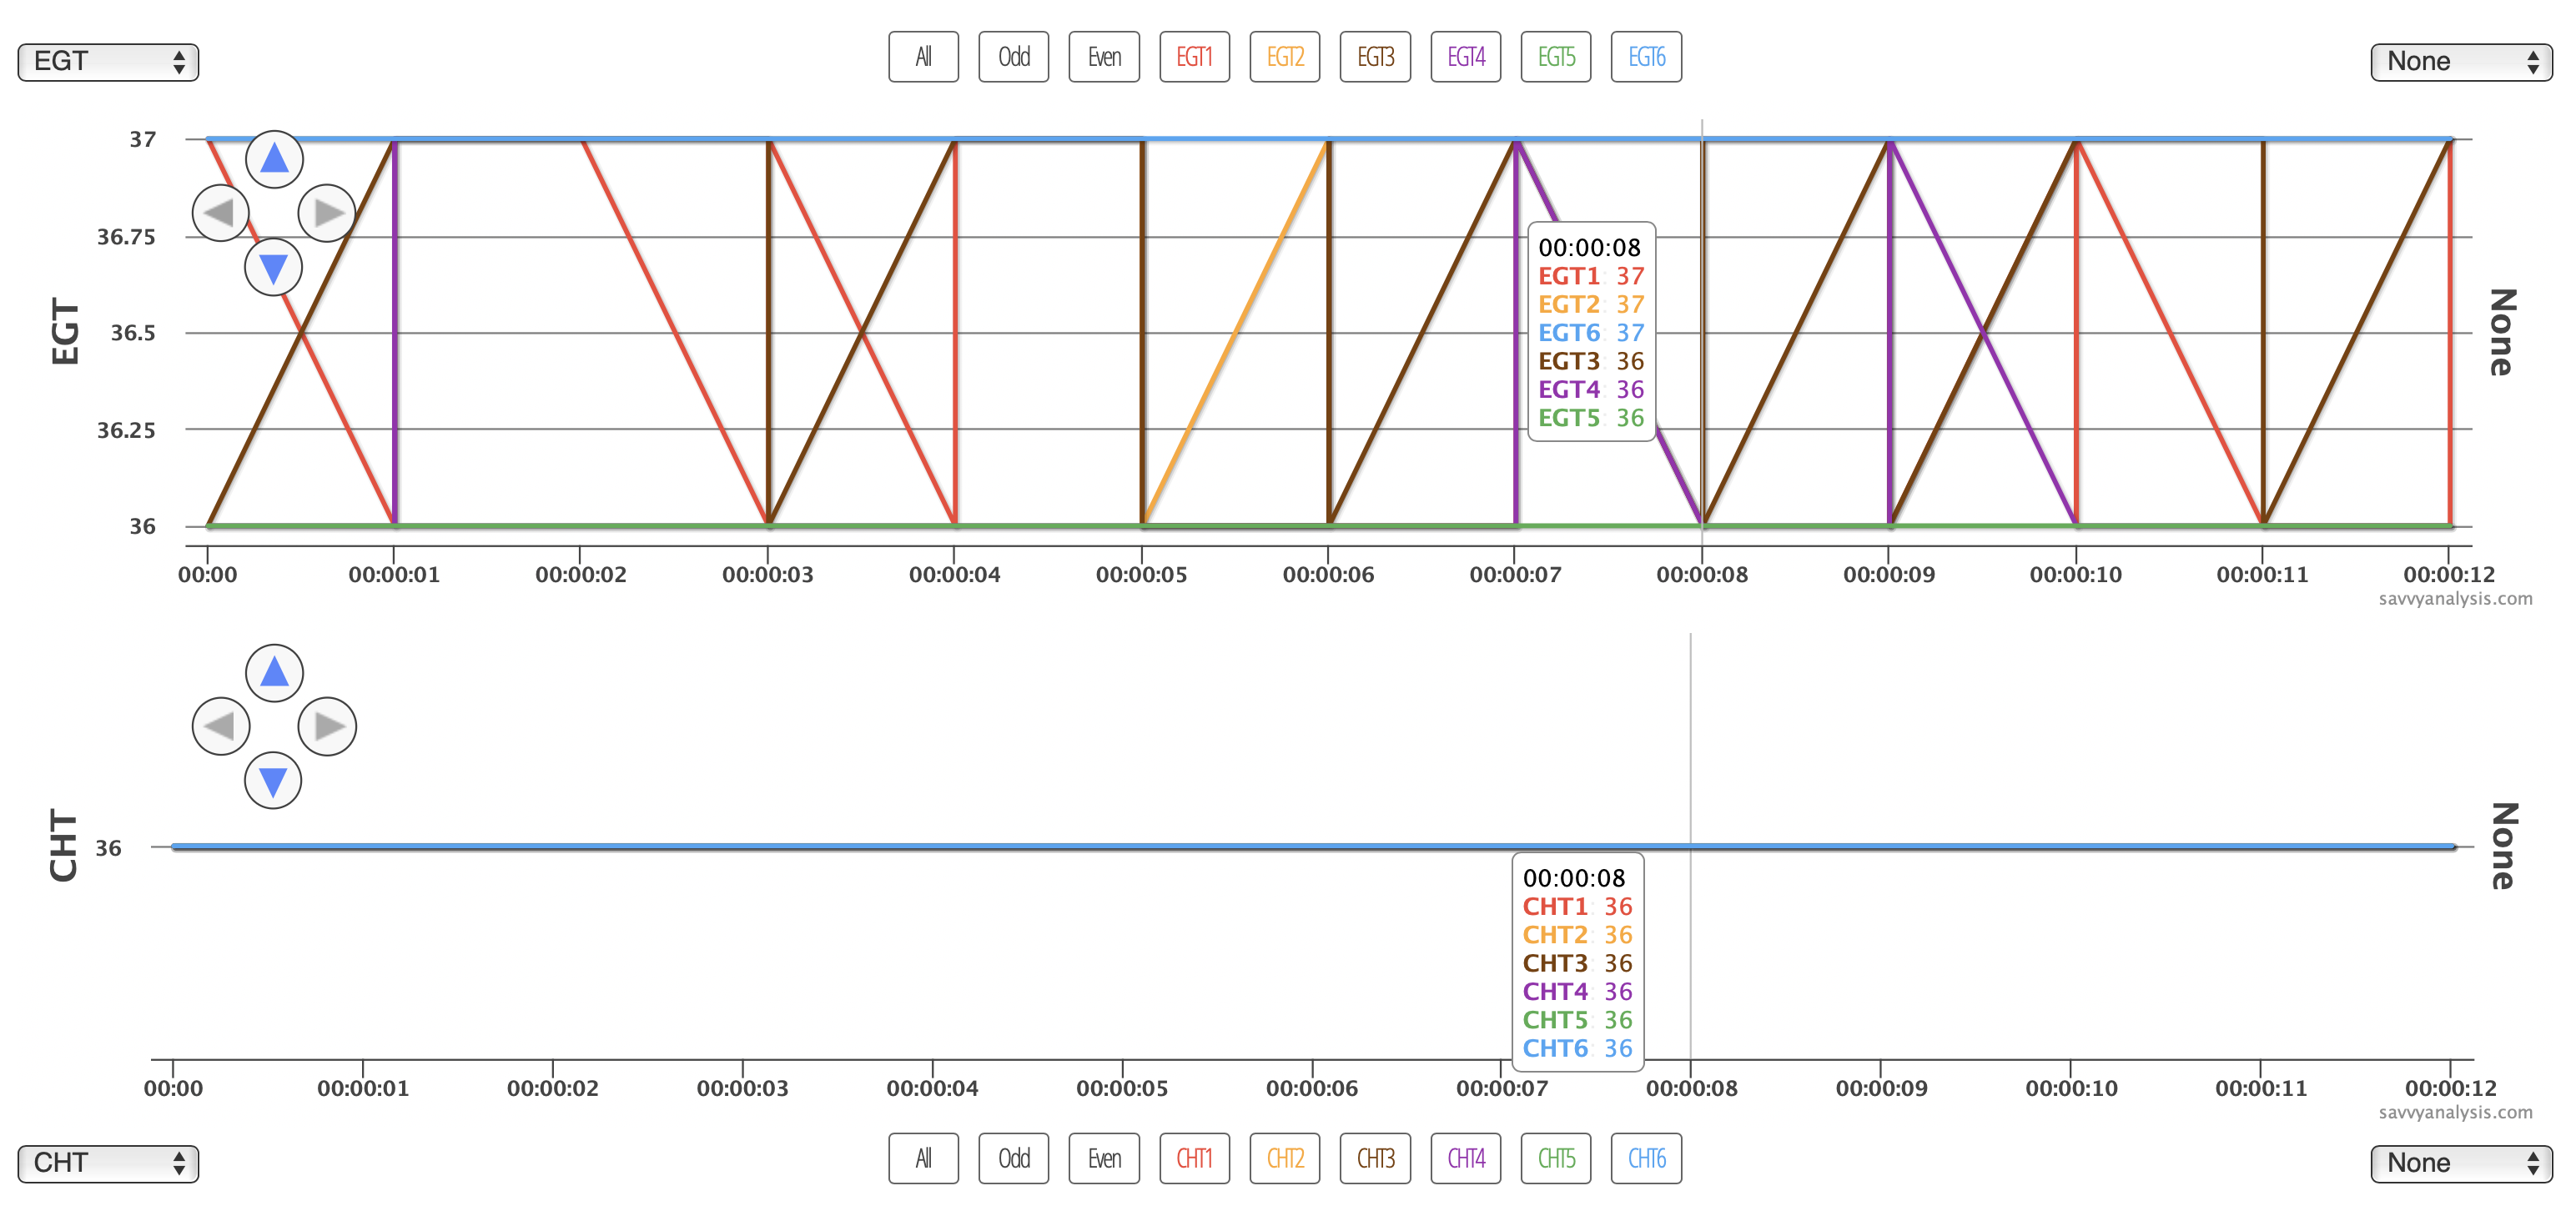
Nothing diagnostic here, just an interesting pattern and food for thought as to why some EGT probes – with their higher range of operations – attempted to depict a temperature between 36º and 37º, while the lower-range CHT probes didn’t. And notice that EGT 5 stayed at 36º and EGT 6 stayed at 37º as the other EGTs fought it out.
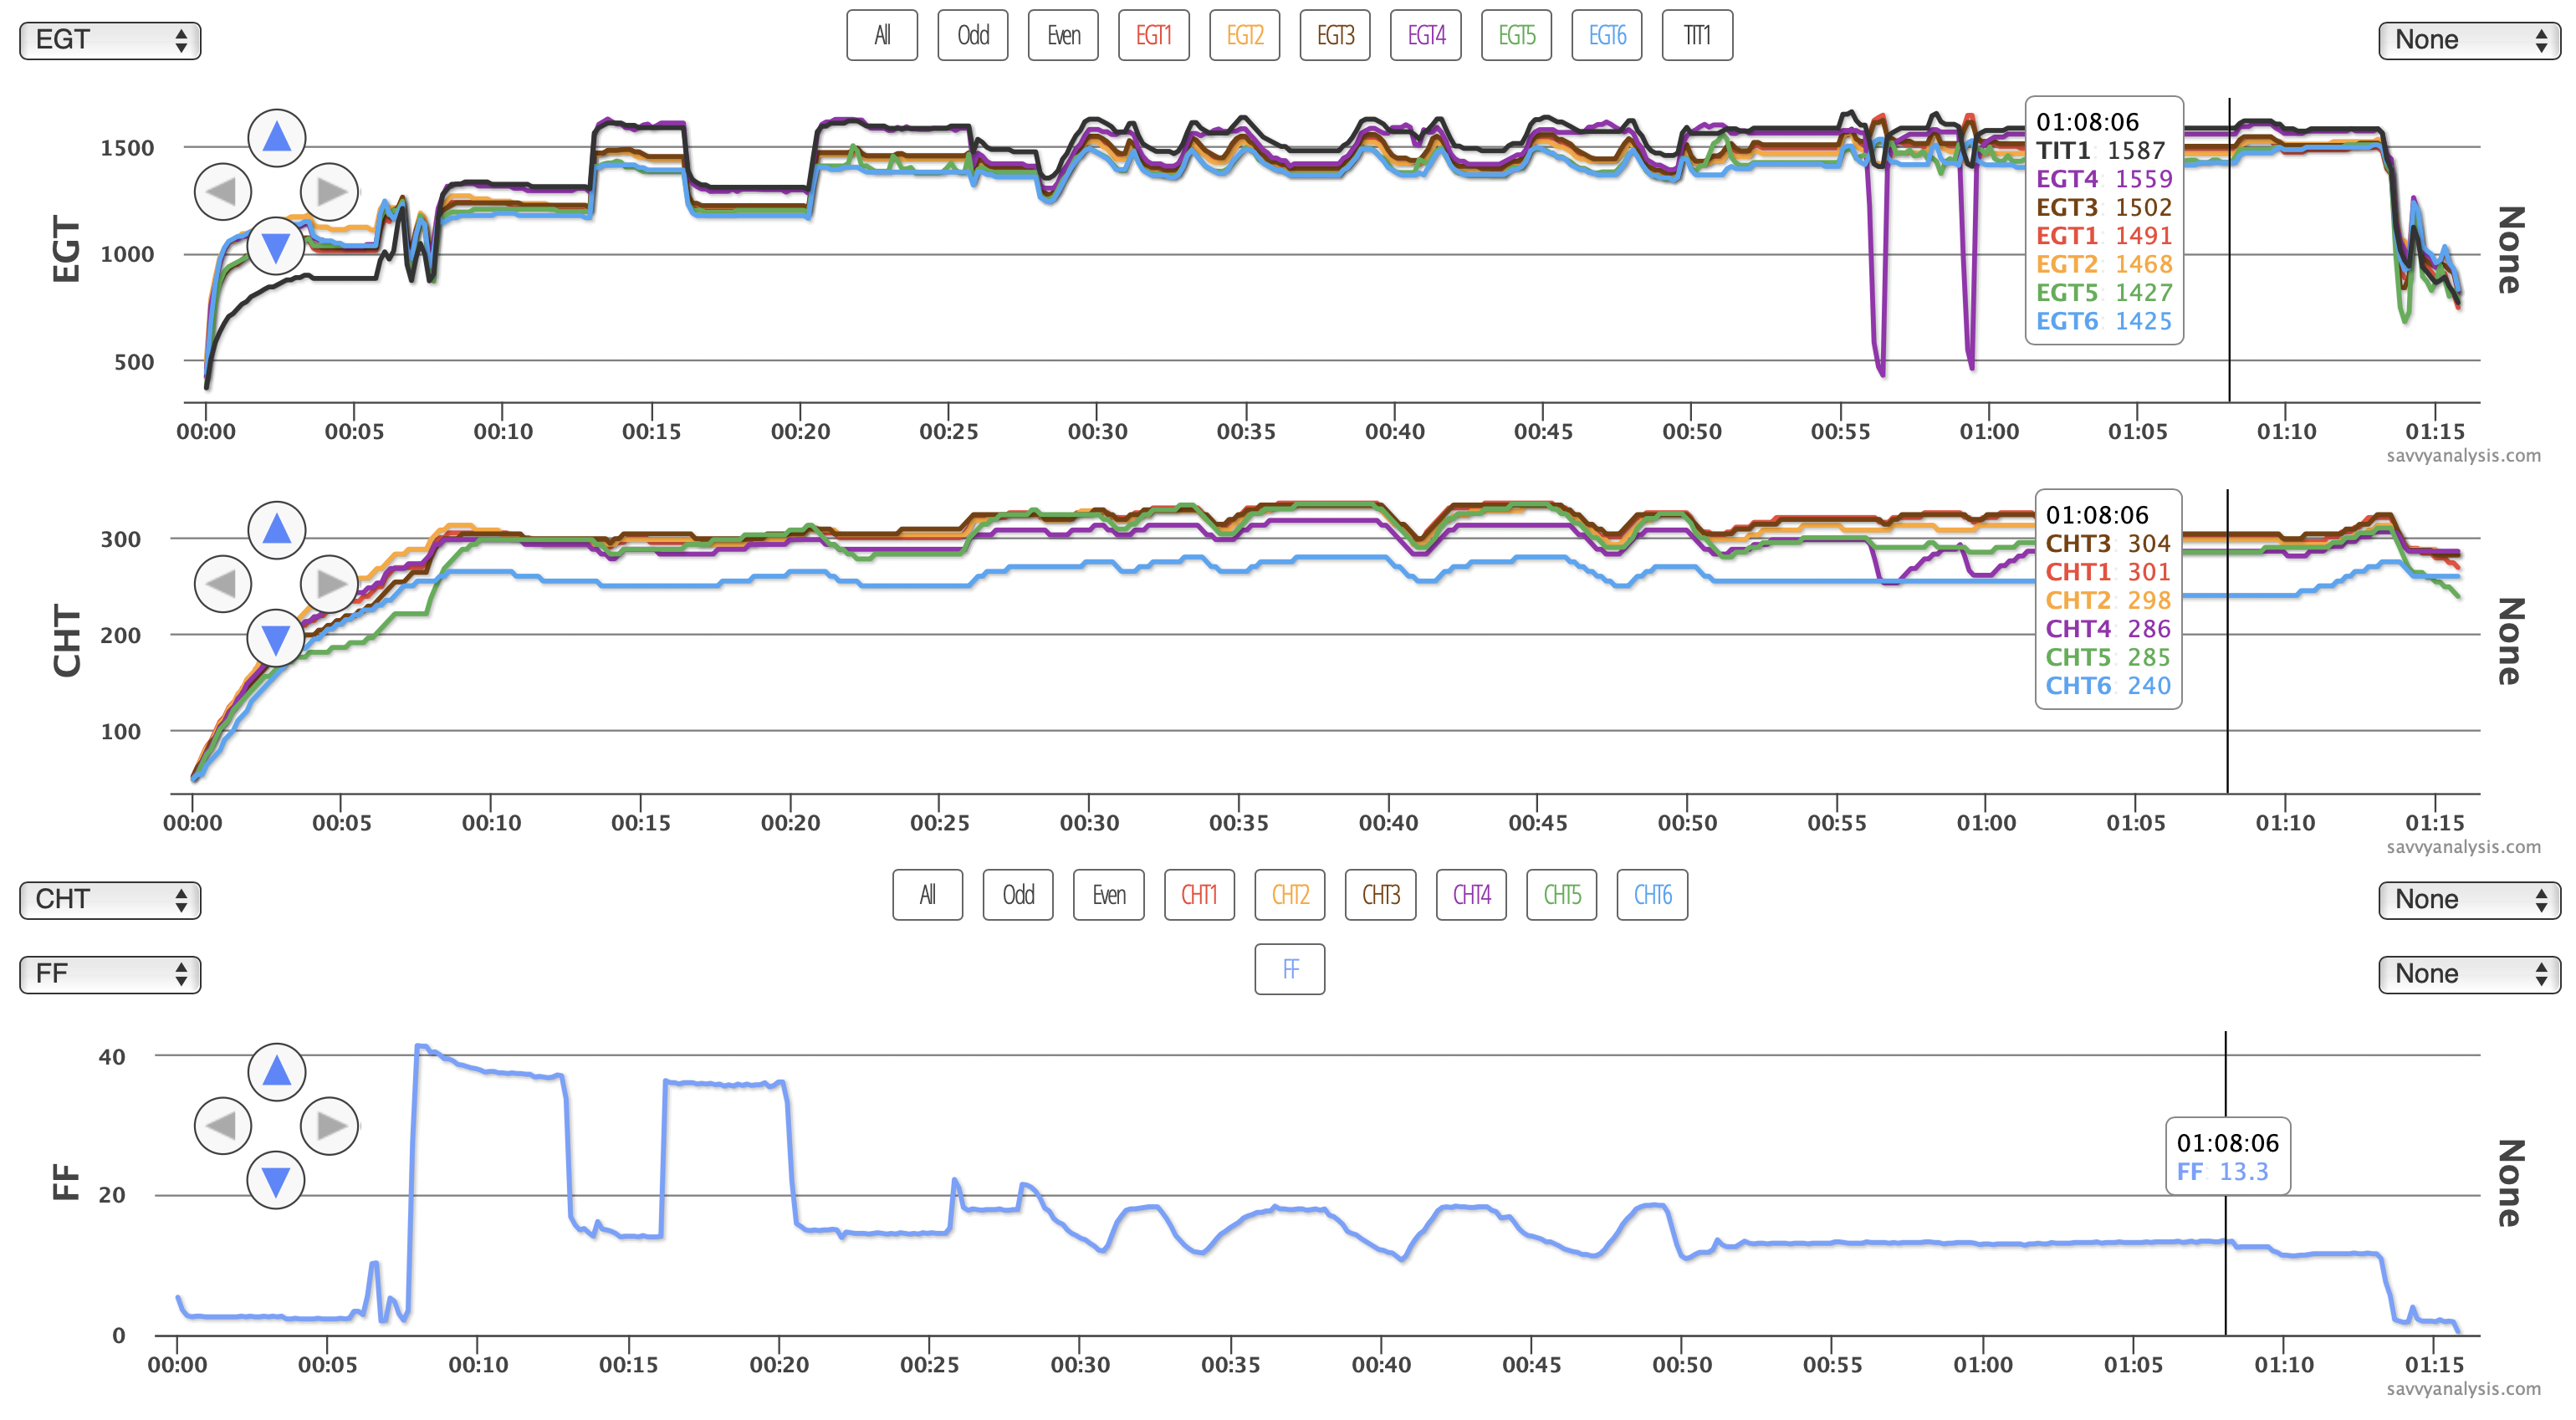
Here’s data from a Cirrus SR22T with a Continental TSIO-550 and Data from a Garmin perspective with a 1 sec sample rate. EGTs, CHTs below that, and FF and MAP below that.
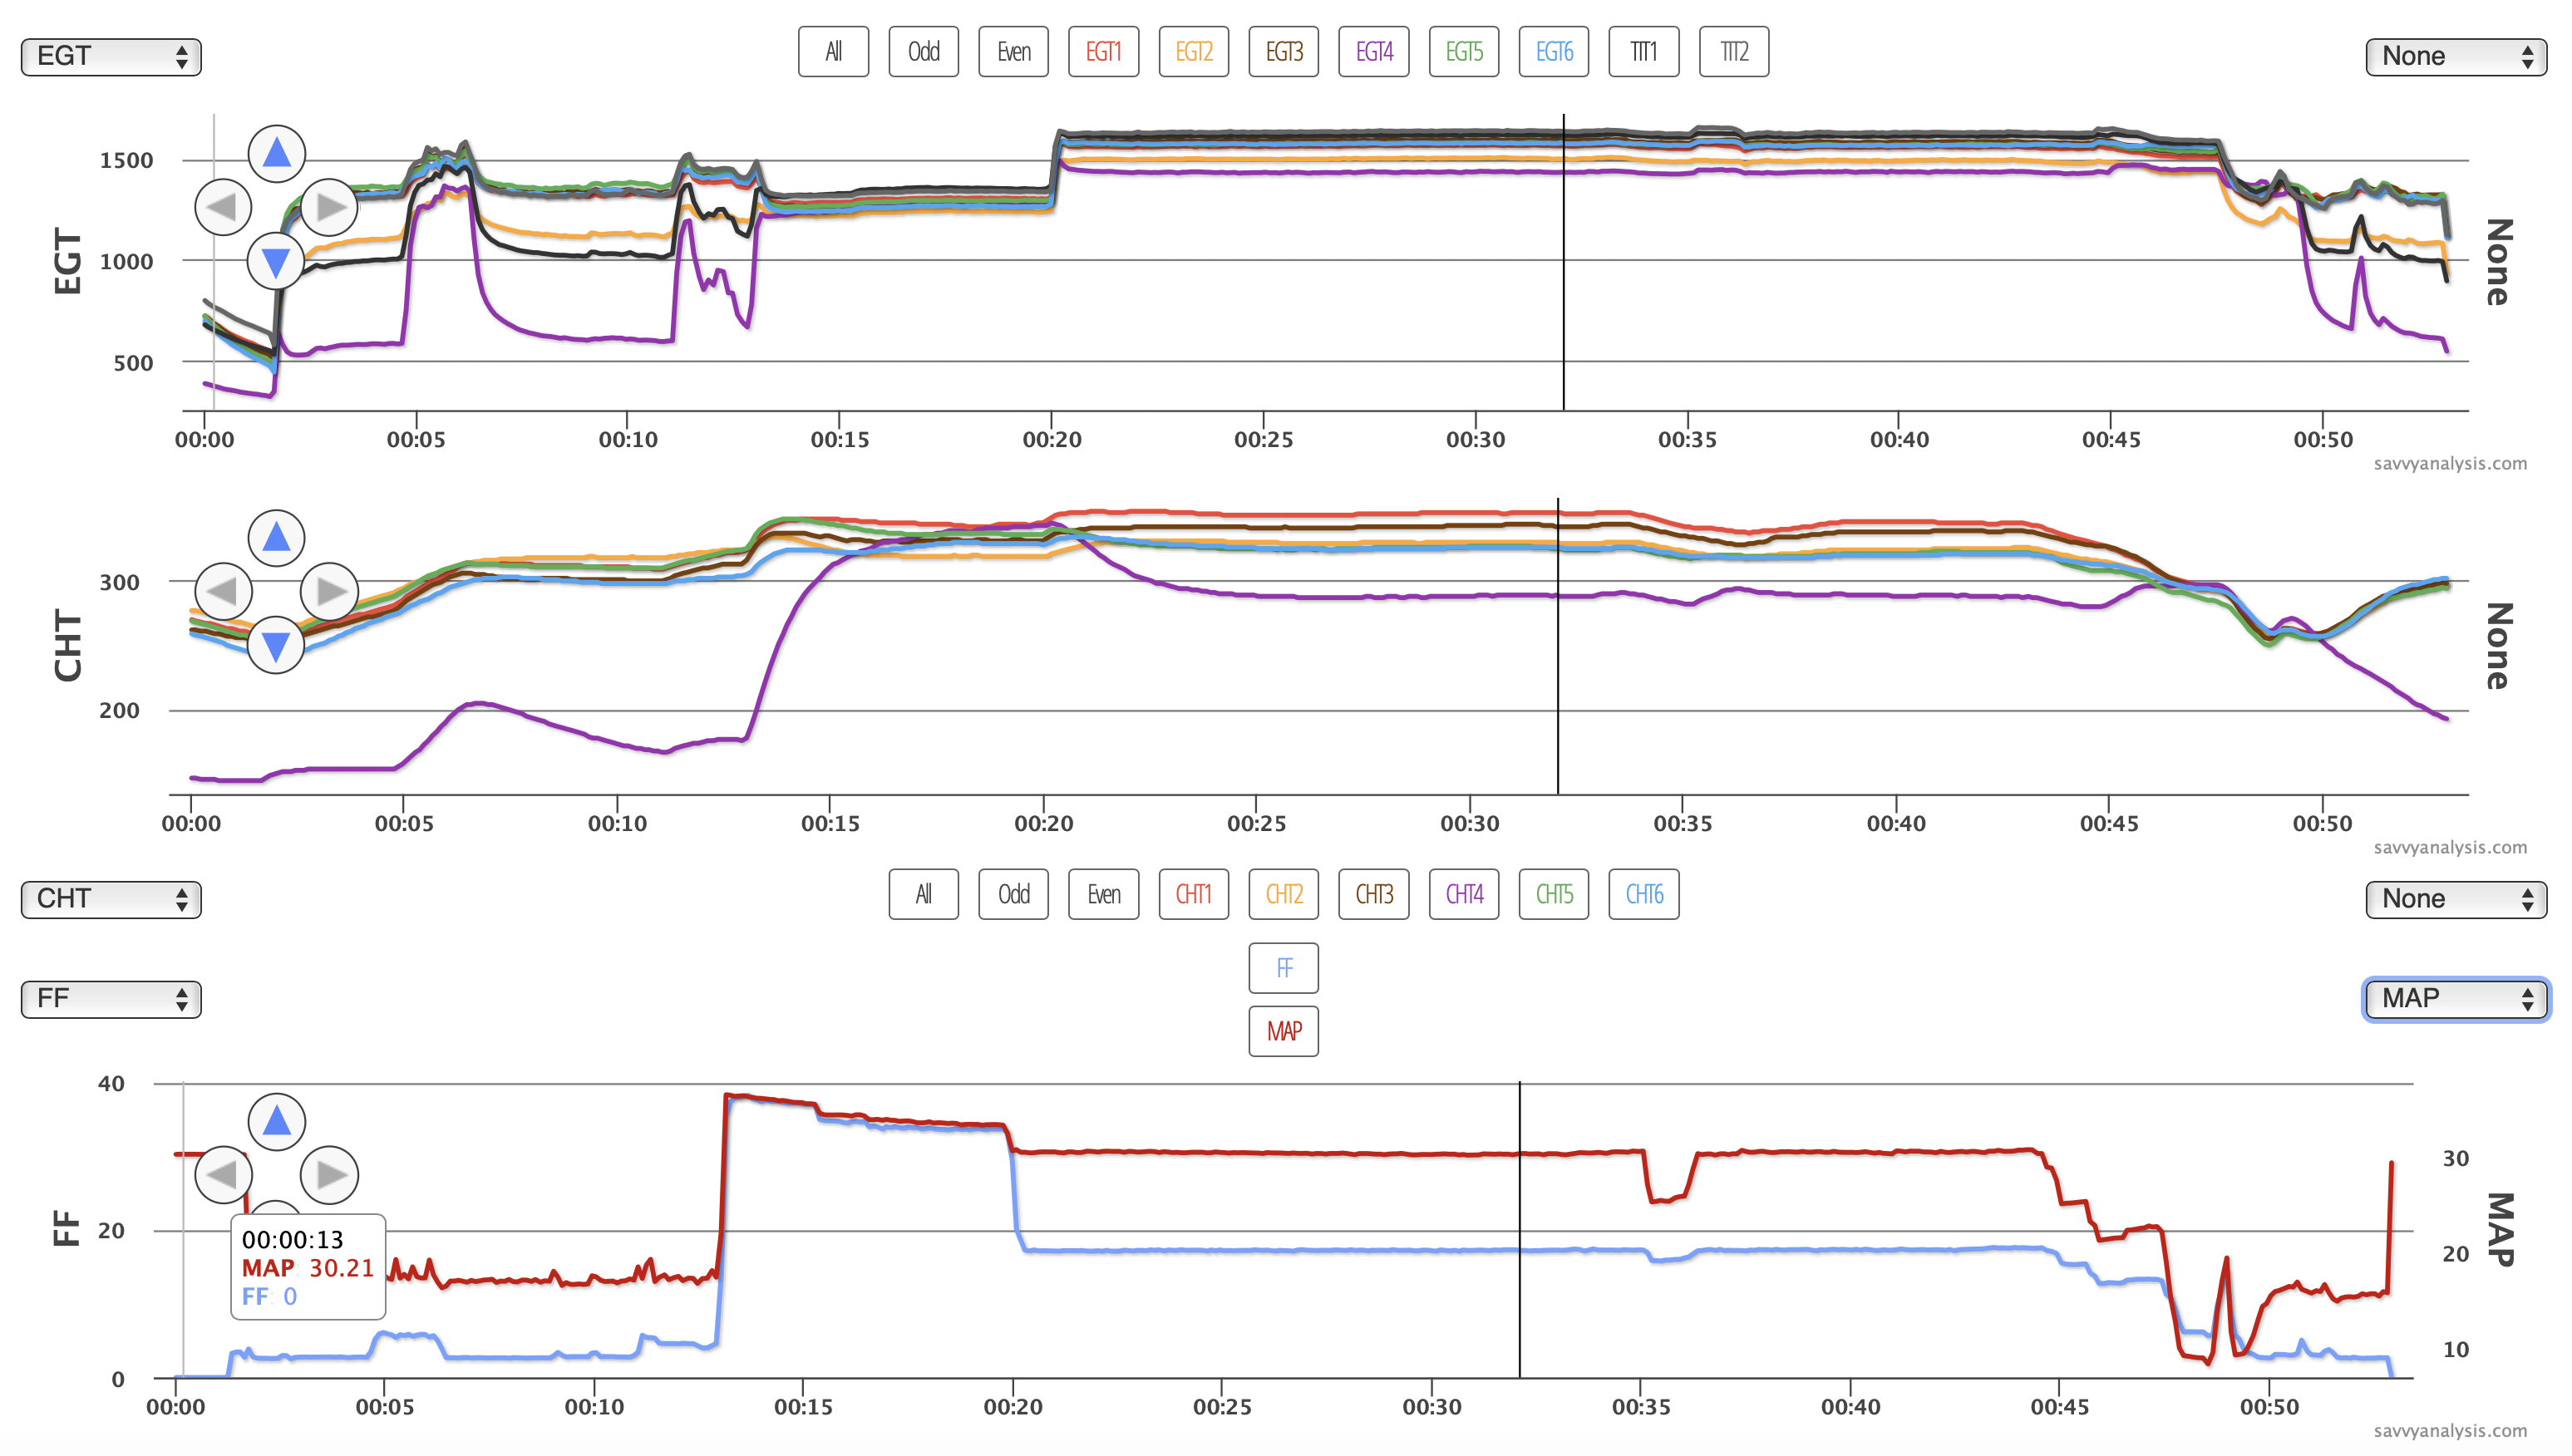
Cyl 4 is barely making power at low MAP, then is almost normal in climb, then makes partial power in cruise, then back to barely after landing. Again, the client didn’t report roughness, but he did report the airplane just came out of annual. Let’s go through the options.
With reduced FF like an injector clog, we should see high EGT and CHT at max FF then both should move lower as FF is reduced and the cyl struggles to make power. We’re seeing half of that, but EGT and CHT aren’t high at max FF. What about spark? If one plug were bad, EGT should be higher, not lower. If both plugs were bad how are we even getting this much power – and almost normal numbers in climb?
That leaves air. I put the cursor in the cruise segment so I didn’t cover up the low EGT and CHT after engine start. So with a keen eye you could tell that the MAP is about 3/4 of the way between 0 and 20, and in fact it’s about 17″ there – vs the 12-14″ we like to see at 900-1000 RPMs. High MAP at idle can be a symptom of an induction leak. A leak could be caused by a loose or leaky induction tube, or maybe a valve is not closing. We’ve seen sticky valves that stopped sticking when power was applied.
Then we noticed that EGTs and CHTs for 2 and 6 were also on the low side – not as dramatic as 4, but lower than 1-3-5. And that’s when the client reported that the shop had discovered that all 4 bolts on the cyl 4 induction tube were only hand tight, and the gasket was damaged from the vibration. So why did the EGT and CHT seem normal in climb? Remember, it’s a turbo – and as ambient pressure drops in the climb, the turbo makes up the difference. Then when MAP is reduced at the 20 min mark, the cyl gets less air / more gas and runs rich.
We’ll finish up the 4th month of the year with another anomaly from a cyl 4. I didn’t plan all these #4s – it’s just the way the cookie crumbled. This is data from a Beech B36TC with a Continental IO-550 (TN) and data from a JPI 830 with a 1 sec sample rate. This is a test profile flight with EGTs on top, CHTs below and FF below that. Here’s the whole flight.
And here’s the mag check at the 55 min mark.
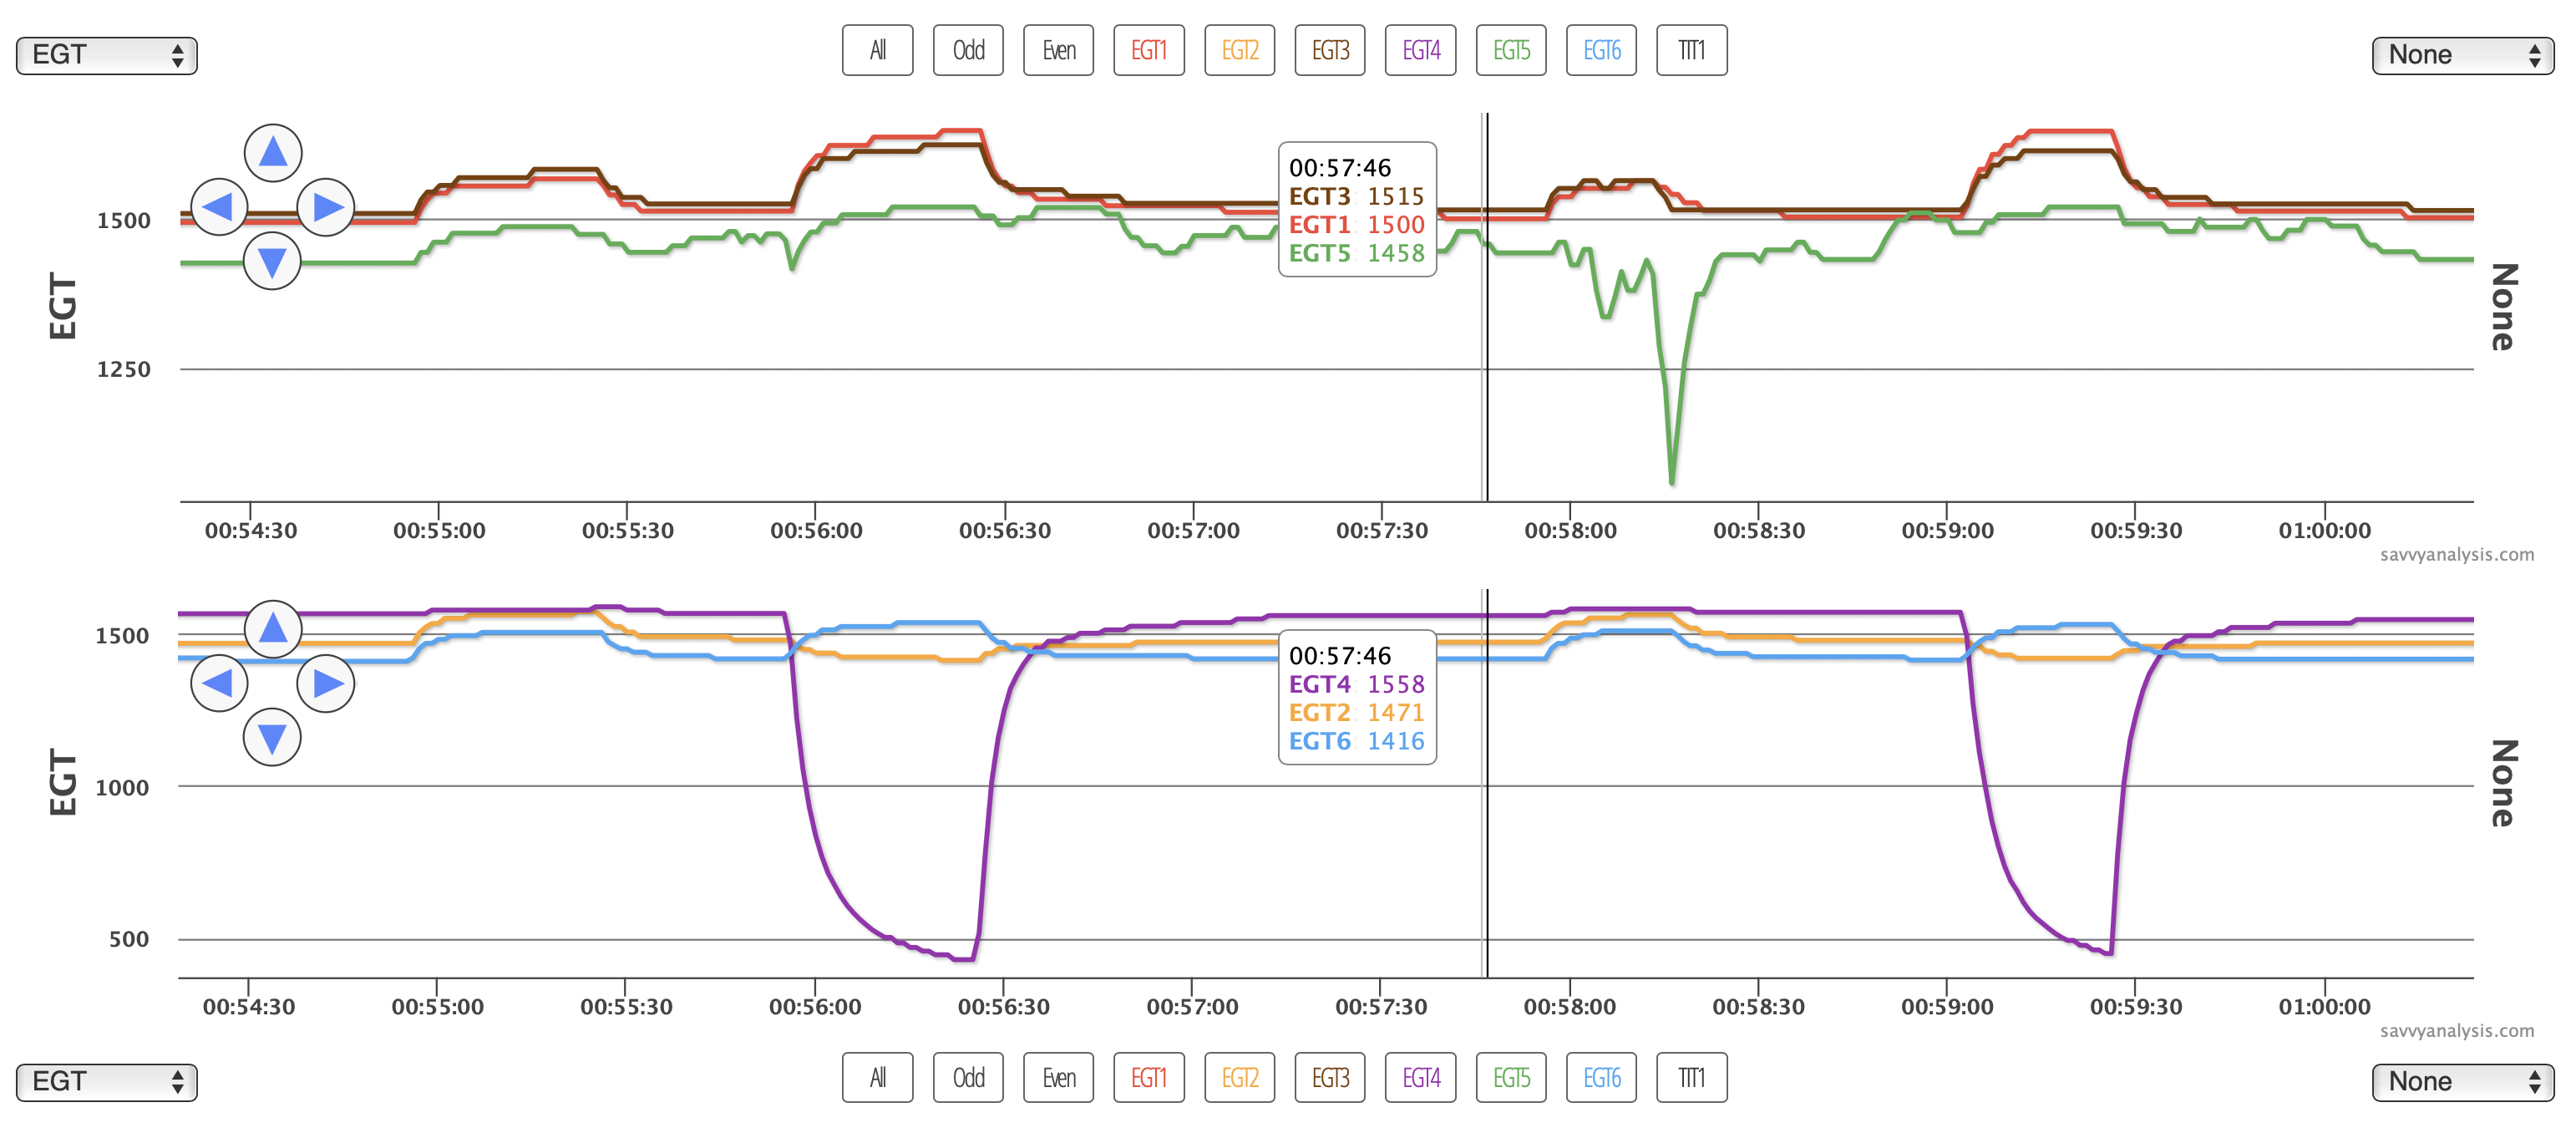
The top plug of cyl 4 looks like it’s not even trying. How do we know it’s the top? See the rise in EGTs 1 and 3 that are concurrent with the drop in 4? If those are the bottoms of 1 and 3, then this must be the top of 4. The top plug of 5 doesn’t look healthy on the second mag checked, but it looked ok on the first check. If you go back to the full flight, 5 looks like it’s having other problems, too. And it looks like the top plug of 6 rises when it should be falling. But 1, 2 and 3 look ok.
Stay safe, stay healthy and let’s hope we can all be gathering more engine data soon.
