If an engine monitor probe or sensor is going to fail, would you rather have it just fail and be done with it, or have it be reliable some of the time and distracting some of the time? Neither has much appeal, but at least with the failure, you can skip the detective work of does it only happen in flight, or when the engine is warm, or when the tanks are full, or…?
With intermittent data, it almost always makes sense to check the connection first. Sometimes the data can give you clues as to the odds of it simply being a case of a loose or dirty connection. Sometimes the data is accurately logging the intermittent failure of an engine component. For each case, a decision tree helps guide the process. In this puzzler we’ll analyze some examples and see what they can tell us.
Here’s data from a Cirrus SR22 TN powered by a Continental IO – 550 turbo normalized engine and data from a Garmin G1,000 with a one second sample rate. Here are EGT, CHT and FF for the 35 minute flight. Something happens at the 10 minute mark, but I put the cursor on engine start so that you had a clear view of the temps before and after the event.
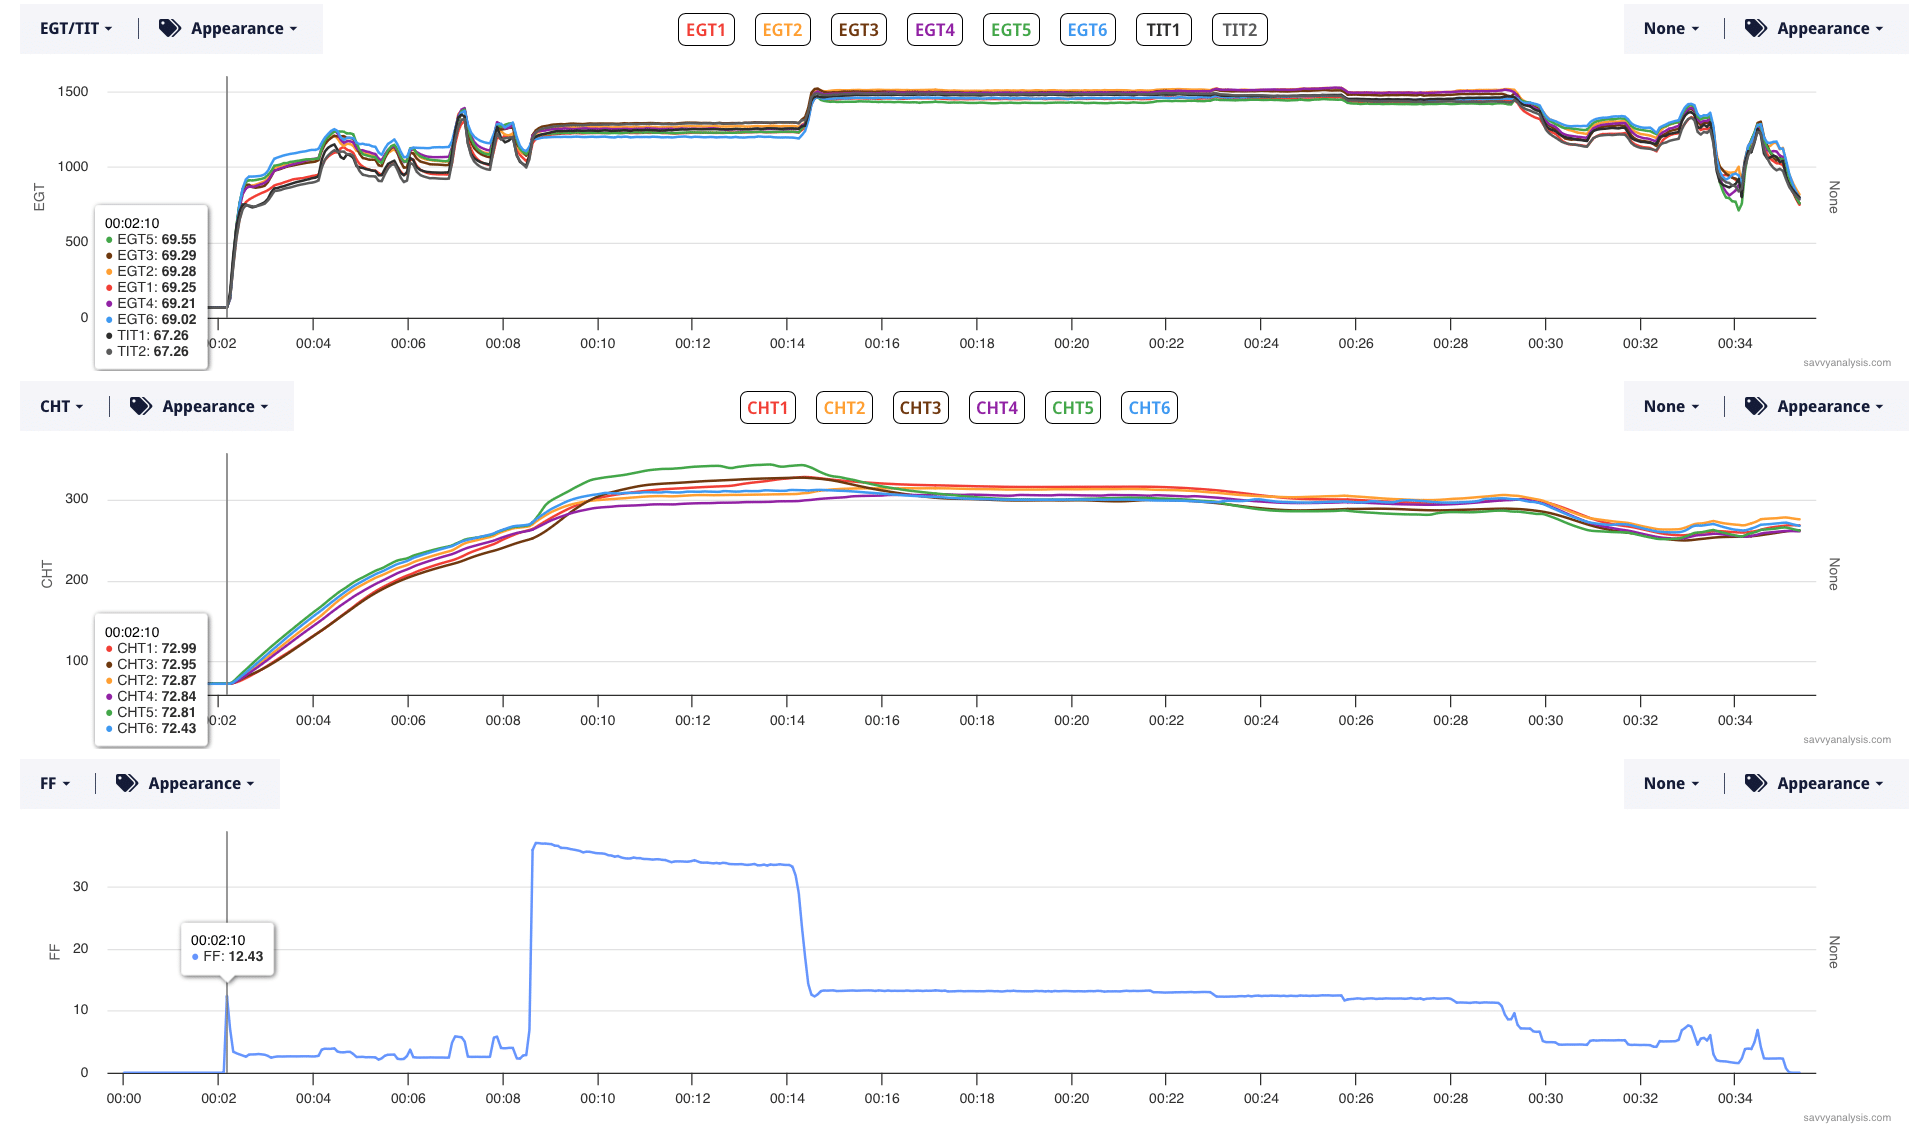
All good, right? CHT 5 is a little high in climb, and the CHT spread is better once the airplane noses over for cruise. But nothing scary here. Now here’s the same flight data with oil temp and oil pressure depicted.
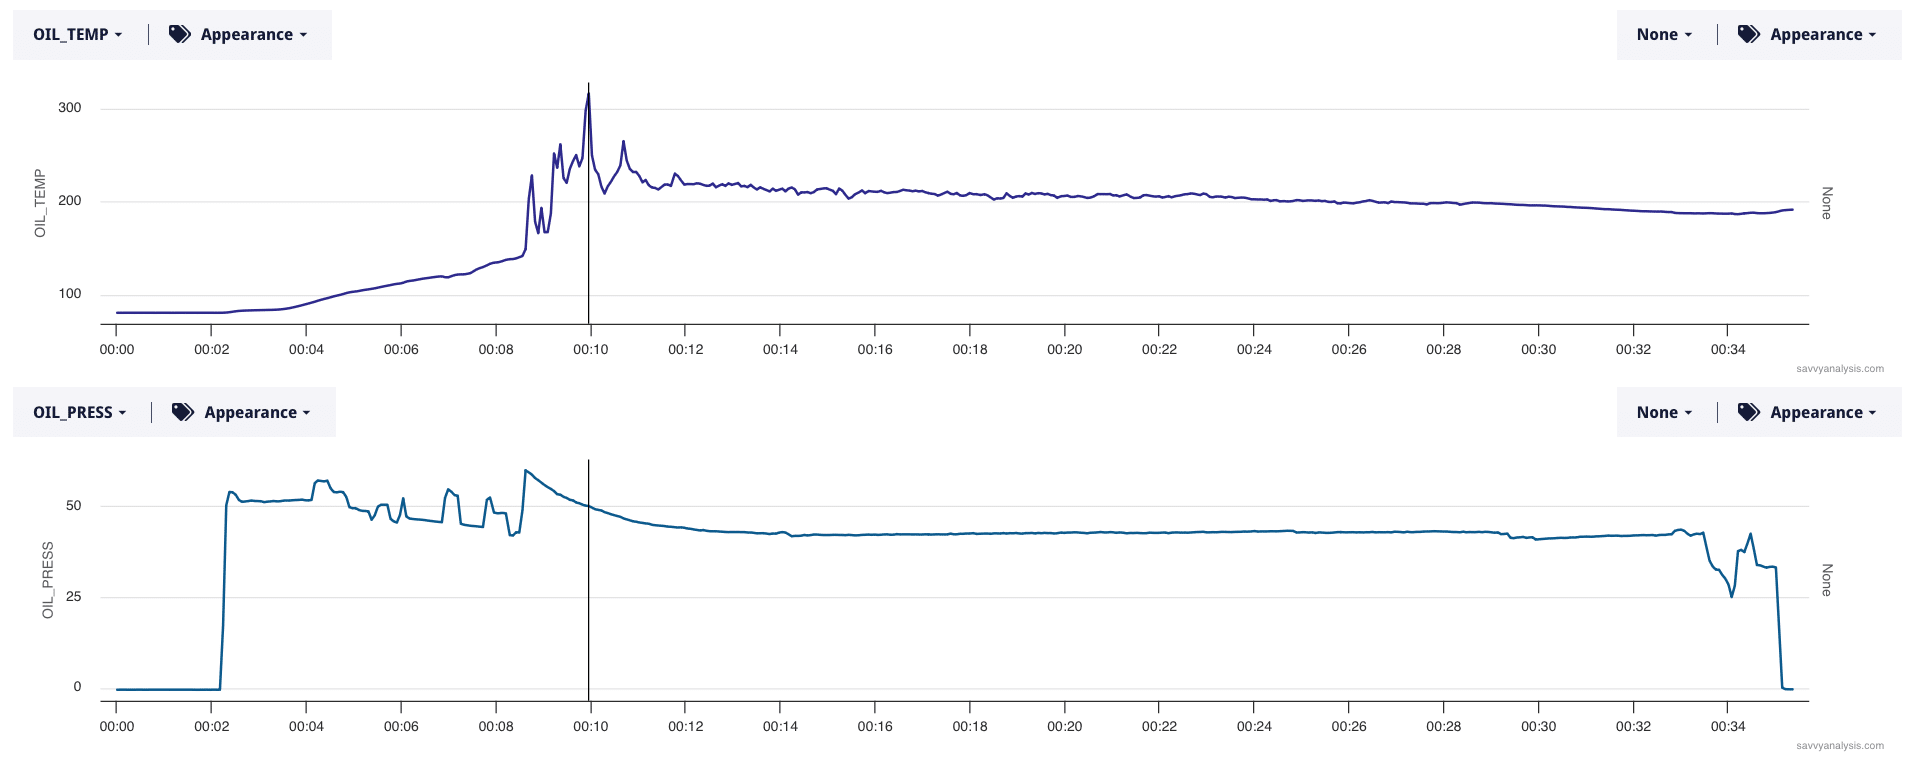
Oil pressure moves around a little bit before takeoff – lined up perfectly with the preflight runup. Oil temp at takeoff is about 150º, and spikes to a high of over 300º. The decision tree for this scenario comes down to: is this reliable data depicting a catastrophic surge in oil pressure or can we dismiss this as bogus data? Nothing in the other engine data traces corroborates an engine anomaly, so we’ll go with bogus data. The next step is determining whether the connection is solid and this is a sensor failure, or if the problem is more likely to be the connection.
There’s a pretty good argument for a loose or dirty connection. All the mischief starts when power is applied and airspeed increases. When I depicted the airplane’s heading data, I wouldn’t have been surprised to see some correlation between the oil temp spikes and the turn rate, but in this case that wasn’t there. The spikes settle down about halfway through the climb, and when power is reduced at the 14 minute mark oil temp is still a little wobbly, but the spikes are gone. By the 28 minute mark, the trace is flat like nothing ever happened. It’s hard to make a case for a failing sensor that improves as the flight goes on.
If you saw that initial spike in the takeoff roll would you abort? If you saw the additional spikes in initial climb, would you come back and land? The importance of the mission and the weather at the airport would certainly factor into your decision.
Next up is data from the left engine of a Piper Turbo Seneca, powered by a Continental TSIO – 360 and data from an Insight G4 with a 1 second sample rate. EGTs on top, then CHTs, then Altitude.
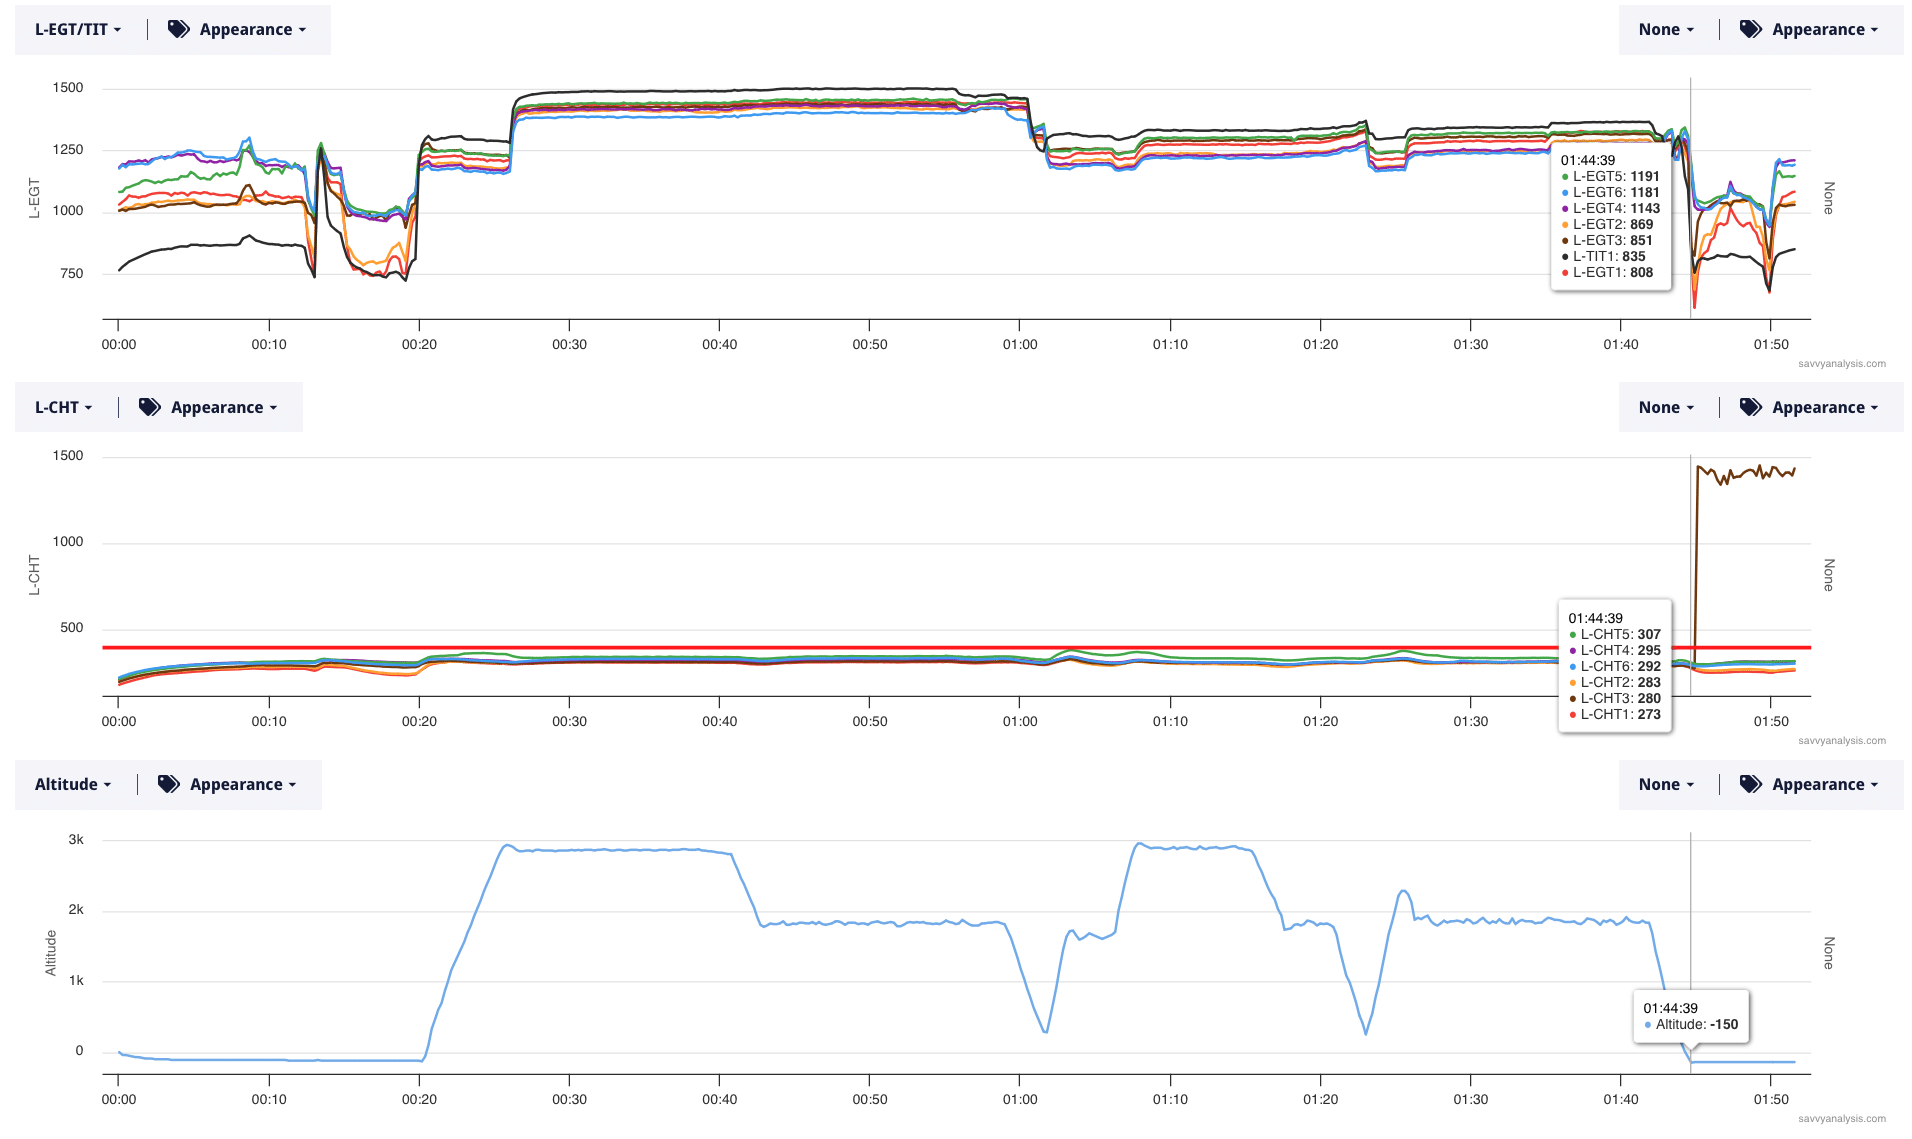
The CHT traces are squished because the gigantic jump in CHT 3 at 1 hr 45 mins resets the Y axis. Altitude is showing -150 during ground ops. It’s possible that this 90-ish minute flight was at the Salton Sea or Death Valley and those are actual MSL altitudes. Map data isn’t logged but airport departure and destination were logged, and the flight originated and ended at a coastal airport with an elevation above sea level.
But the real issue is that giant CHT 3 jump just as the airplane lands. The decision tree on this is pretty easy. We know this isn’t accurately measuring the CHT instantly jumping 1000°. We know because metal doesn’t heat up that fast, plus there’s no change in the CHTs of nearby cylinders or the EGT of cylinder 3.
It’s hard to make a case for this being a loose or dirty connection. The timing of the event is the best argument for a loose connection – just as the wheels touch. But the jump up versus down, and the size of the jump both argued for this being a failed probe. To test the theory I looked at other recent flights and found a mirror-image flight about a week earlier.
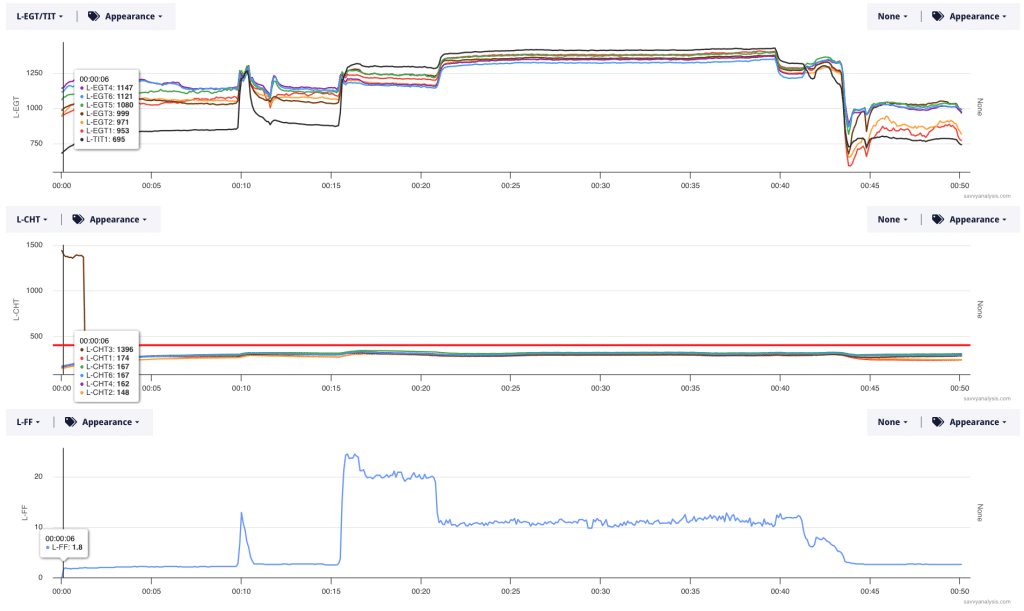
It still seems like a failing probe and not a loose connection, but it always makes sense to check the connection first.
We’ll finish this month with an RV-9 powered by an Aero-Sport IO-320 and data from an Advanced Flight Systems 5500 with a 1 second sample rate. This is a 17 minute ground run – FF never gets higher than 5 GPH.. Cursor is off to the right out of the way.
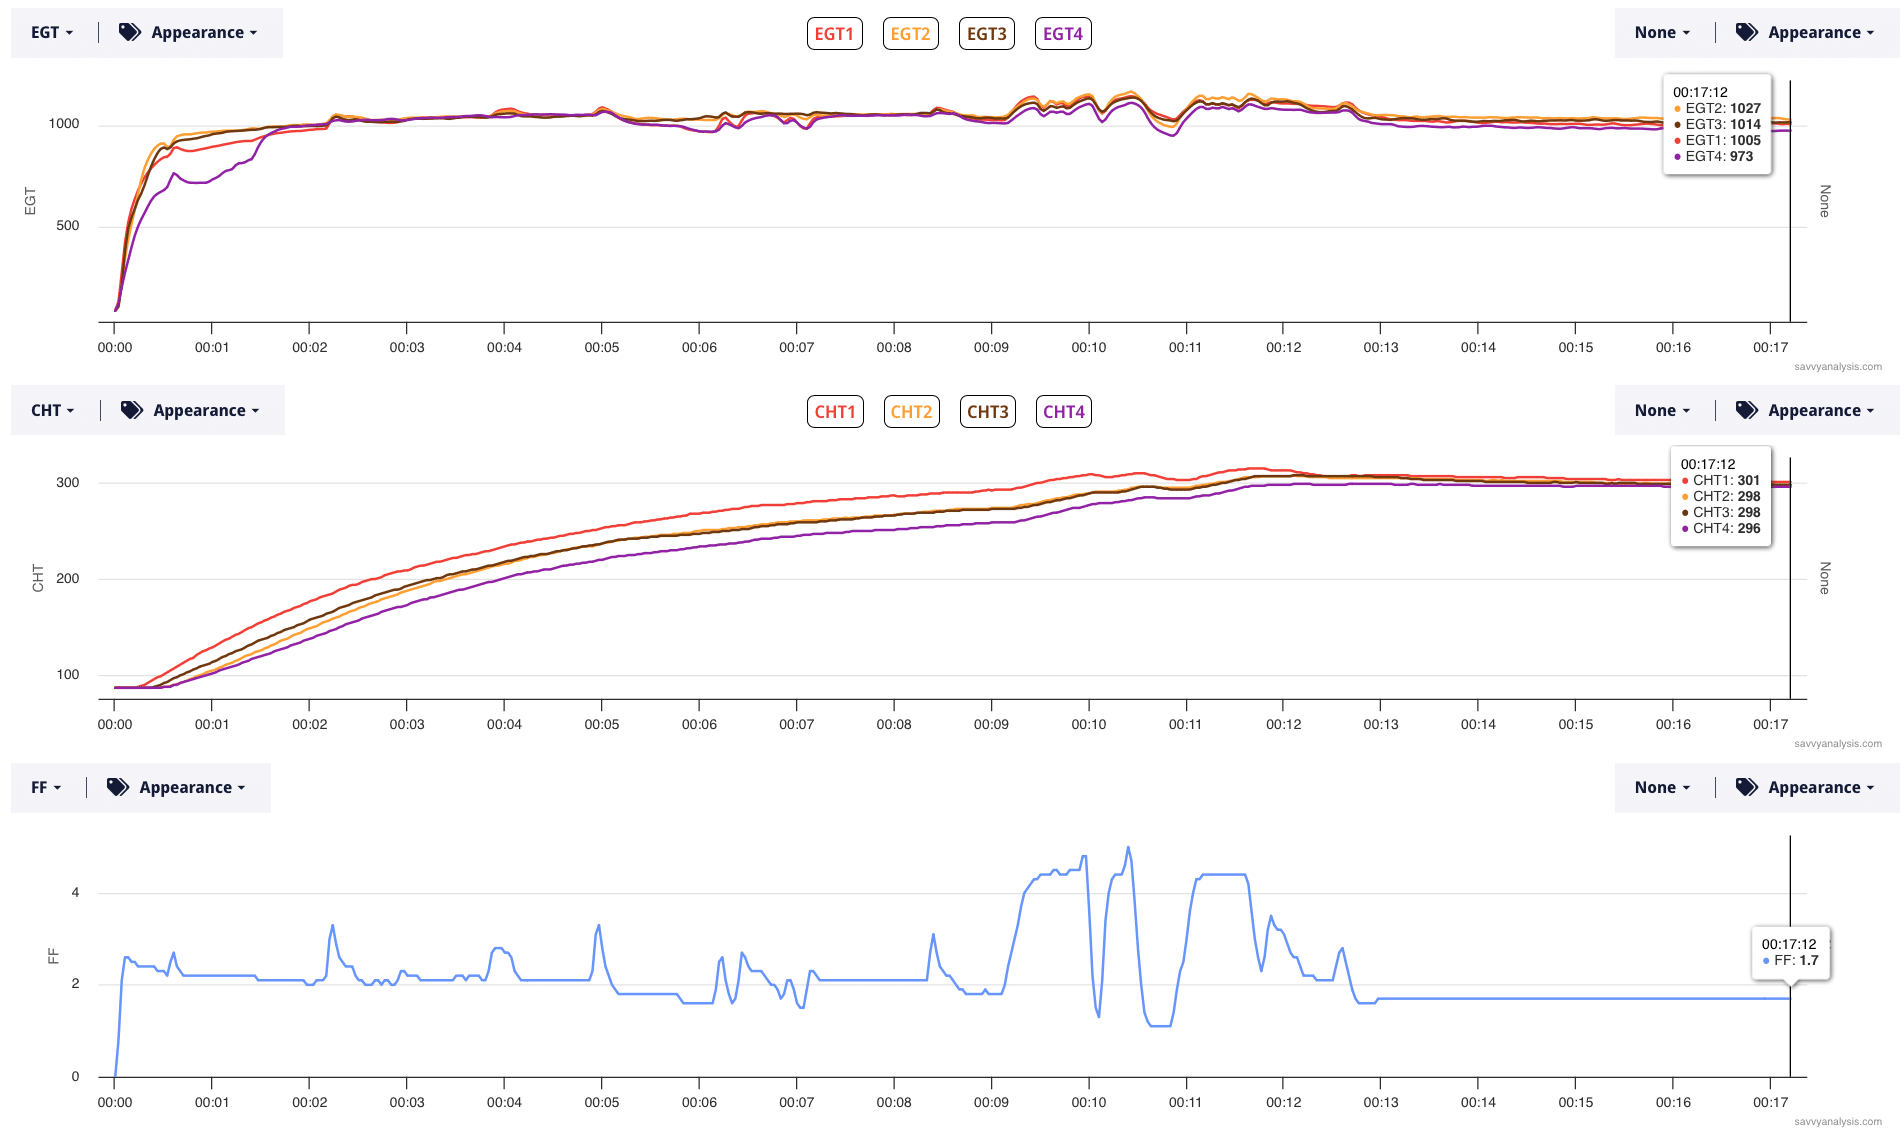
Once again, all seems good. EGT 4 is a little slow to rise – take about 90 seconds to get in the game – which could be a sticky valve. Something to monitor. But not seeing anything scary, right? Let’s look at oil pressure and oil temp for the same 17 min run.
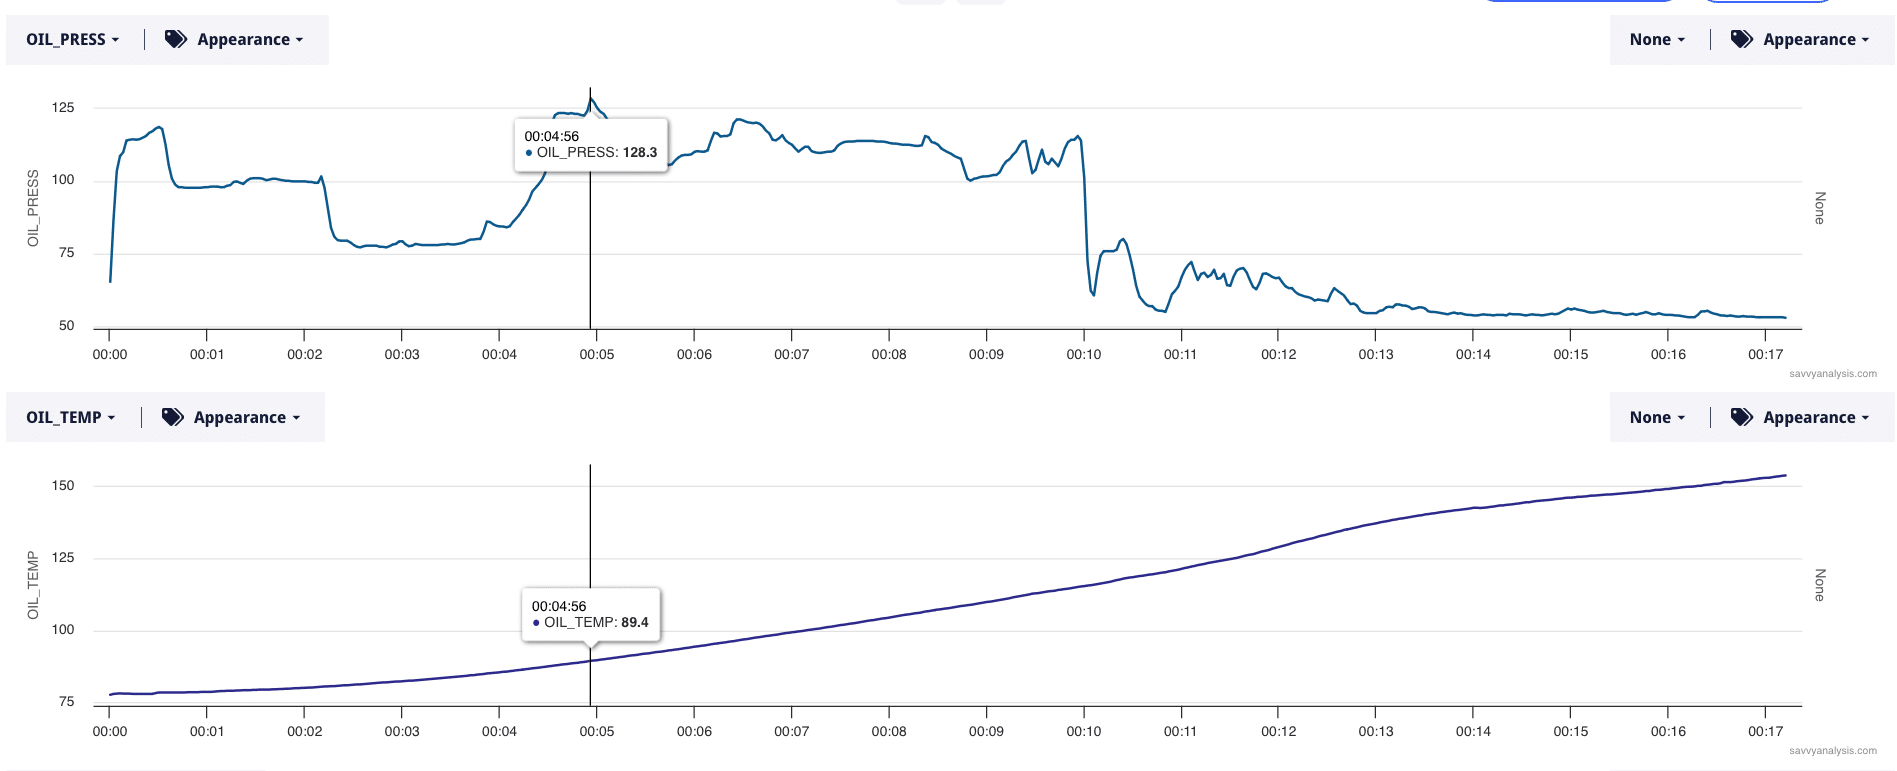
Temp looks normal but pressure is a mess. Starts out with a bang, drops to a level still way above normal, then normal. then back into scary land. I didn’t depict RPMs, but the contour follows the FF trace – meaning that the moves in oil pressure loosely correlate to the power setting adjustments. So it’s tracking, It’s just that the 80-120 psi range is not something you’d rather not take into the air. It looks like the pilot came to the same conclusion and put the airplane back in the hangar.