As Savvy Analysis turns ten, I thought I would try and see if the data shows that more engine monitors and more data analysis over the last ten years contributed to fewer accidents attributed to mechanical failure. You would think so, right? Engine data should make it easier to recognize problems, and knowing what the problem is should impact the cost of fixing it – less shotgunning. I turned to the Nall Report which AOPA publishes annually and updates frequently. Nall Reports are archived here.
Using data for non-commercial fixed-wing, the number of accidents fell from 1154 in 2012 to 892 in 2020 (the most recent year available). 334 fatalities in 2012 vs 273 in 2020. So that’s a good trend line, although you could argue that COVID had a big impact on data from 2020. Trying to answer my question, in 2012 there were 156 accidents attributed to mechanical issues. Of those, 55 were powerplant issues, with 1 fatality in that 55. In 2020 , there were 153 accidents attributed to mechanical issues. Of those, 77 were powerplant issues, with 10 fatalities in that 77.
I don’t want to jump to conclusions based on two data points, and anecdotally we know that clients are happy when data reveals an issue on the ground instead of in the air. And there’s no telling how many of those 153 accidents were equipped with engine monitors logging data for analysis. Maybe none of them. The accident rate is down, and fatalities are down, and we should all be happy for that.
Let’s start this month with data from a Cirrus SR22 powered by a Continental IO-550 TN and data from a Avidyne Entegra with a 6 sec sample rate. EGTs on top, then CHTs and FF below. Cursor is on the high point of CHT 4 at 500º.
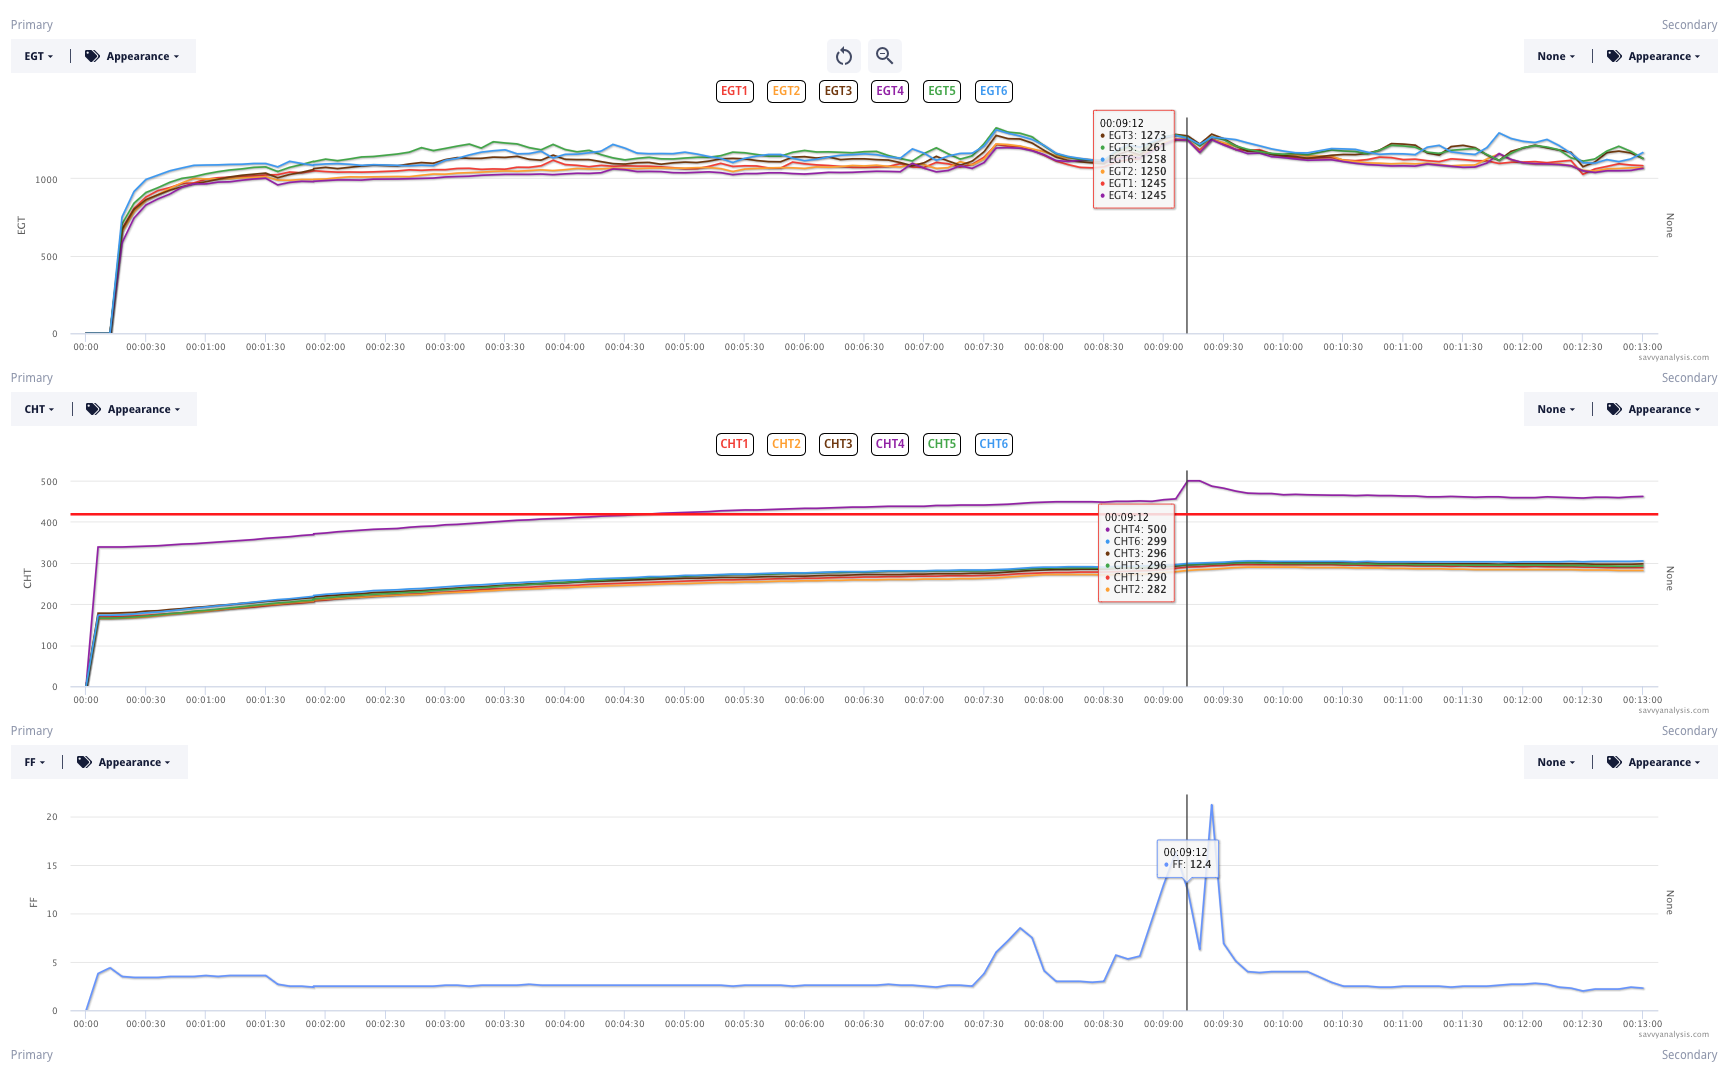
This is a flight that never happened. The pilot taxis to the runup area, performs the runup, then taxis back to the hangar. We don’t know at which point he noticed that CHT 4 was a problem. If he noticed that it was high right off the bat, maybe he thought it would resolve itself in the runup. Or maybe he was focused on safely taxing to the runup area, and only noticed the alert when he got there.
The downside of having a lot of data available is I have developed a bad habit of glancing over to the engine monitor as I’m taxiing. And taxiing really deserves undivided attention. So I’m trying a new system. I start the engine, and with my feet still on the brakes I review the engine data until I’m satisfied that either everything’s working properly, or there’s something that requires me to shut down and investigate. Then I try not to look at the monitor again until my feet are back on the brakes in the runup area. It’s not rocket science – it’s what I should’ve been doing all along. So, if you’re wagging your finger at me for my earlier bad habit, I deserve it.
No harm, no foul in taxiing this airplane over to the runup area and back with this faulty indication. And kudos to the pilot for not ignoring the failing sensor and taking off anyway. How are we so sure that it’s a sensor problem and not an actual problem with the cylinder? EGT 4 is normal, so no indication of unusual combustion with cyl 4. And CHT 4 is anomalous from its first sample 6 seconds after engine start. If there were a mechanical issue, you’d think it would take a little while to generate all that heat. One more thing – you can’t always count on this but cylinder 2 is downstream from 4 on this engine, and it’s not showing any evidence of excessive heat in the neighborhood.
One more point on this chart before we leave it. See how the red line – the HI CHT alert – is set for 420º ? We think the ideal setting is just above what’s normal for each airplane. If the number is too low, it flags everything. If the number is too high, it only flags catastrophic events. Neither of those is very helpful. You want it to flag data that’s out of the norm. If you want help determining what the best number is for your airplane, we’re happy to help.
Next is data from a Cessna 210 powered by a Continental IO-550 and data from a JPI 930 with a 1 sec sample rate. Nothing special about cursor placement – I just wanted it out of the way.
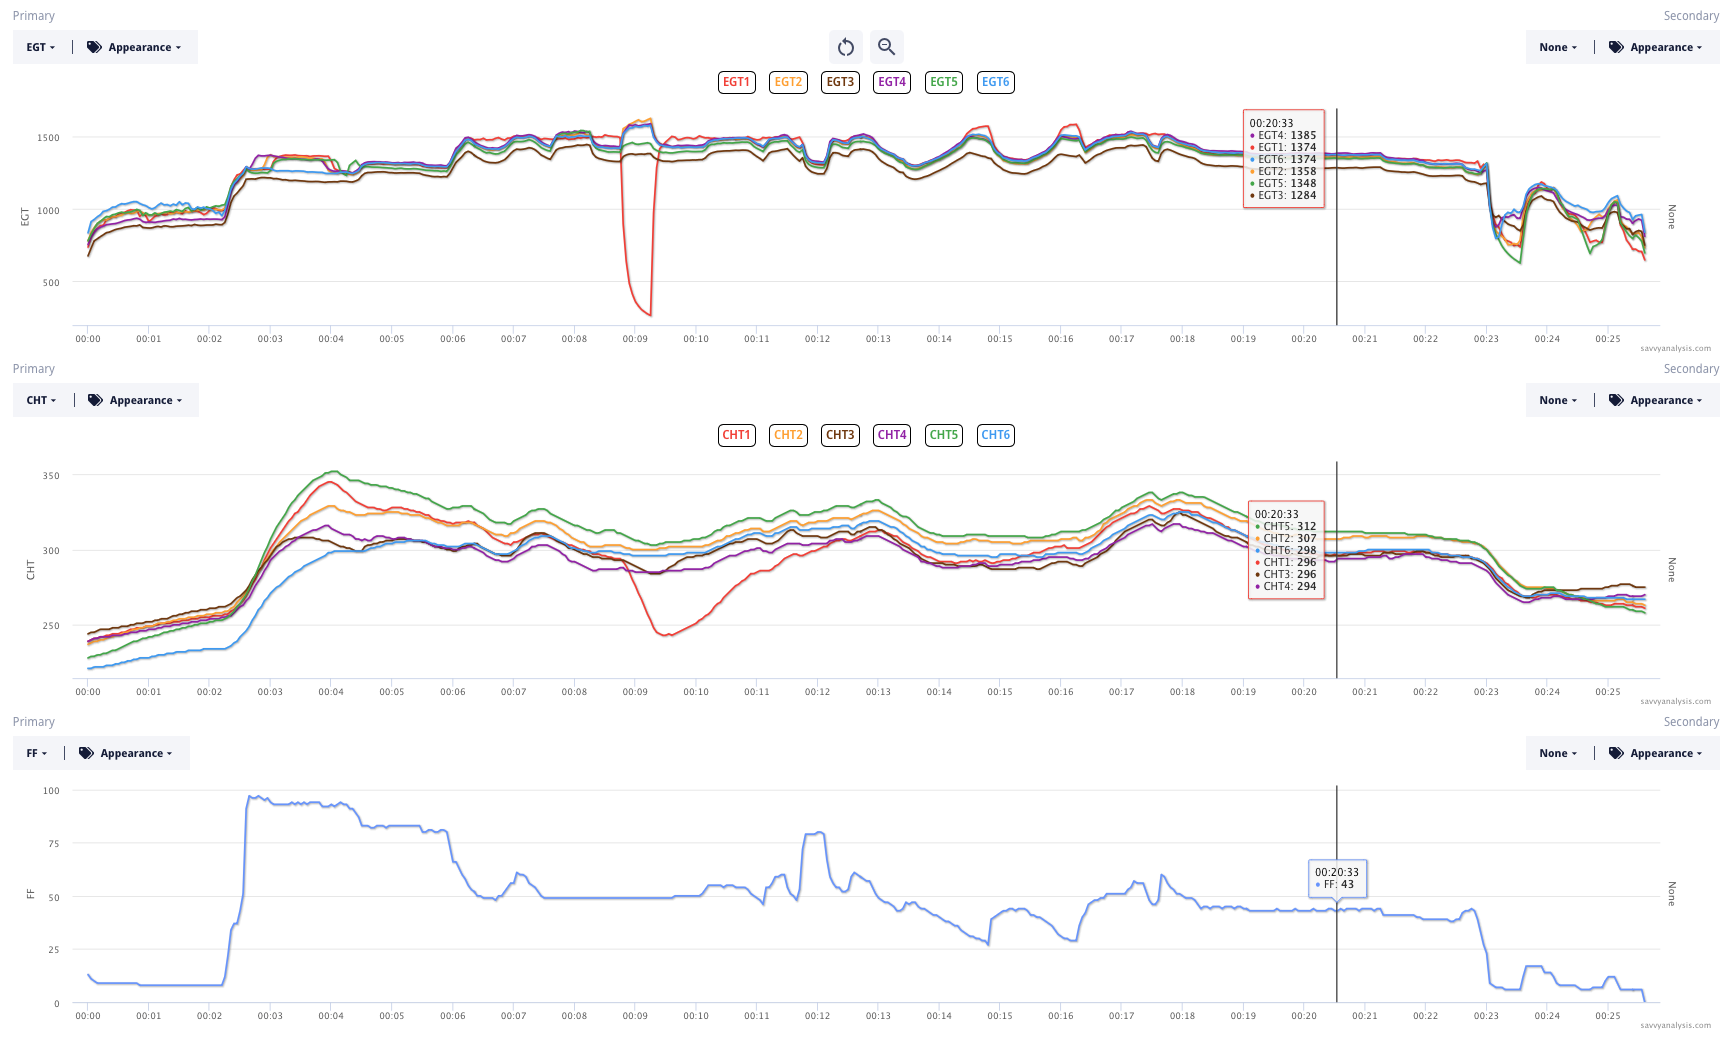
Before we zoom in, notice that EGTs are pretty uniform in the takeoff roll, then 4, 2, 1 and 5 all jump up when FF is reduced just a little. 3 and 6 don’t. EGT 1 had been a little wobbly during ground ops, and gets wobbly again around 5 mins. Btw, yes, takeoff is 2 mins after engine start.
Then when FF is reduced at the 6 min mark, EGT 1 stays high, even as others move. Let’s zoom in to EGTs only for that segment of the flight.
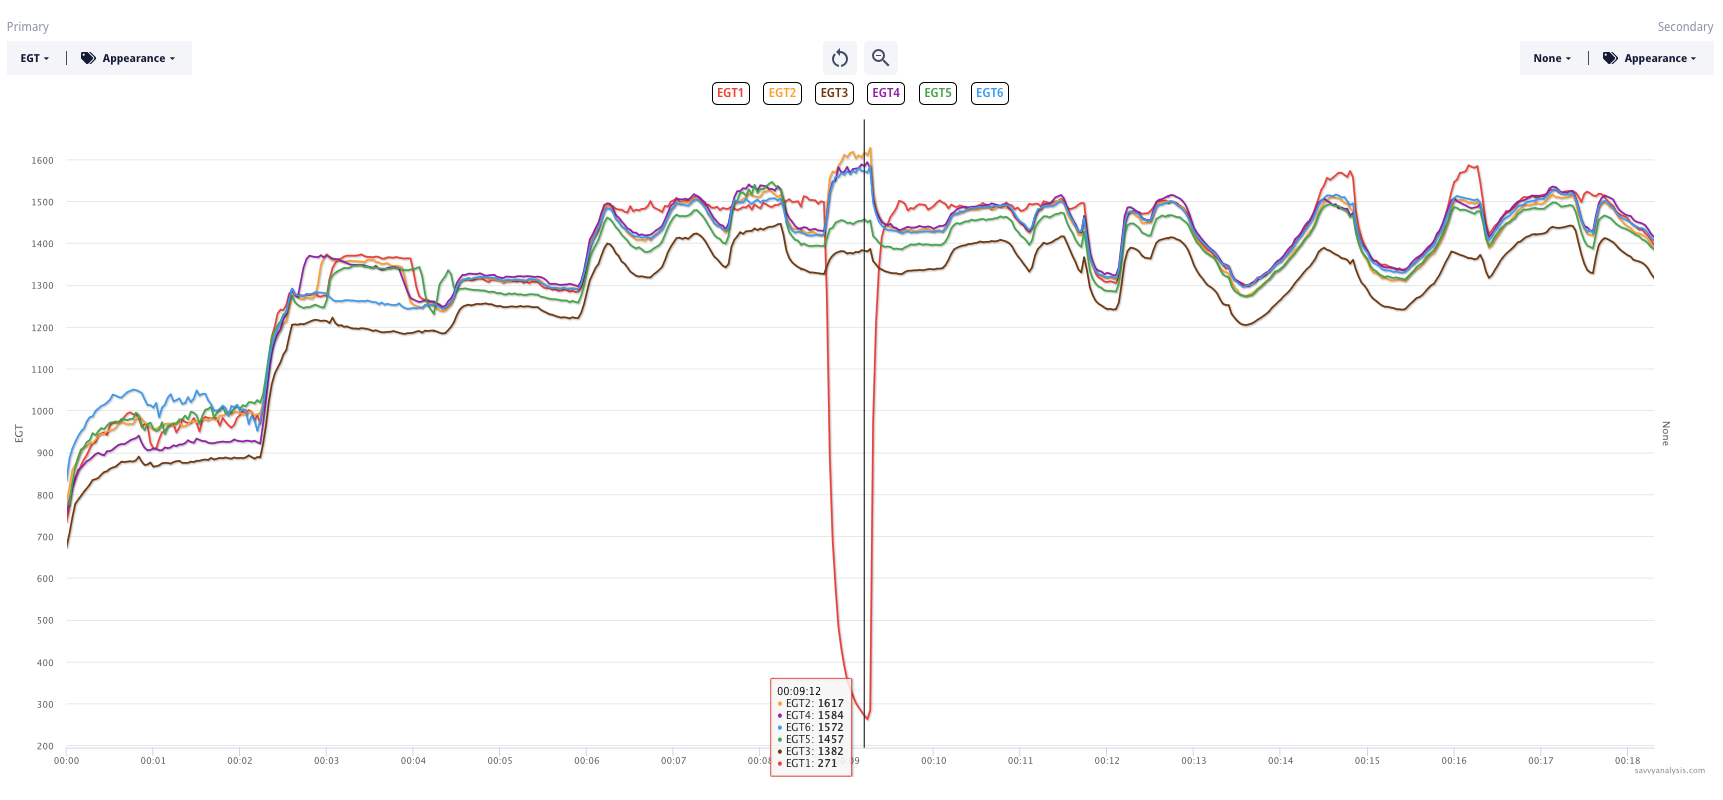
There’s a mag check and EGT 1 drops – about 1000º – corroborated by CHT 1. Let’s use the Mag tool to separate EGTs into odds and evens.
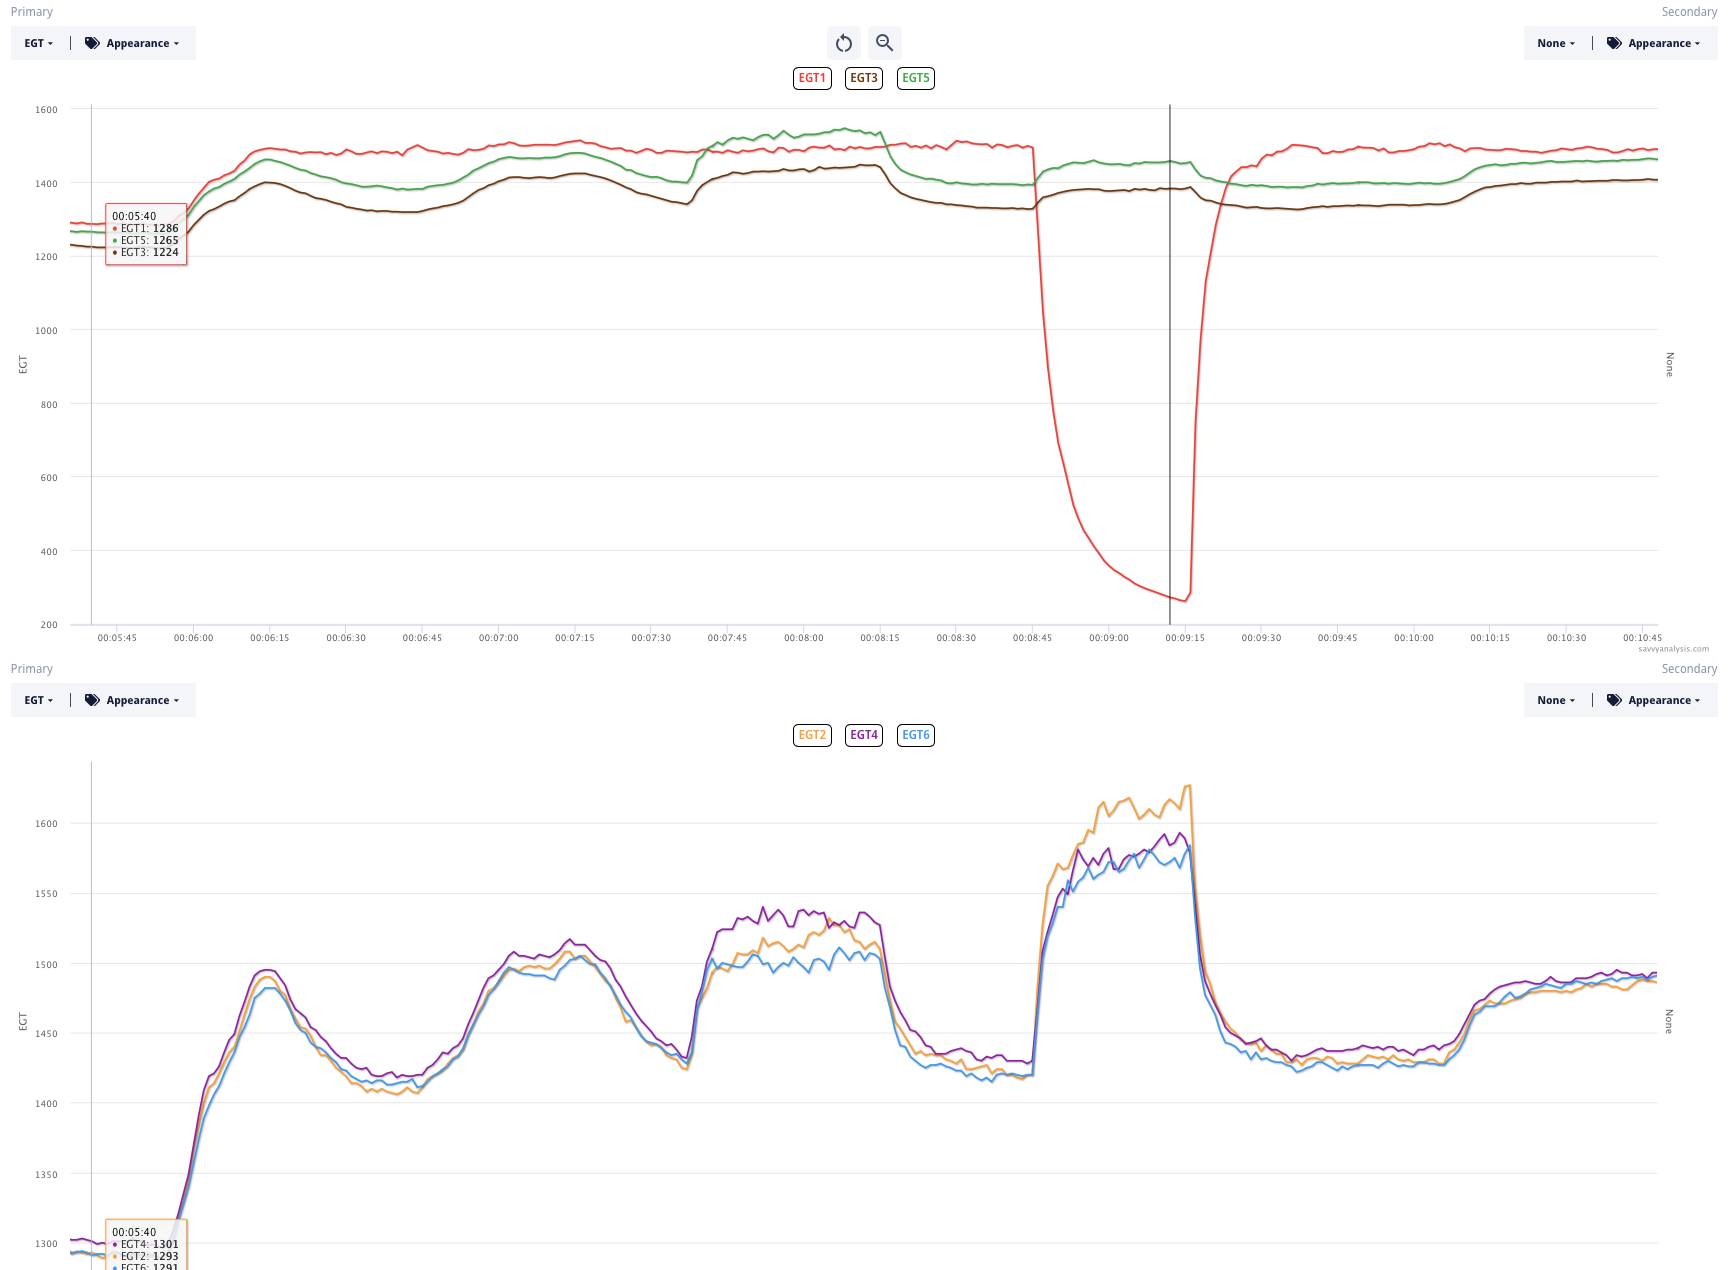
The second mag checked looks like the R mag, which fires the bottom plugs of 2-4-6. So the dead plug is the top plug of cyl 1. Looking back at the first chart. It looks like the pilot decided to leave the switch on “both”, because the other EGTs stay about where they were initially.
We’ll finish this month with data from a Beech Baron 55 powered by Continental IO-520 engines and data from a Garmin G1000 with a 1 sec sample rate. EGTs and CHTs for both engines.
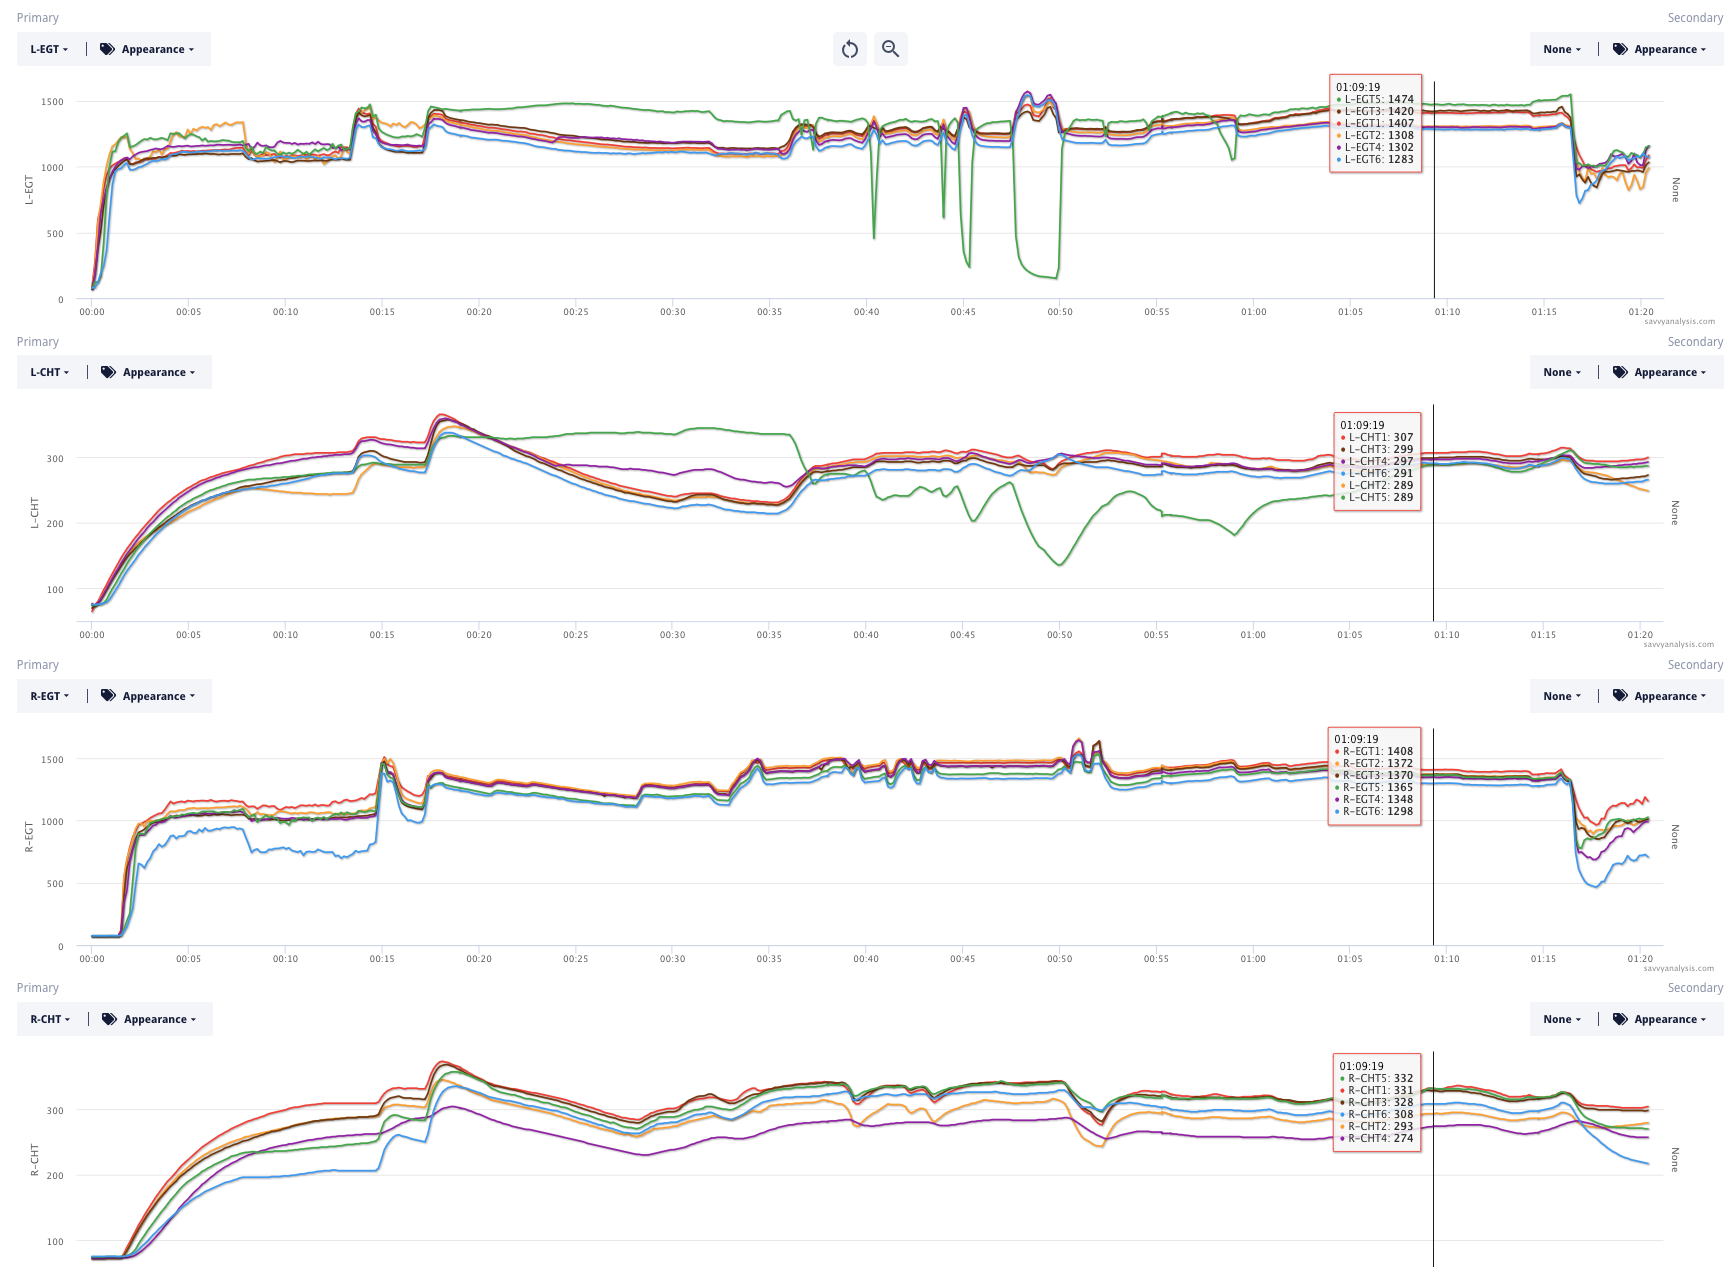
The issues are with the L engine so let’s look at EGTs, CHTs and FF for the L.
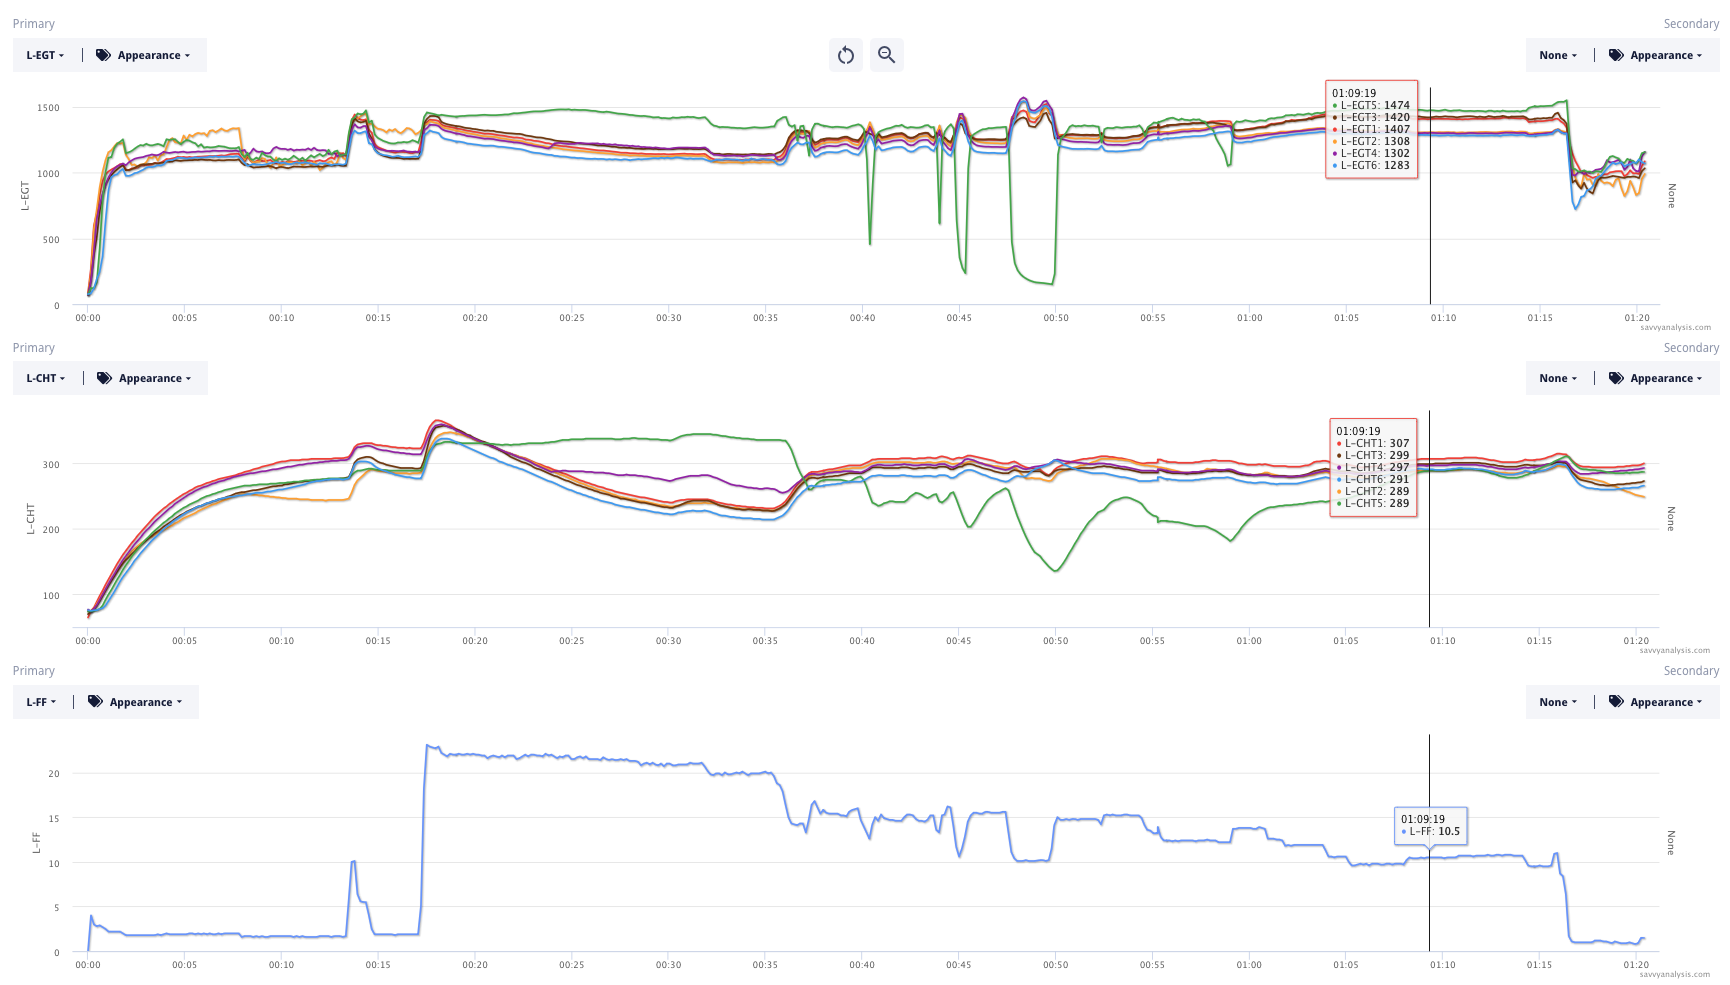
If you’re a frequent Puzzler reader, you know that one of the symptoms of a clogged injector is high EGT and CHT at max FF, then lower EGT’s and CHT’s when FF is reduced. That’s what we see here. And the clincher is that when mags are checked at the 48 min mark, cyl 5 shows a big drop on both mags.
