I just filled out my bracket for this month’s college basketball tournament. If you live outside the US, or you don’t follow sports, it’s an annual ritual where American sports fans try and guess which of 64 teams will win every game over the course of a few weeks. There’s always one upset of a favorite and there’s usually a small school that defies the odds. So while it’s remarkable how the teams with great coaches show up year after year, the bracket with all the favorites rarely wins. It’s the outliers that make it a challenge.
Someone said piloting an airplane is hours of boredom punctuated by moments of sheer terror. I don’t see how anybody who has a handful of airplane could be bored. If you’re VFR there’s so much to look at – and look for – and if you’re IFR and bored you’re dangerous. Terror is defined as extreme fear, and I’d argue most pilots log recurrent training and review emergency procedures so that we don’t fall victim to extreme fear when something bad happens. Sully, Jim Lovell, Al Haines – that’s why they’re heroes. If you’ve successfully handled an in-flight emergency that could have harmed you and your passengers, put yourself on that list.
Then I sat down to write about engine data and realized my monthly column is about the oddities, the outliers, the data that didn’t act as expected. It’s not quite “If it bleeds it leads” – it’s more like “Man bites dog”. So here’s this month’s data madness.
There will be a lot of three-point shots in the tournament, so in honor of that here’s a three-fer. This is data from a Bonanza A36 with a Continental IO-550-B and data from a JPI 930 with a 1 sec sample rate.
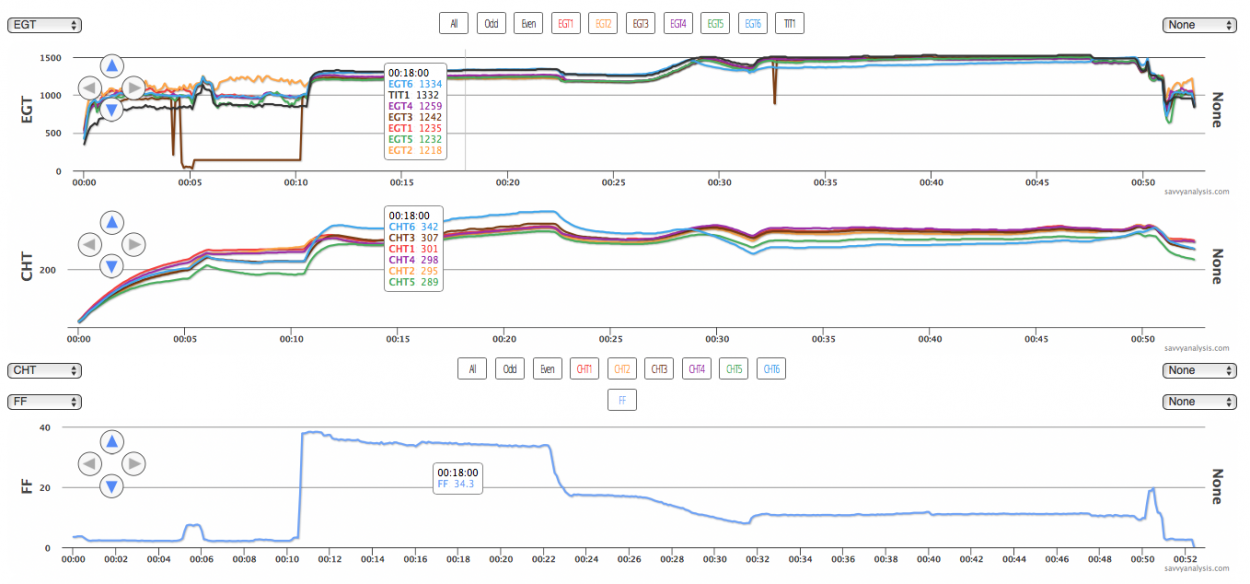
Here’s the same data zoomed in to show engine start and ground ops before takeoff.
The three issues are a wobbly EGT 2 – the orange trace, a less wobbly but not steady EGT 5 – the green trace, and a binary EGT 3 – the brown trace. Let’s take them one at a time. The pattern of EGT 2 suggests weak spark – probably a plug. A LOP mag check will usually unmask weak spark. In this runup mag check at the 5 min mark, that’s as good as EGT 2 looks in this whole segment. In fact, the orange trace is a little less wobbly after the mag check, although a little higher. Back to the first chart of the full flight, EGT 2 looks ok under power. This is a scenario where we’d like the LOP mag check and probably act or not depending on how that went.
Likewise EGT 5. It’s not as jumpy as cyl 2, but not as steady as the others. Continue to monitor, and monitor CHT 5 too, to see if it gets lower than it already is.
EGT 3 could be a failing probe or a loose connection. It always makes sense to check the connection before replacing the probe, and especially in this case. There’s a big drop just after the 4 min mark. Presumably the airplane’s taxiing to the runup area, or maybe just arrived there. Then normal EGT for a bit, then the big drop. But it doesn’t drop and flatline right away – it jumps around a little before it flatlines, for about 5 mins. Then, as suddenly as it dropped, it’s back in business like nothing ever happened. It’s that series of jumps after the big drop, the sudden return to normal before takeoff, and that rogue spike at the 32 min mark that suggests connection vs probe failure.
We’re not quite done with this data yet. Back to the first chart of the entire flight, and look at the rank of EGT and CHT 6 when FF is high, then again after FF is reduced. When EGT and CHT are high at max FF, then low – in this case lowest – at lower FF, that’s the textbook pattern from a partially clogged injector.
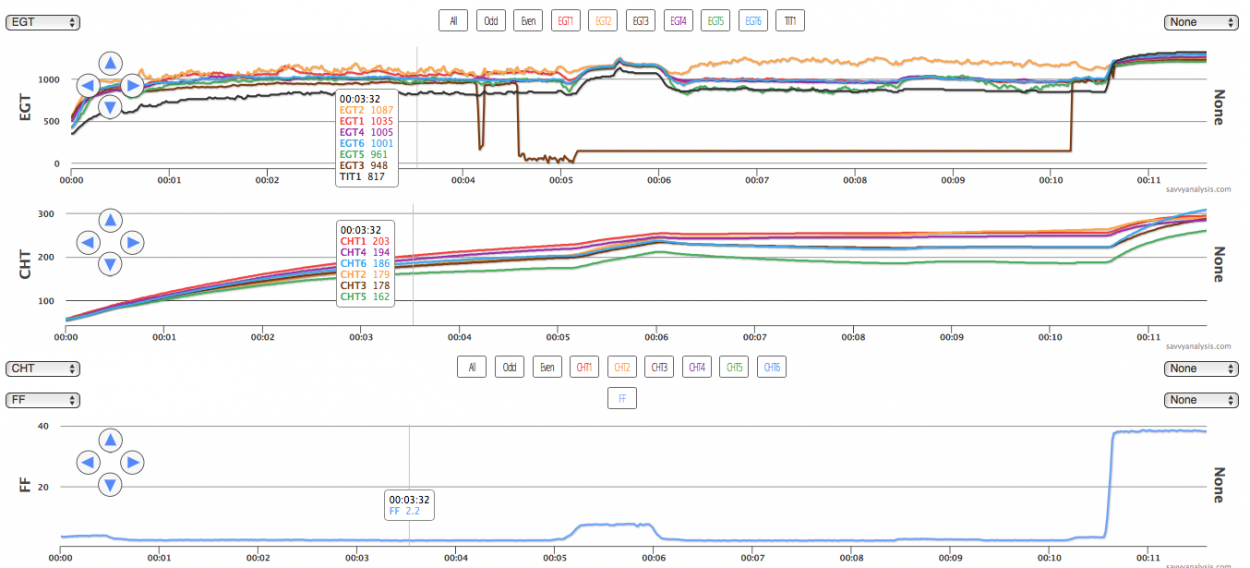
Next up is an RV-10 with a Lycoming AEIO-540 with data from a Garmin G900X with a 1 sec sample rate. This analysis request reported an engine stumble on climb out. Here’s the entire flight. EGTs on top, CHTs below and the bold blue line is fuel flow.
And here’s the same data zoomed into the climb out, again EGTs on top, CHTs below with FF overlaid.
As we saw above, a cylinder running lean because of a partially clogged injector will allow enough fuel flow to cause EGT and CHT to be high at max FF, then both will drop when FF is reduced after climb. A very clogged injector could restrict FF enough to cause EGT and CHT to run low even at max FF, which is what we see in the data for cyl 1 – the red traces.
When FF is reduced a little during the climb, at the 7 min mark, EGT 1 drops, then recovers – but EGT and CHT 1 still stay low in cruise. Then, looking back to the entire flight, EGT 1 climbs – changes rank – where FF is reduced for approach, at the cursor. Looking closely, EGT 2 also climbs there, and EGT drops more than the others at the 41 min mark at idle fuel flow.
So it’s not a “textbook” injector clog, but something caused the stumble and – as the lawyers say – the preponderance of the evidence points to cyl 1. Why do we not suspect poor spark? Because typically poor spark will cause EGT to rise and typically poor spark will become poorer when FF is reduced.
As Mike Busch likes to say, injectors live in a world of solvent, but injector clogs can also be caused by a small piece of debris, like a little blob of RTV, and that little piece of schmutz can move around as it reacts to the fuel around it. That’s what the data suggests.
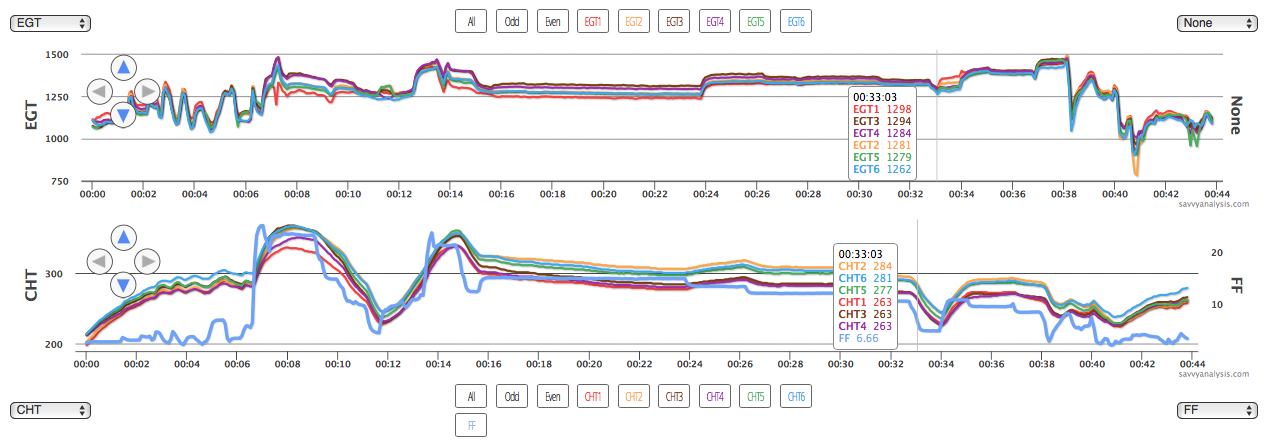
Next up is data from a different Bonanza A36 with a Continental IO-550-B and data from a JPI 830 with a 4 sec sample rate. EGTs on top, CHTs below with RPM overlaid – the green trace – and FF below that.
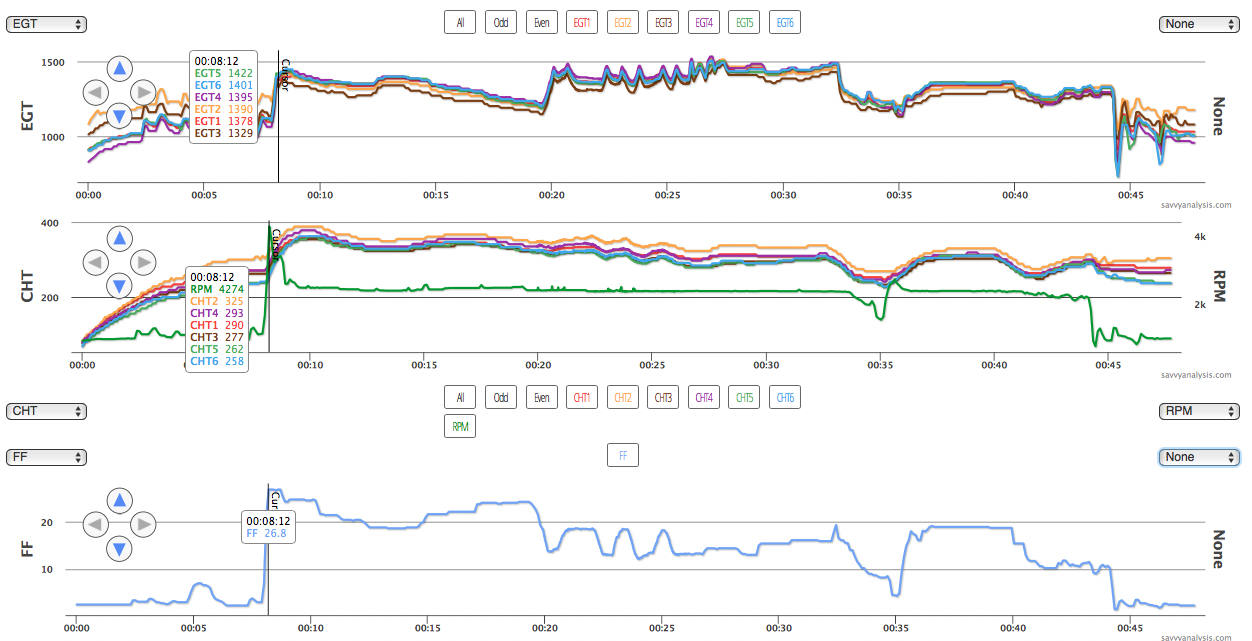
RPMs start out about 900, jump to 1600 for the runup (that’s hidden by the number block), but peak RPMs indicate 4274, vs the redline of 2700. That’s only one sample, then the RPMs drop into the high 2600s until the pilot dials back during the climb. Looking closely, you can see little intermittent spikes in the RPM trace in cruise.
We didn’t believe that RPMs really got to 4274, but the data is pretty steady except for the little spikes, and it’s hard to make a case for a loose connection. Oil pressure is not logged, but oil temp looked normal. So we wondered if the connection were just loose enough to cause that one big spike at takeoff, and then that series of little spikes later on.
That’s when we turned to AirNav. Revealing the takeoff airport here would violate our privacy protocol, but it doesn’t violate our policy to tell you that AirNav listed the runway condition as “fair”. So we suspect that the big spike was a result of a bumpy runway and a slightly loose connection.
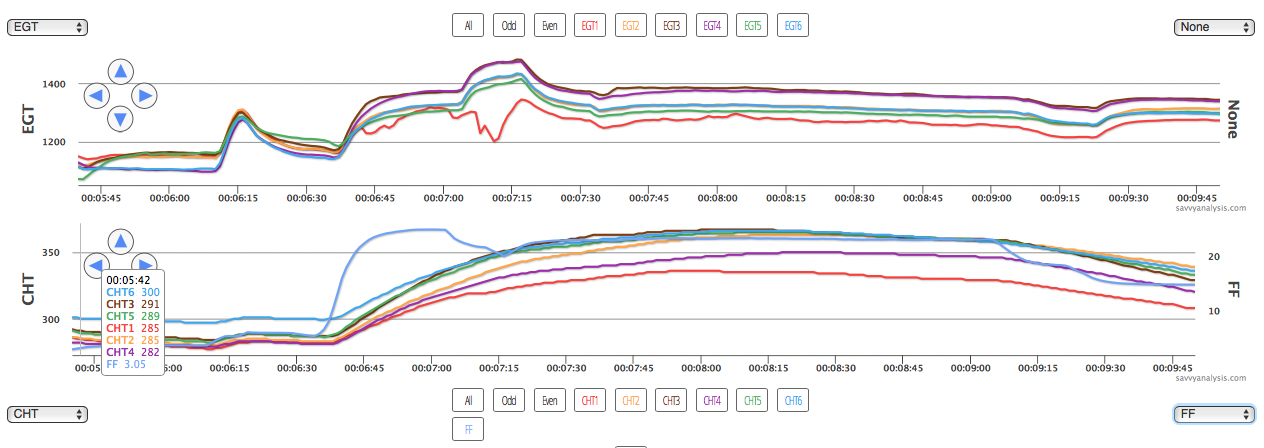
Next is data from a Cirrus SR22 with a Continental IO-550-N and the Tornado Alley turbo. Data is from a Garmin Perspective with a 1 sec sample rate. The client noted slightly rough running as he climbed out, then it got rougher as he leaned. Fortunately, he performed a LOP mag check in flight.
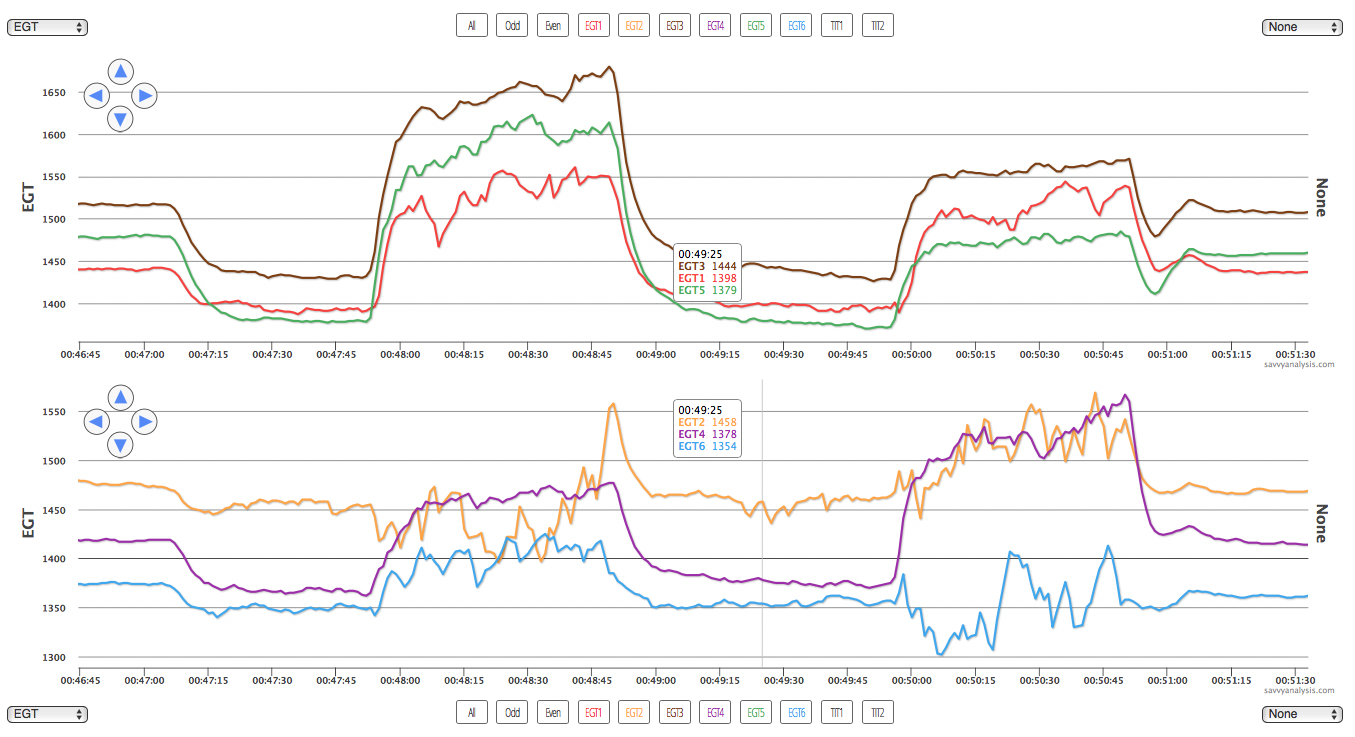
On this engine, the L mag fires the bottom plugs of 1-3-5 and the top plugs of 2-4-6. We expect the bottom plugs to show a higher EGT than the top plugs. On this check we’d say the brown trace, the green trace and the purple trace are as expected. The bottom plug of cyl 1 – the red trace on the left side of the chart, the bottom plug of cyl 6 – the blue trace on the right side of the chart, and both orange traces of cyl 2 all show misfires. The top plug of cyl 2 – orange on the left – is worst.
The shop that cleaned the plugs noticed something extra – the top plug of cyl 2 came out a little too easy. It had not been torqued to spec. It was surprising to us that it performed as well as it did until this LOP mag check.
