Franklin P. Jones, a Philadelphia reporter, said that experience is what allows us to recognize a mistake when we make it again. That’s a mildly cynical approach, and the true value of experience should be to recognize the pattern that led to the previous mistake, remember the outcome, and avoid making that mistake again.
Applied to engine data analysis, it’s comforting to recognize a pattern and feel confident in recommending a solution – like cleaning an injector or inspecting a spark plug – then to hear back from our client that the recommendation solved the problem. It’s less comforting to see something that we haven’t seen before and I thought I would devote this Puzzler to those.
And as we’ll see later, patterns aren’t confined to squiggly lines on a computer. The sound of the engine, vibrations in the yoke or stick, and carbon or oil on the spark plugs can all be clues in recognizing a pattern.
Let’s start with data from a Piper Arrow III with a Lycoming IO-360. Data is from a JPI 830 with a 2 sec sample rate. The top display shows oil temp – the light blue trace – and oil pressure – the yellow trace. The bottom display is fuel flow (FF) – the blue trace – and Altitude – the red trace. The cursor is on the substantial drop in oil temp about halfway through the flight.
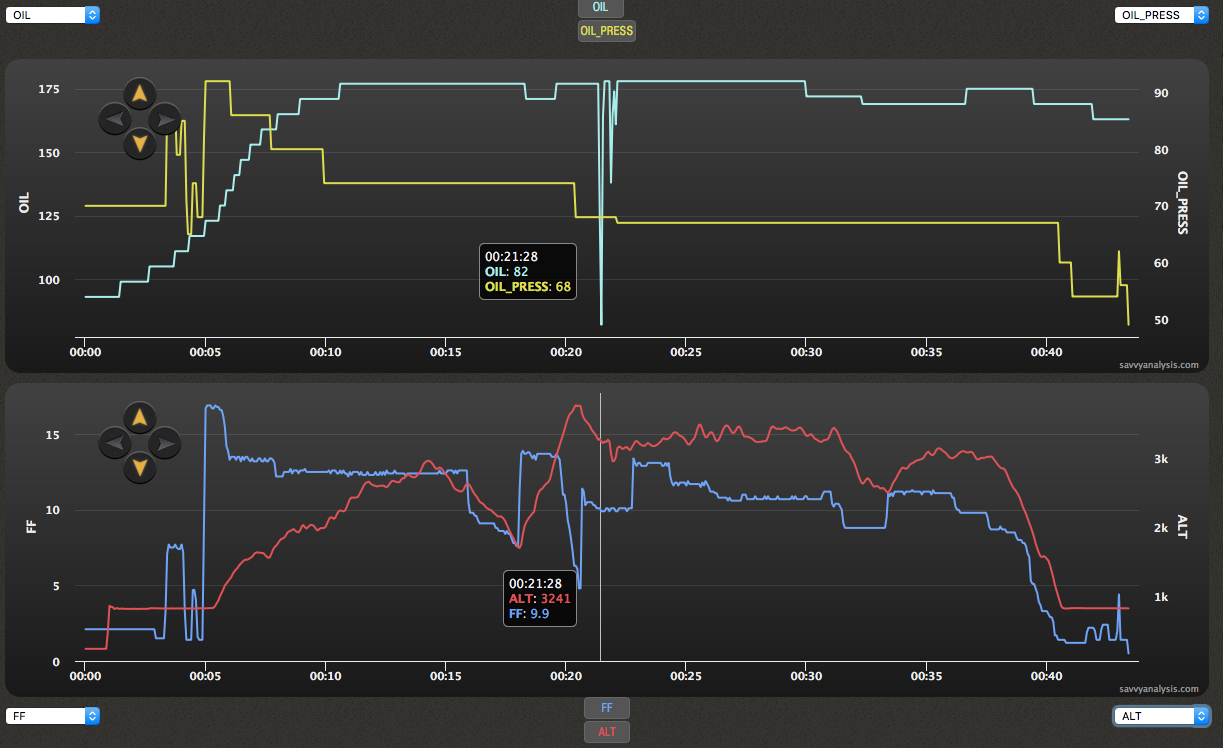
The scenario is a 45 minute flight and the pilot reported that there were some steep turns during the flight – which was a BFR or hood work or some sort of training flight. Notice that just before the oil temp drop, there’s a climb of about 2,000 feet, with an accompanying drop in FF. Is that a clue or a head fake?
Aside from the big drop, the oil temp data looks stable – stable enough to trust that the sensor didn’t fail at that point then become reliable again. Pressure doesn’t change there. If it did, it would validate the spike in temp, although steady pressure by itself doesn’t necessarily invalidate the temp spike.
When we heard about steep turns we fashioned a theory that the oil level was low enough to allow the temp probe on the side of the oil pan to lose contact with the oil for one sample. Except the oil temp sensor is not on the side, it’s in the center. Then we overlaid altitude, as you see here, and since the airplane is nose-down at this point, but we don’t have data for the bank angle, our theory is that the oil sloshed away from the temp sensor for one sample, then sloshed enough for two more smaller readings, then settled down again as the angle of attack stabilized.
It’s an interesting set of facts and having thought it through once we think we’ll be able to recognize the pattern again if we see it.
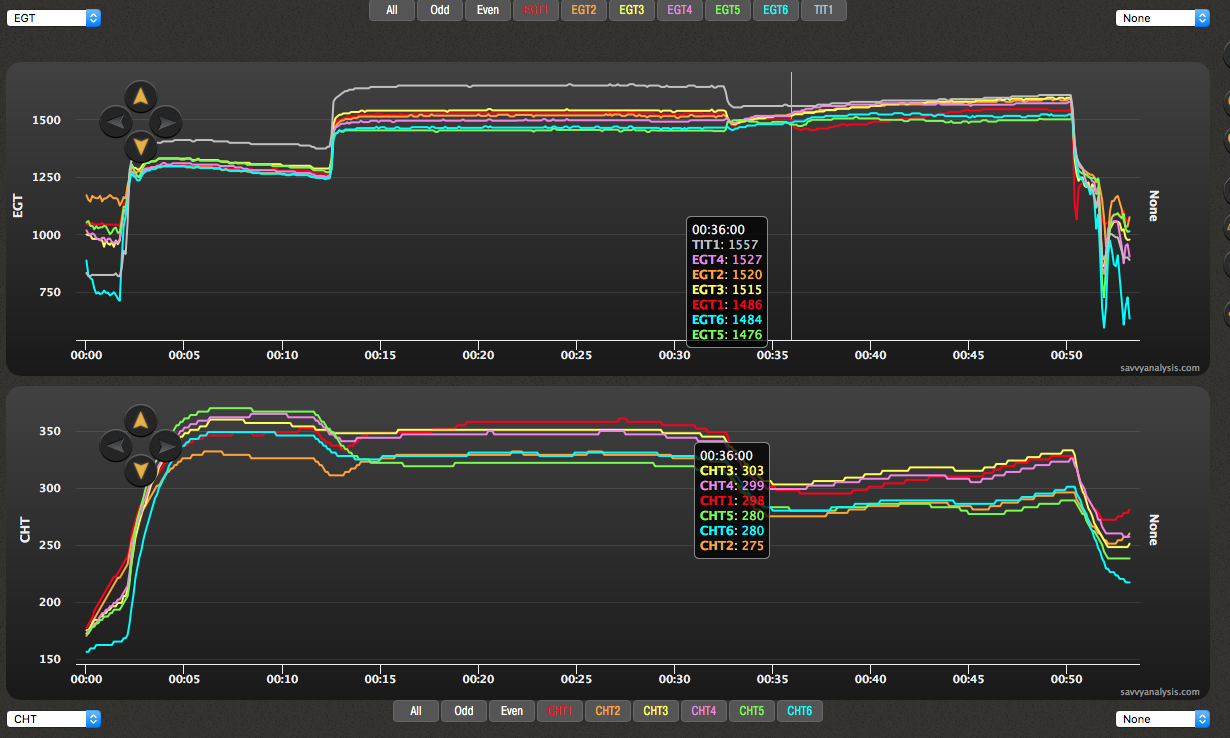
Next up is a flight from a Cirrus SR22T with a Continental TSIO-550-K. EGTs are on top and CHTs on bottom.

We’ve seen enough CHT probe failures to fall into the Franklin P. Jones trap of concluding that’s what we’re seeing here in the cyan trace of cylinder 6. There are some near-vertical spikes here and aluminum can’t immediately change temperatures like that. Except that EGT 6 is also ragged, and the chances of both probes failing is lottery-like. Cirrus data passes through the firewall via a plastic connector, so it’s reasonable to think that both probes for cyl 6 are on the same connector – and that’s what’s causing the fluctuations. The data for EGT and CHT is not as erratic during ground ops, so it’s also reasonable to think that something’s loose and the vibration of flight aggravates it.
All of which makes perfect sense until the pilot reported roughness. You don’t get roughness from a bad connection.
Can it be fuel? We’d expect a steady high EGT and CHT when rich of peak and lower readings when lean of peak – not seeing that here. Can it be cooling? Unlikely that you’d see such a dramatic effect on only one cylinder and nothing strange with the neighbors. Can it be mags? Again, unlikely that it would be confined to one cylinder. Can it be a spark plug?
That was our best guess and inspection revealed that gaps were wider on one of the plugs of cyl 6. That makes sense of the EGT 6 data, and we’re still grappling with how weak spark on one plug would cause those spikes in CHT 6 – in the absence of pre-ignition or detonation.
Once again, interesting facts which may eventually become a familiar pattern.
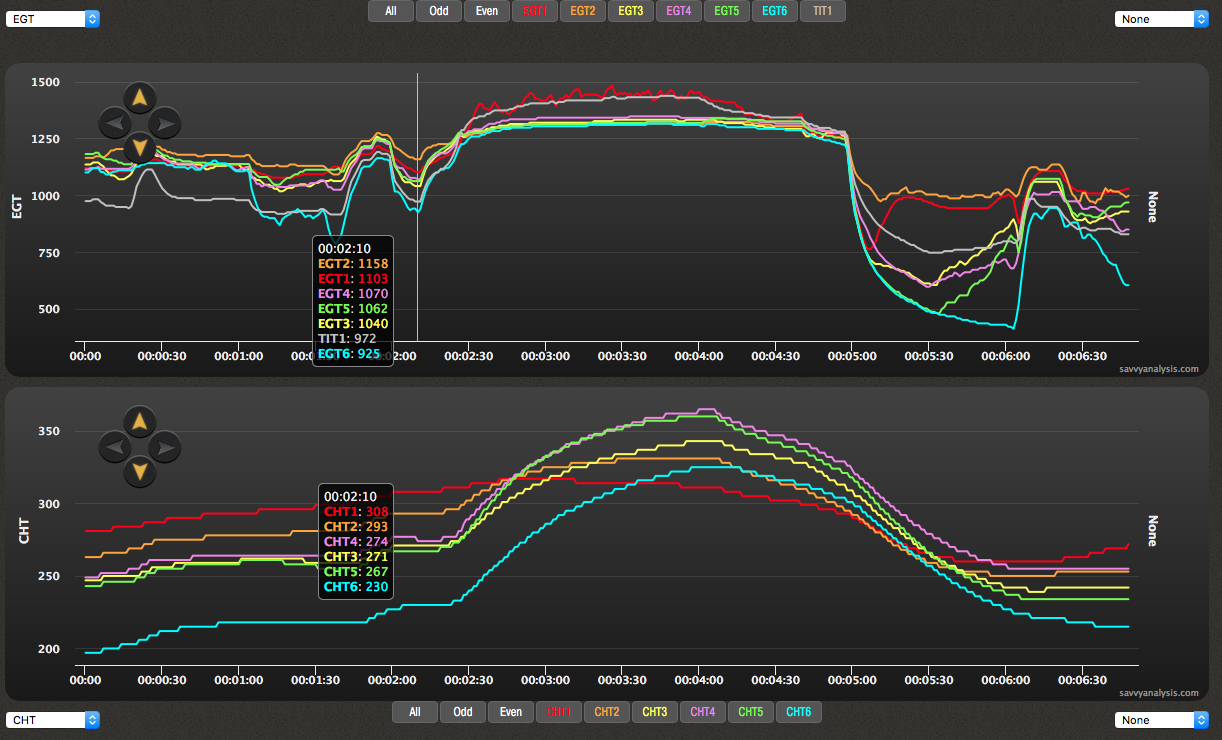
Next up is data submitted by Tim Walter and his Beech Bonanza A36TC with a Continental TSIO-520-B.
Let’s start on the left with cylinder 5 – the green traces. High EGT and CHT at takeoff, lower after the big mixture pull suggest a partially clogged injector. Not really enough to be an outlier or cause roughness, but something to check at the next scheduled maintenance – or sooner it if gets worse. But that’s not why Tim sent this data. Nor is the low CHT 2 in climb.
Just to the right of the cursor, EGT and CHT 1 – the red traces – dip, then begin a slow rise. All CHTs rise there, so nothing abnormal. EGT 1 does rise by itself, but the pattern isn’t one that leaps off the page.
Let’s look at the subsequent flight.
Tim picks up the story from here:
Startup was normal, idle was normal and smooth. Run up and mag check was normal. There was no indication on the engine monitor of a problem. I use the normalize mode on the engine monitor to watch the EGTs rise and fall, now I’m rethinking that because EGT1 might have shown hotter than the others.
Starting the roll was normal and I got to takeoff speed as normal, only after lift off was there any indication that something was wrong. Climb was anemic and there was an unusual vibration, it was not a hard vibration, I thought it was an unbalanced tire or something, but it remained after putting up the gear. And I was definitely not climbing as expected, so immediately returned for landing.
It was a hot day, and the vibration was weird but not hard, I did a full inspection of the aircraft, found nothing out of place, no oil leaks nothing loose etc. I spent a good long time checking everything under the cowl, rechecked fuel drains etc. I had just taken on 47 gals from the fuel truck and wondered if hot fuel was causing vaporization? Anyway, I decided to try one more run around the pattern, after another run up and nothing showing a problem, again I rolled and it was all perfect right until after lift off, then same thing, slight vibration and anemic climb, so immediate return and landing. That’s when I downloaded the engine data to take home to upload to savvy analysis.
My next mistake was that when I saw the high EGT#1 I thought it must be a plug or maybe a mag, or partial blocked injector. I was thinking that the previous flight was perfectly normal, so what would fail the next day just like that? I had my mechanic clean the injector and check the plugs and have a good look all around. The plugs did show carbon deposits, which we did not expect, I always run LOP and usually my plugs are clean as a whistle. So they were cleaned, everything inspected in great detail, borescope showed no problems etc.
So once again out for a run up, everything looked fine, and this time I used the regular (not normalized) mode on the monitor and EGT1 showed fine. So after a lot of checking and being sure, I did one more take off. Same performance problem, same vibration.
This was the first time my mechanic had heard my take off and on landing he immediately said it sounded like a valve problem just from the sound of the engine. So he started to look at that, and that quickly led to a failed lifter. The lifter had seized such that the cam/pushrod would not fully open the exhaust valve, but must have been opening it slightly.
You can see in the engine download how blow back from #1 through the intake is also affecting #3. We don’t know why the lifter seized, there was plenty of oil in the engine and all over the lifter as it came out.
So, hopefully this helps someone else catch a problem in their engine, or at the very least gives you some more data points for your own research.
Thank you, Tim. We like your suggestion to switch to normalize to help with leaning and otherwise use regular mode for EGTs.
Obviously we’re big fans of data analysis, but can’t help but note that part of your diagnosis was your mechanic listening to your engine at takeoff and the carbon deposits on your plugs.
It’s probably true that not all lifters fail exactly the same way, but knowing the symptoms of your lifter failure will help Savvy analysts, and those who use our free analysis tools, to recognize this pattern if they see it.
