I’ve been looking at stock charts for a long time. I mean a REALLY long time – like before the Internet when they came in big bound books. I’ve also been reading music for a long time. So when the concept of engine data analysis came along, I found the concept familiar. In music, you find the prettiest notes in the middle of the instrument’s range. High notes, low notes and giant skips in pitch tend to stick out. The veteran stock chart watchers look for things like double bottoms, triple tops, breakouts, volume surges, price gaps, and compare that with everyday ordinary behavior. So what does any of this have to do with this month’s puzzler? Patterns and expectations. With engine data analysis, there are patterns we expect to see and when they’re not there we have to figure out why. What matters to a stock trader is not what the fundamentals say is supposed to happen to the price, but what buyers and sellers do with their money – and that’s what you see in the chart. In studying an orchestral score you look for melody, harmony, counterpoint and dynamics to determine what the sound will be. With engine data, we look at what we expect the engine to do, compared with what it’s really doing.
Clear Prop
When you yell “clear prop” and turn the key, we expect a pattern from EGT and CHT. Both should start out at about ambient temperature and begin climbing soon after engine start. It doesn’t take long for the gas measured by EGT probes to get to about 1,000º F, and it takes longer for the air around the metal measured by CHT probes to get into the 200-300º range. Let’s take a look at some startups that didn’t meet expectations.

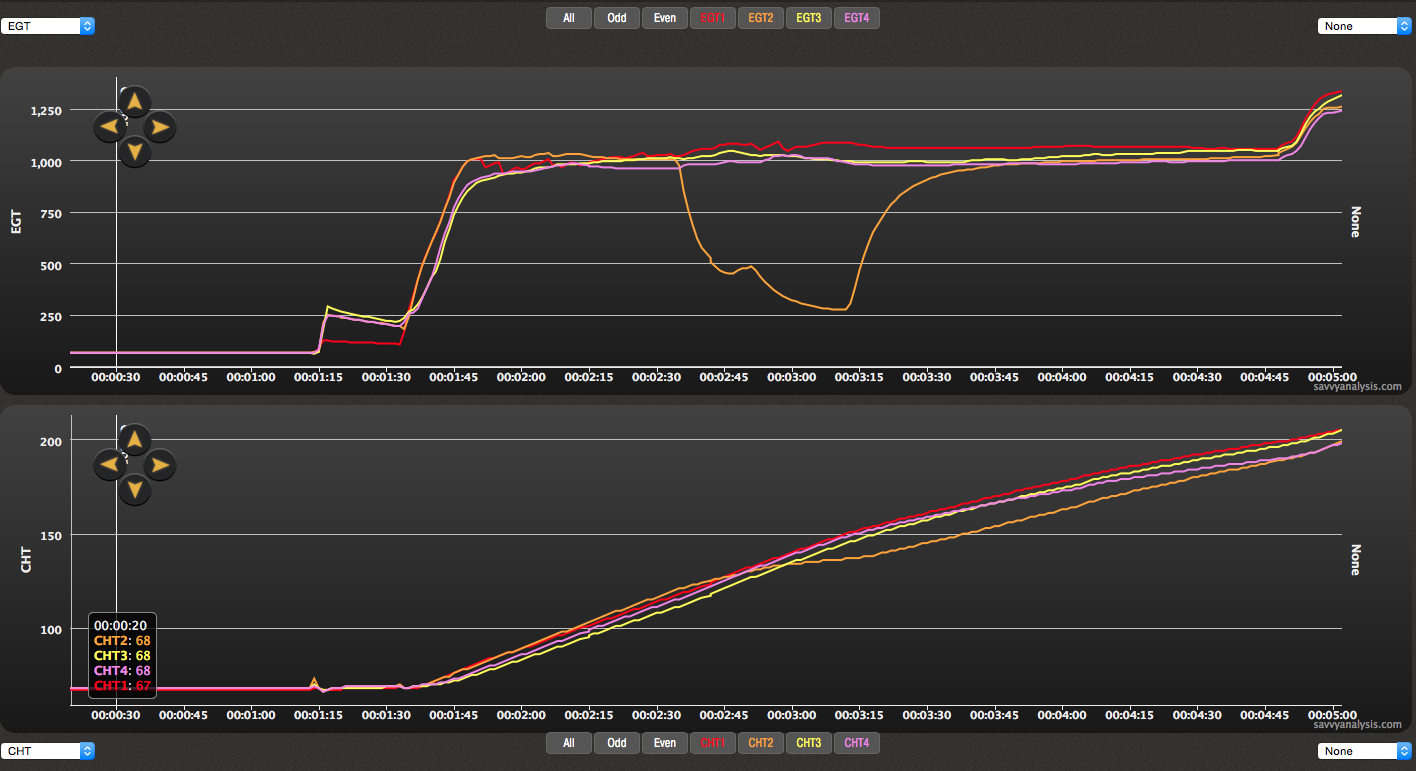

These screenshots are from a Lycoming IO-360 with a one second sample rate. The timespan of the three flights is about a month. What is happening with the EGT traces just after startup? Let’s look at options and try and solve the puzzle. Could it be a failing EGT probe or loose connection? Doubtful, because in each case CHT drops, too. CHT drop is not as dramatic because of the thermal mass of the cylinder, but there is corroboration. Bad injector? EGT and CHT moving in concert is a characteristic of a clog. Clogs in two different cylinders over that short of a time? Possible, not likely. Bad plug? A bad plug could cause less efficient combustion, which might explain the lower CHT, but the slower combustion caused by a failed plug usually causes EGT to rise, not fall. Bad Mag? Then why only one cylinder? Let’s pull back for a moment. In this new science of engine data analysis, we’ve found some patterns that are pretty dependable. We know that because we’ve seen it before, and subsequent inspection verified that it was what we thought it was. Each time that happens we gather a little more faith in the reliability of the pattern. You’ve heard us talk about FEVA – the signature EGT pattern of a failing valve. FEVA is good at spotting the oscillation of a the hot spot on an exhaust valve as it turns in the guide, but it can’t spot the pattern if the valve doesn’t turn. So with FEVA we’ve been asking clients who received alerts to share the results of the inspection with us, so we can perfect the algorithm.
Detective Work
And then, sometimes we see a pattern we haven’t seen before, like this one. What you’re not seeing in these screenshots is that during flight, and even during the LOP mag check, the EGT acted normally – just in case you were wondering. It’s also worth noting that the EGT excursion lasts about a minute in each case. The 1 sec sample rate gives us lots of good data points – a 6 sec sample rate would give us a different pattern. Could this be a sticking valve? Our thinking on that was that a sticking valve would show meaningful EGT because it was getting fuel and spark, but lower CHT because of the lower compression. We know – because our client told us – that this was a sticking valve. It happened on two different cylinders, was verified with a compression check and an audible “click” while turning the prop, and seemed to be caused when the oil was changed from one brand to another. When the oil was changed back to the first brand the sticking went away. That’s something the data – by itself – would never suggest. It’s rewarding when this new science helps a client fly more safely or spend maintenance money more efficiently. It’s frustrating when there is no clear answer, and we have to straddle the line between good detective work and speculation. Because mixture distribution is less consistent at idle mixtures, we see a variety of EGT patterns during ground ops. Now that we have a new pattern to look for, we’ll be looking. Gradually, we’re adding to our knowledge base of what patterns can tell us.
