How can rational numbers be so irrational? Actually, upon examination what we discover is that there’s usually a perfectly logical explanation for why an engine parameter is displaying its pattern. Even the impossible jumps from a failing probe have a logical explanation behind them. Of course, that’s easy to say from the quiet comfort of an FBO, or your sofa at home – it’s another thing when you’re looking at the data in real time with a handful of airplane. Hopefully working through these Puzzlers can help you separate real anomalies from – let’s call it “fake news.” Let’s put our brains to work on some of this month’s puzzling data.
First up is data from a Cirrus SR-22 with a normally aspirated Continental IO-550-N. Data is from an Avidyne with a 6 sec sample rate.
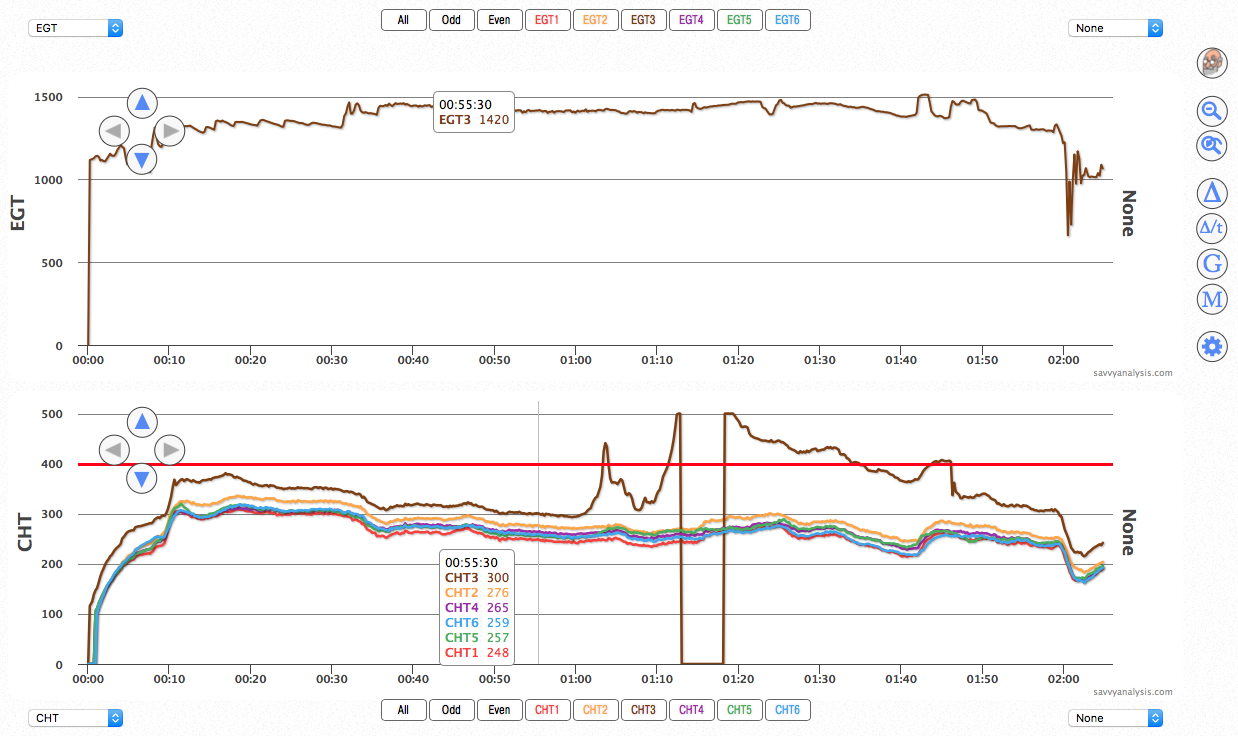
All EGTs were logged, but I isolated EGT 3 so it would be easier to track along with CHT 3. Let’s stipulate that EGT 3 tracks normally with other EGTs and is right in the middle of the pack throughout the flight. The higher numbers for CHT 3 happen not long after engine start, and its heat profile is different from its neighbors – about 50º hotter than the rest at takeoff, but still under 400º. Based on that higher CHT, and with normal EGT 3, your decision to come back and land versus press on probably depends on weather, and the importance of the trip and lots of other variables. But it has your attention.
At about the 20 min mark you level off and CHT 3 is high, but behaving. EGT 3 is still normal. I moved the cursor to the left of the anomaly so the pop-up box didn’t obscure the pattern. Just after the one-hour mark, CHT 3 starts an almost-vertical rise, only to peak, fall and rise again – and this time it defies the laws of thermodynamics. The pattern looks like an upside-down Pi- with a tail. At this point you should pretty much ignore anything CHT 3 has to say.
In the EGT 3 trace, you can see a couple of moves that suggest the pilot was changing power and fuel flow to get CHT 3 to act rationally, but it continues to track high until shutdown.
We’re not ready to make an assertion, but let’s just say it’s not surprising to see a CHT probe failure at about an hour into the flight. Time will tell if that’s a reliable pattern.
Next up is data from a Beech Baron 58 with Continental IO-550-N engines. Data is from a JPI 760-twin with a 2 sec sample rate. Normally we’d see L engine data on top and R engine data on bottom – I changed the top graph to display R engine FF.
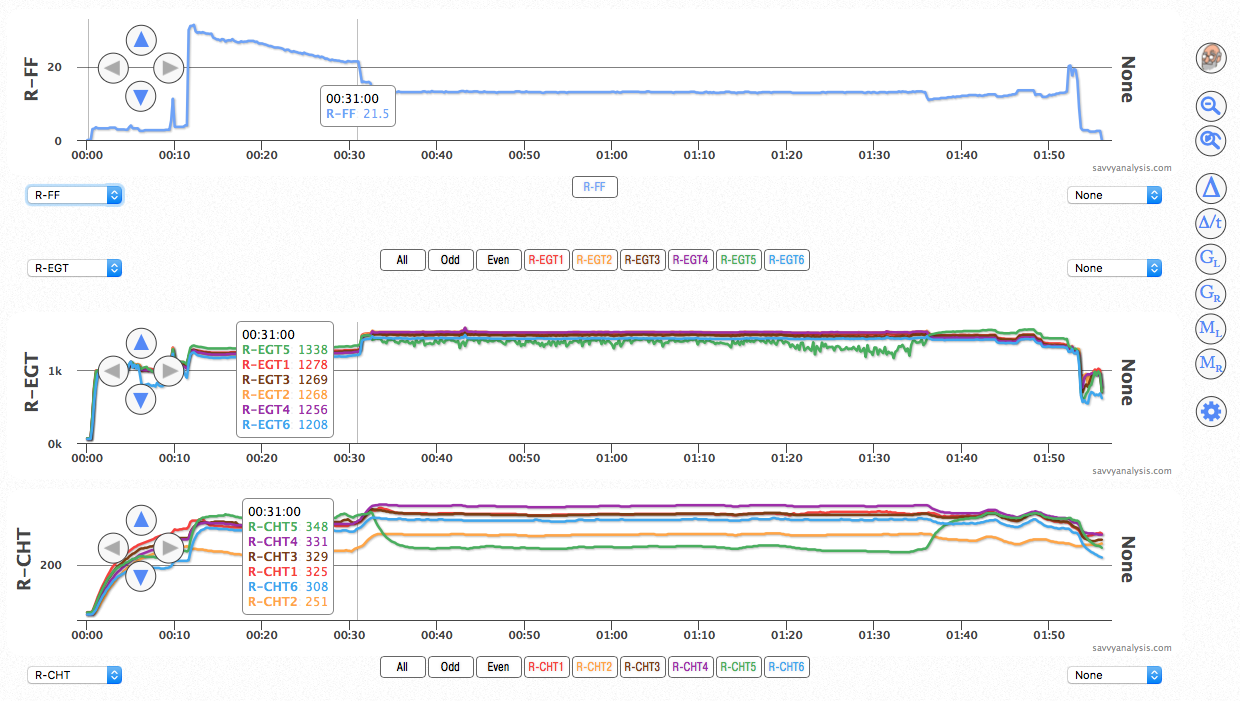
CHT 2 – the gold trace – is using a spark plug gasket probe, so we expect to see lower CHTs. Aside from that all looks ok except EGT and CHT 5. They’re high when FF is high, then at the big pull (at the cursor) CHT 5 drops dramatically and EGT 5 becomes jittery.
If you’re a regular Puzzler reader, you have probably spotted this scenario as a textbook clogged injector. Clogged enough to pass most – but not all – of the fuel when there’s a lot of it, and barely able to sustain combustion when fuel is scarce. When FF is reduced from the cruise setting – at about an hour and 35 mins in the timeline – that seems to be the magical amount where the clog is no longer a factor.
So if you’re in cruise and suspect a clog, it’s counter-intuitive to think you should reduce FF a skosh, but – depending on the nature of the clog – it could make a difference.
Next up is data from a Cirrus SR-22 with a Tornado Alley IO-550-TN. Data is from an Avidyne with a 6 sec sample rate. EGTs and RPM are on top – RPM is bold and green. CHTs are on bottom, along with MAP which is also green.
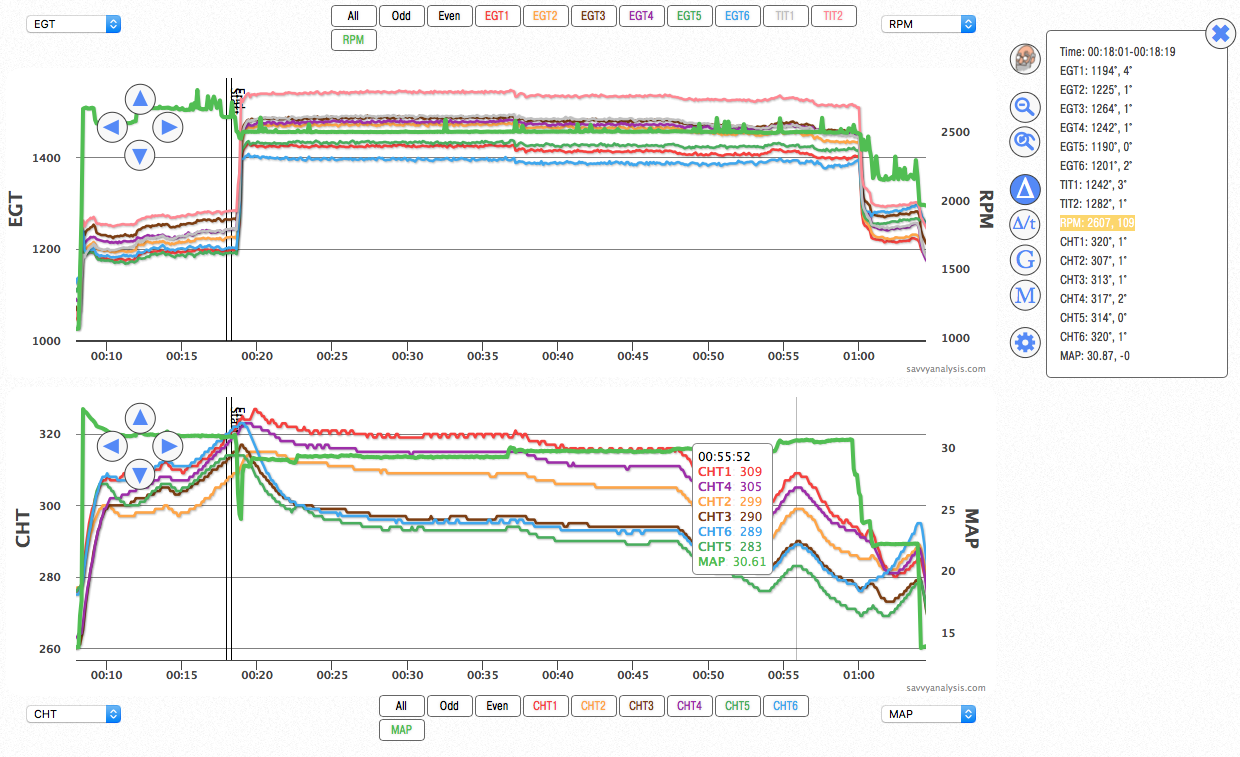
This isn’t the entire flight – I zoomed in to show takeoff to approach. The data shows momentary spikes in RPM. The pilot saw the spikes in real time, but felt no surges or change in power when he saw them.
There’s a box of numbers to the right of the top graph. I used our plotter’s delta tool to measure the quantity of the spikes, and they were about 100 RPMs each time. Notice there are no spikes until the end of climb, then a few in the early cruise segment, then they get plentiful toward the end of the flight.
You would certainly feel a real surge of 100 RPMs, especially considering that with this 6 sec sample rate it would have had to last at least that long to get into the data. So in the absence of any corroboration, this looks like an RPM sensor on its way out. We always recommend checking connections before replacing sensors or probes, but the consistency of the spikes in the 100 RPM range seems too rational for a loose connection.
Let’s finish this month with a puzzling scenario that the data helped solve. Here’s data from a Cessna 180 Skywagon with a Continental O-470, using an EI MVP-50P with a 1 sec sample rate. The sloping red line is Estimated Fuel in Gallons – starts about 60, ends about 40.
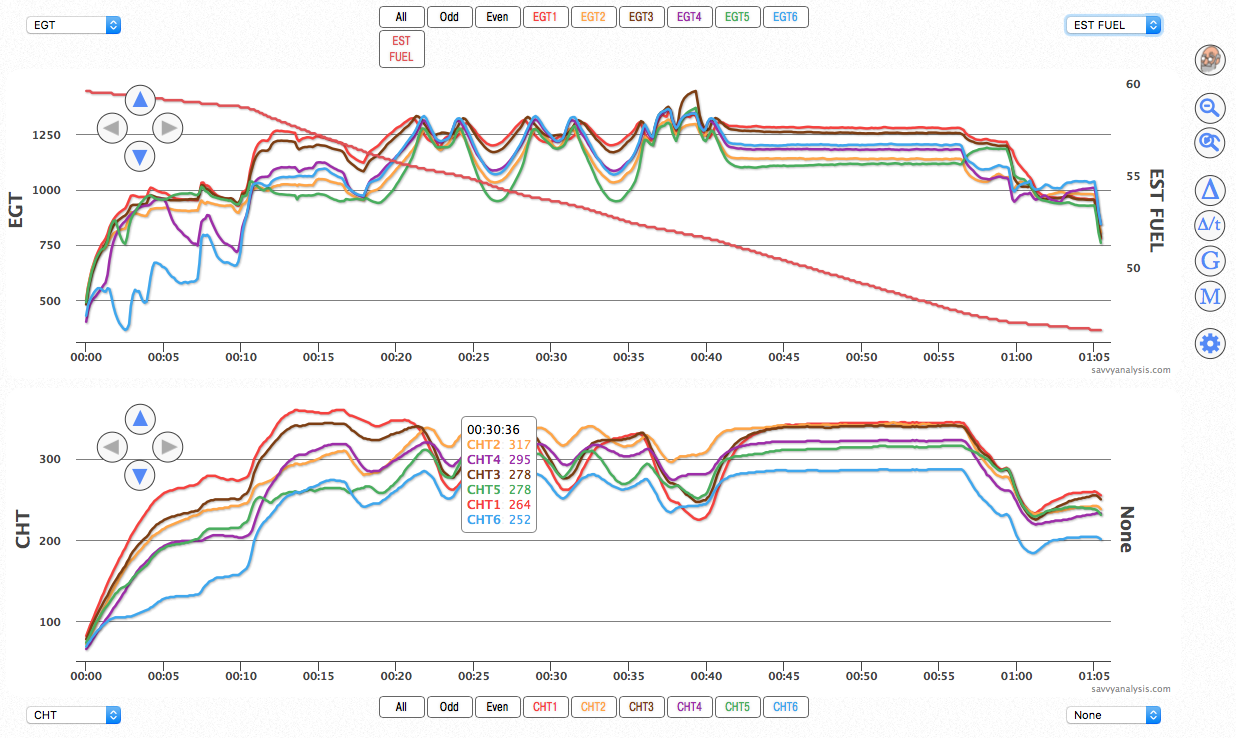
The pilot reported that when he topped off, the panel-mounted fuel gauges read accurately, and as he flew, those gauges showed that he was using more fuel than the engine monitor showed. For instance, he’d top off, reset the EI, fly for an hour with FF around 12-14 GPH, his gauges showed about half-tanks, but the EI showed him down about 12-14 GPH. The longer he flew, the closer to E his gauges would read. If he landed and topped-off, the pump showed 12-14 GPH and the gauges read F again.
So the data showed that the EI was accurate, and the panel-mounted gauges were reading ok when full, but progressively lower as fuel was consumed. Hint – this 180 uses bladder-type tanks.
A very determined avionics tech opened the fuel bladder to check the sensors, and discovered that the snaps holding the bladder on the top of the wing, above the fuel sender, had disconnected. So as the fuel quantity decreased, the bladder collapsed over the fuel sender float pushing it down – resulting in an abnormally low indication.
If the 180 had arrived at the avionics shop with full tanks, it would have been hard to spot the problem. Sometimes you need a little luck.
