It’s always fun at Oshkosh when one of the technologies of GA makes a move after spending a lot of time on the plateau. Avgas is the latest example. For years we just pumped it and worried about the short-term cost and the long-term availability, and now we’ve got some interesting new options to consider. A few years ago it was electronic mags. Before that, glass panels, electronic flight bags, flow-balanced injectors, active noise reduction headsets – the list goes on. It feels like we’re at a plateau with engine monitors.
For the past thirty or so years we’ve had the same basic thermocouple sensors to gather EGTs and CHTs, and other types of pressure and flow sensors for other engine data. Garmin just made an improvement in their manifold pressure sensors for the G3X Touch, but adding a snubber is more like a small step than a giant leap. (Sorry, I get this way every time an Apollo 11 anniversary rolls around.) Displays are certainly prettier now, and with most units you can program alarms to warn you of trouble. Maybe this Oshkosh will bring a surprise from the engine monitor direction. Meanwhile, we’ve got puzzles to solve.
First up is data from a Beech Bonanza 36 with a brand new Continental IO-550-B and data from a JPI 700 with a 2 sec sample rate. These are two sample flights from the mid-point of the break-in. EGTs on top, then CHTs and FF. Nothing special about cursor placement.
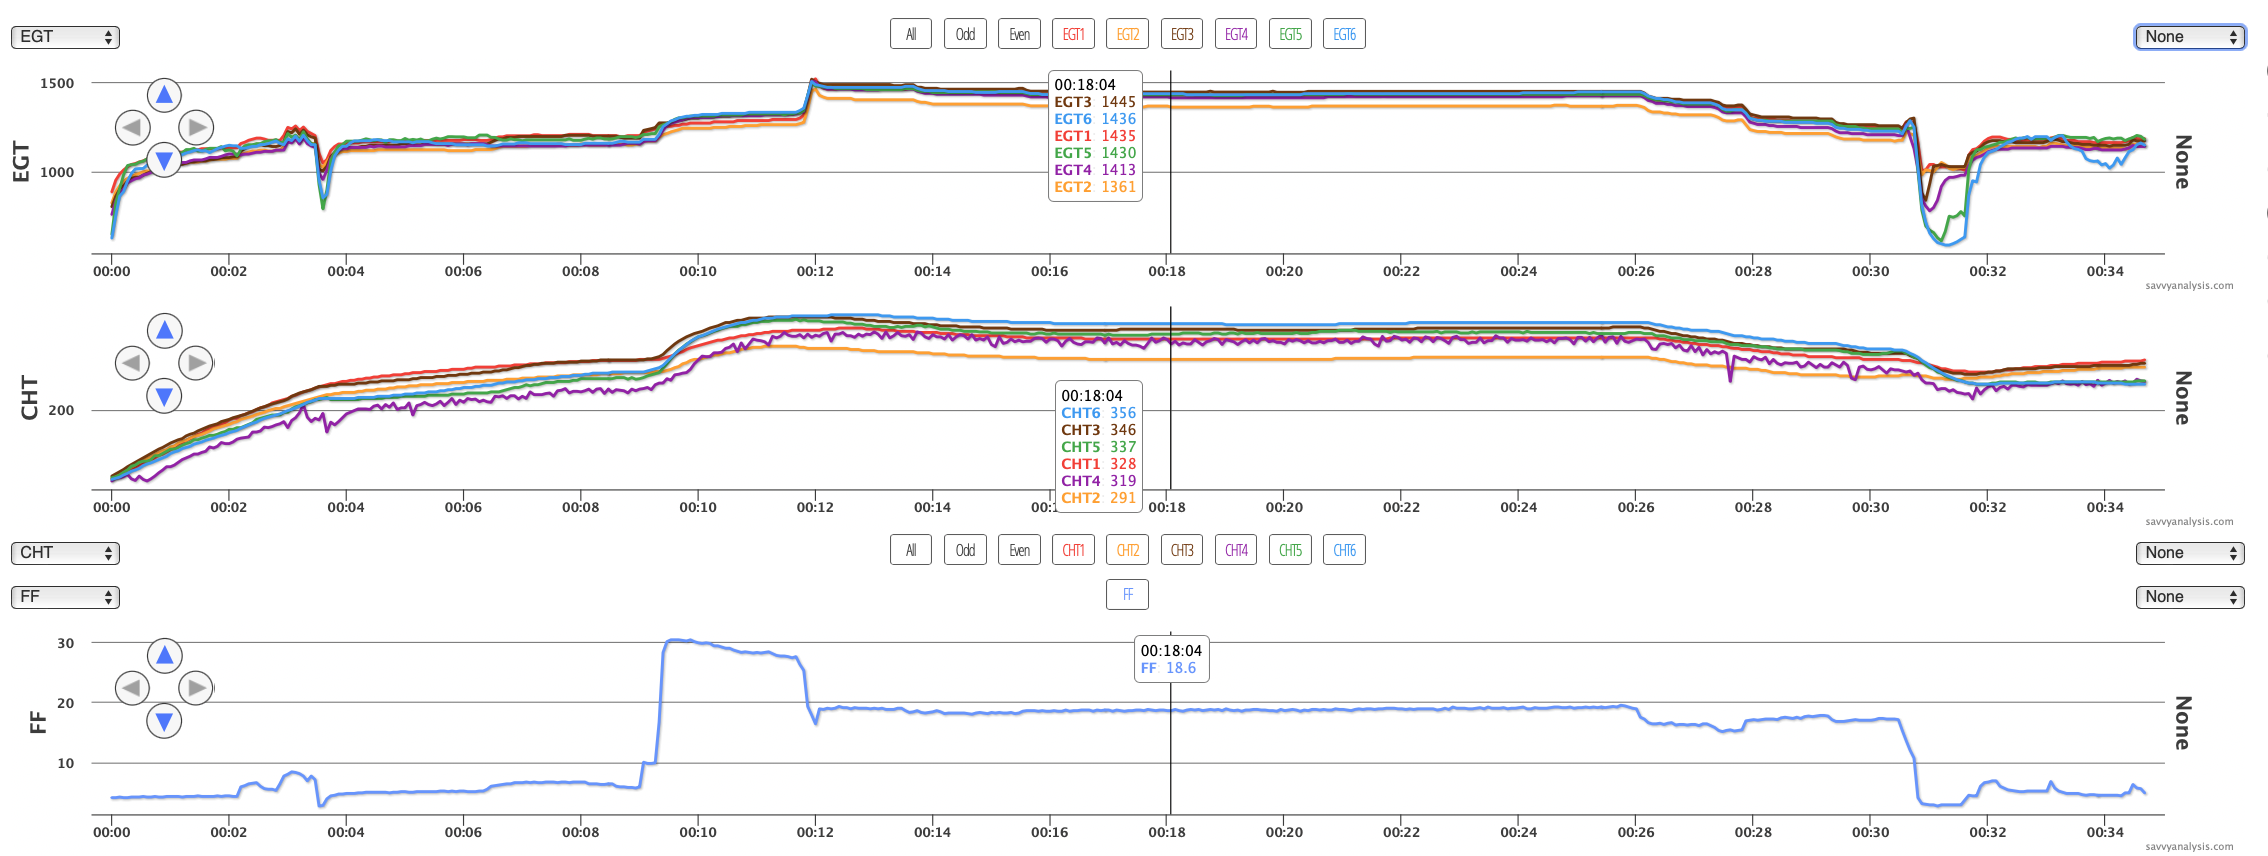
If you’ve had the experience of breaking in a new engine, you probably remember being hyper-sensitive to any abnormality – not that that’s a bad thing. On these flights, EGT and CHT 2 are a little low, but the chatter of CHT 4 gets your attention first. Here’s a hint. CHT 4 didn’t have this chatter until the first oil change. Is something wrong with the cylinder, or is this just noisy data? EGT 4 looks fine on both flights. There was no report of increased vibration. The engine was too new to draw meaningful conclusions from oil consumption.
If it is noisy data, you have to give the probe E for effort – it’s trying to display useful information. On both flights there are quick drops in CHT 4 that occur about 7 to 8 minutes before data ends. Altitude isn’t logged, but that’s about where you’d expect either gear or flaps to be extended. There were no clues in Bus Voltage, so I didn’t display it here. It always makes sense to check the connection first and in this case that’s what it was. Did the CHT 4 connection get bumped during the oil change? Hmm – oil filler tube is on that side, quick drain is on that side, timing supports the theory. In any case, it’s working now. Also, idle MAP is slightly high so we think the low EGT and CHT of cyl 2 may be a slight induction leak there.
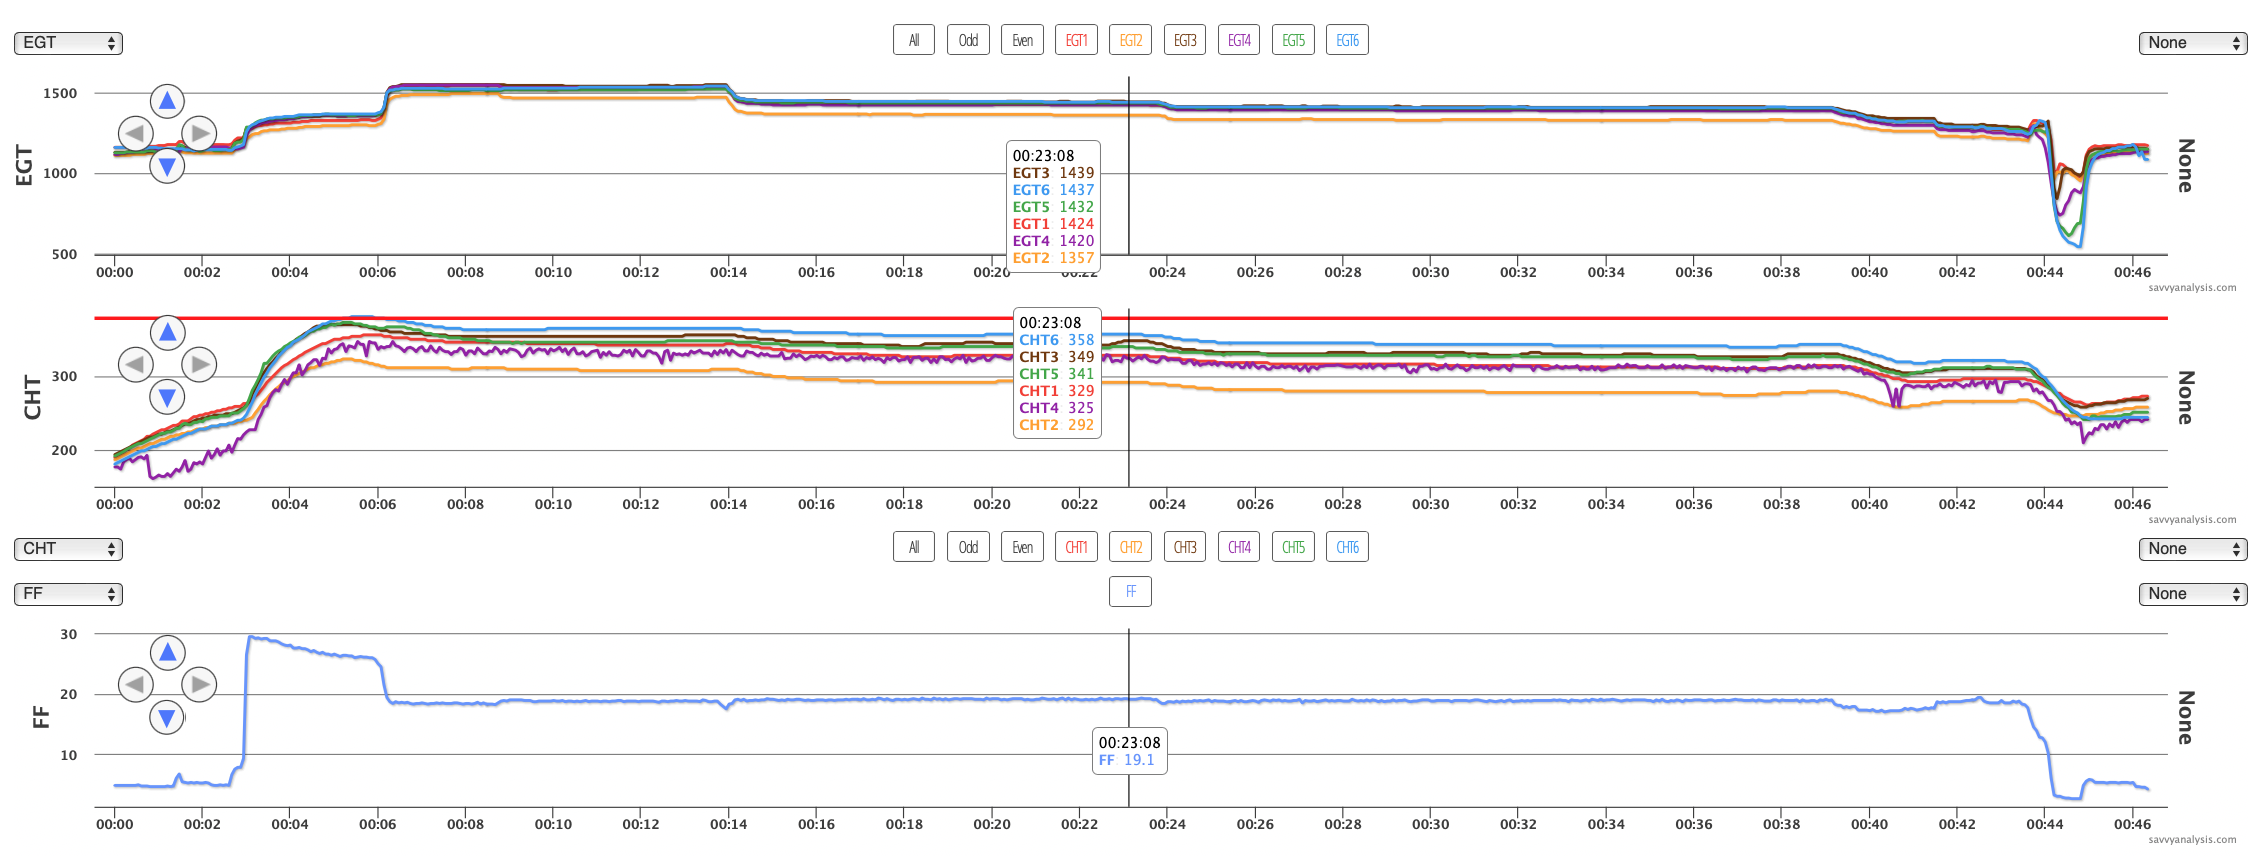
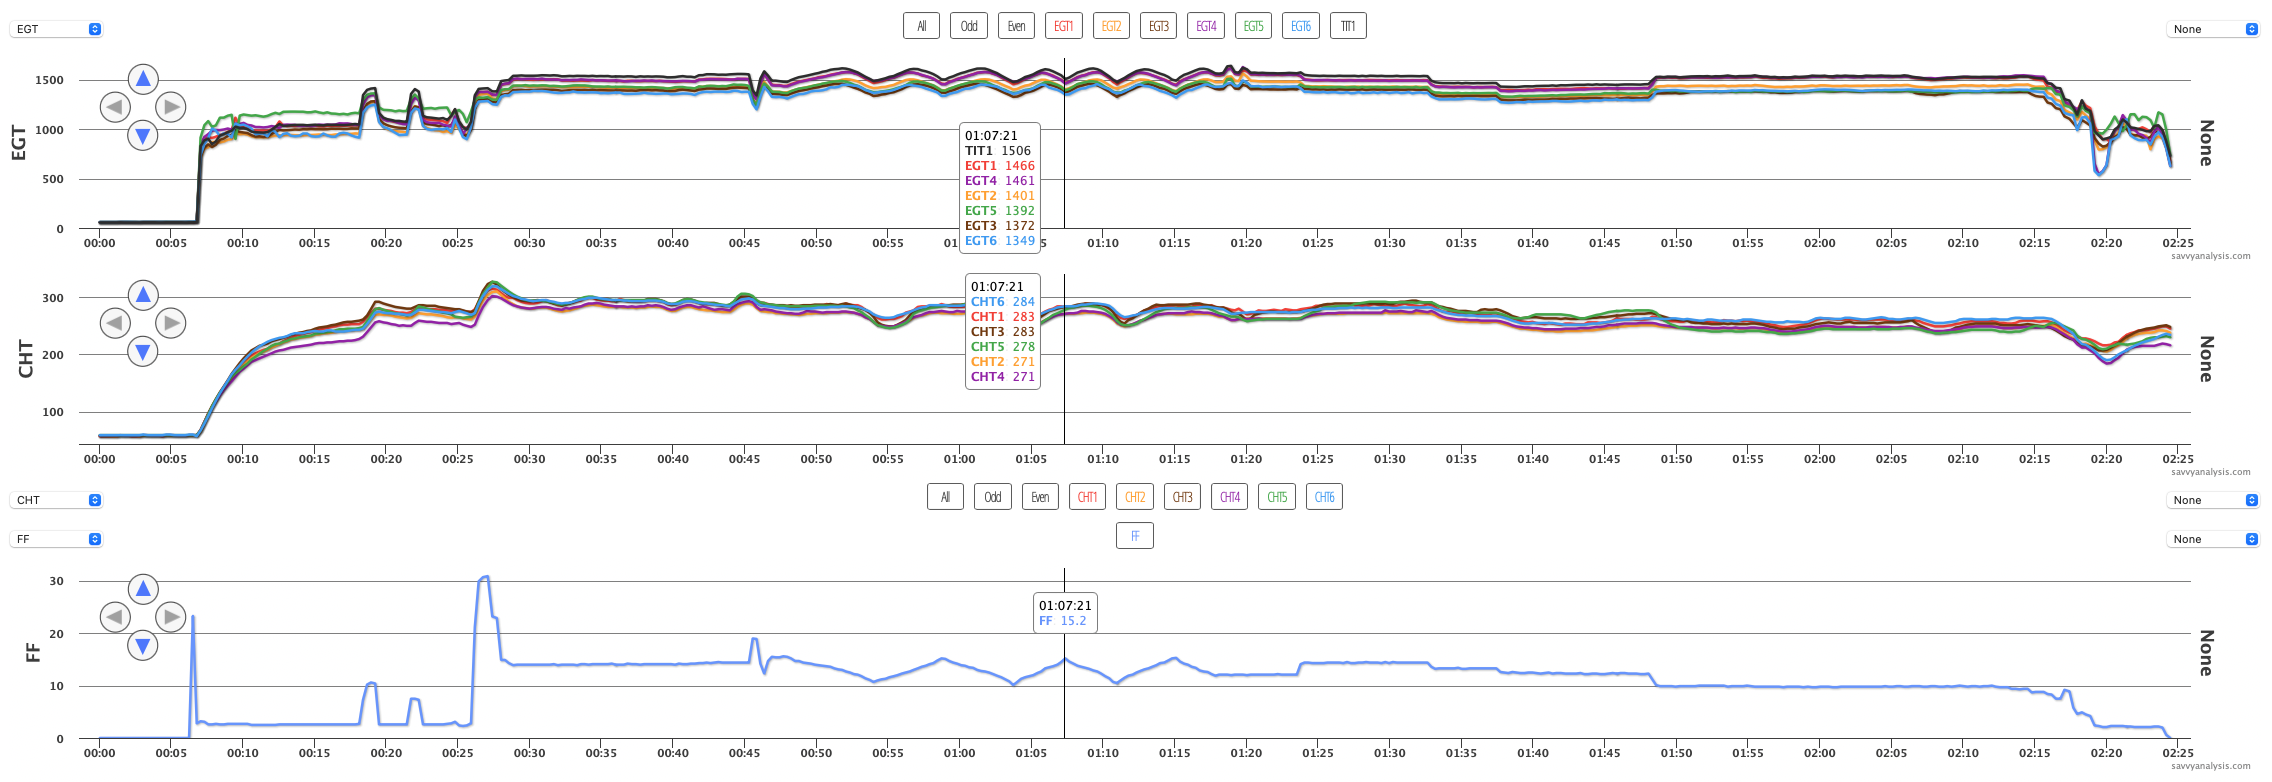
Next up is data from a Cessna Turbo 210 with a Continental TSIO-520 and data from a JPI 830 with a 2 sec sample rate. EGTs on top, then CHTs and FF. Nothing special about cursor placement.
This time CHT 1 is the outlier. It looks ok during taxi out, then drops as the others rise, then joins the others again when power goes to idle at the 28 min mark. As with the Bonanza, this cylinder’s EGT looks normal, it’s right there in the middle of the pack. Other flights from this timeframe show a similar pattern, and unlike the Bonanza this didn’t start happening right after a maintenance event.
The JPI 900 series are primary instruments, meaning it can replace many of the legacy Cessna gauges, including the original CHT gauge. But with the 830, installation requires retaining that legacy gauge, so the cylinder that sends data to it has to feed that legacy gauge along with the JPI. Most of the time that is accomplished using a piggyback CHT gauge for the JPI, while the bayonet continues to feed the legacy gauge as it always did. We suspected that was the case here, and asked our client to verify.
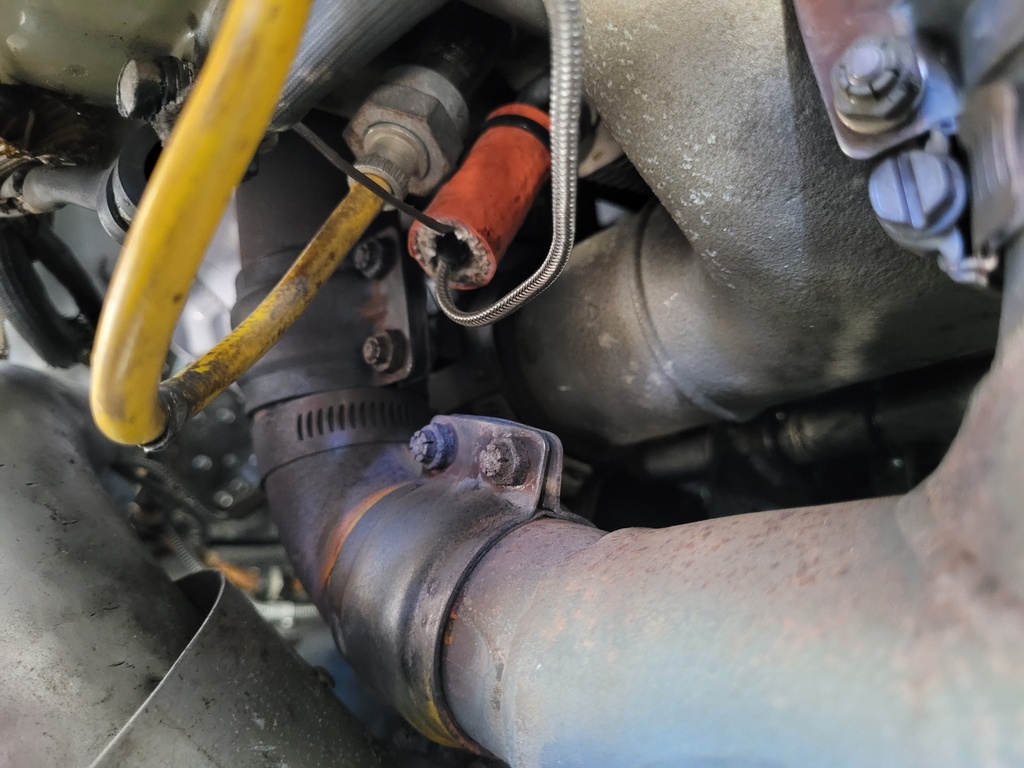
The silver braided cable is from the bayonet and feeds the Cessna CHT gauge. The black cable is the piggyback probe and feeds the JPI 830.
The fire sleeve is a good idea given the proximity to the exhaust system. But we recommended a second zip tie at the open end to keep heat away from the sensors.
Knowing what we know now, let’s see if we can explain the data. During taxi out, the JPI was getting its signal from under the bayonet, plus some ambient heat rising from the exhaust system just inches away.
Then when power was applied and the airspeed increased, the exhaust system got a lot hotter, but the incoming air redirected most of the heat out the bottom cowl.
That’s our best explanation for why CHT 1 is in with the others during ground ops, registers low while the airplane’s in flight, then joins the others again after landing.
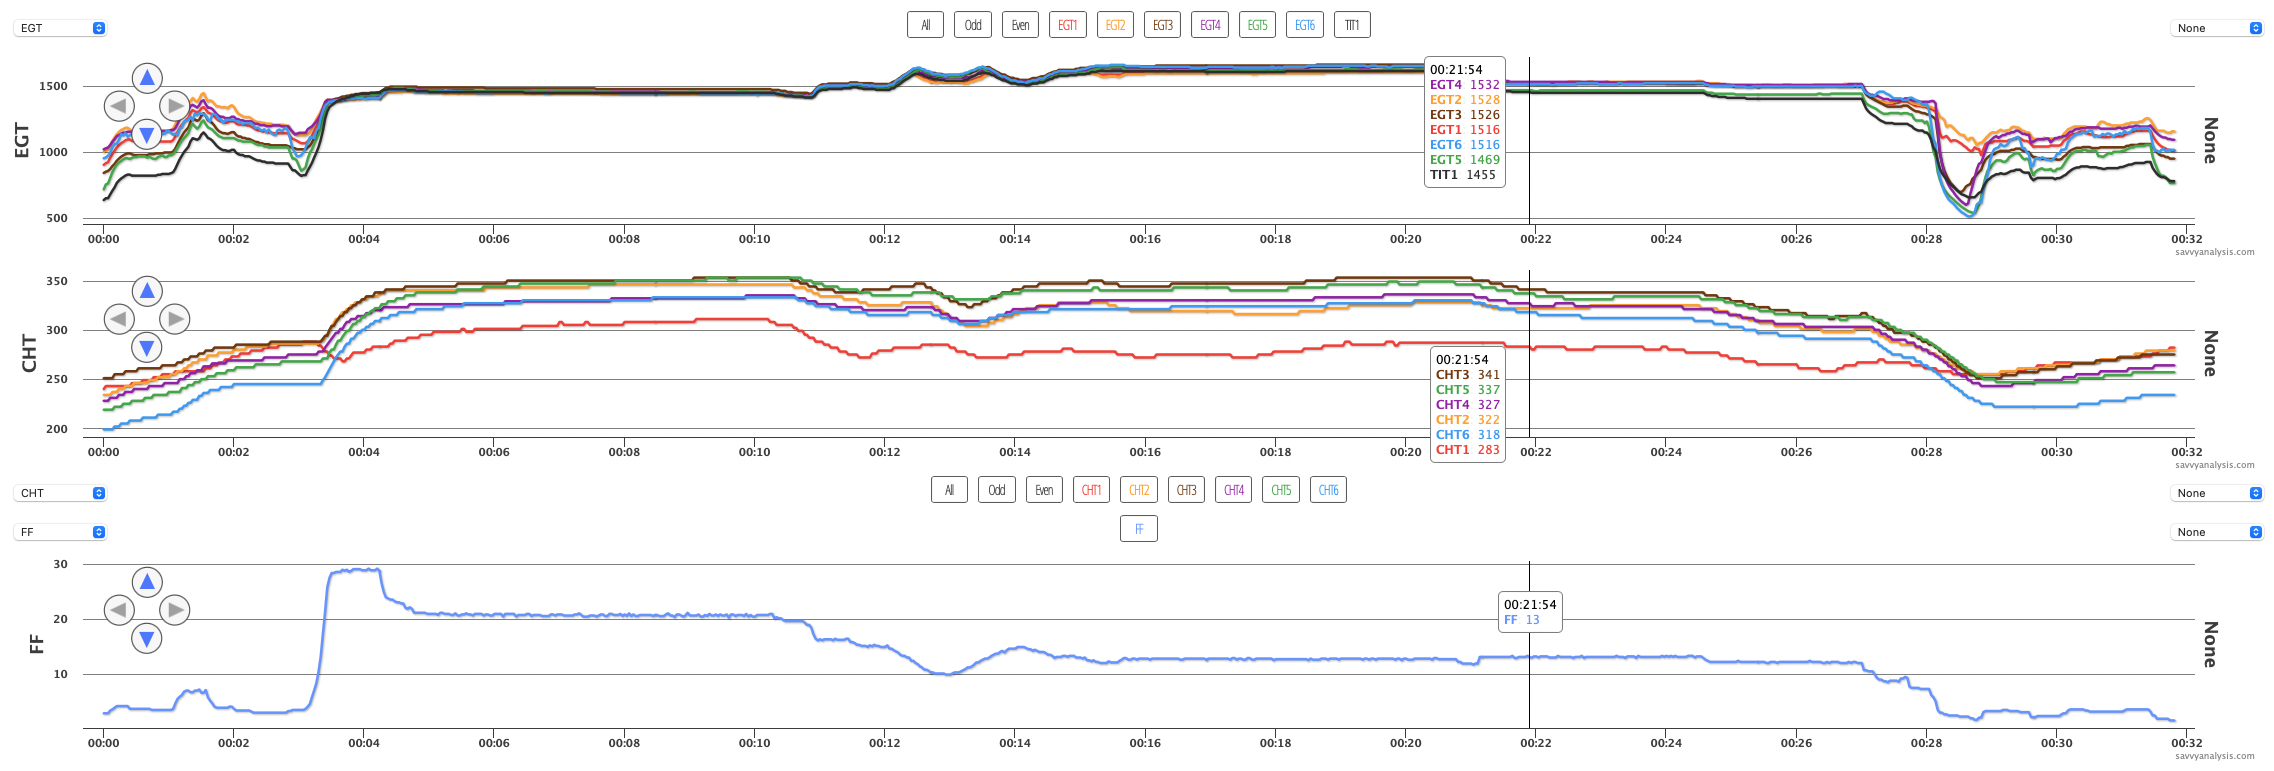
We’ll close this month with data from a Mooney M20TN with a Continental TSIO-550 and data from a Garmin G1000 with a 1 sec sample rate. This is a test profile flight with mixtures sweeps and a LOP mag check. Nothing special about cursor placement.
If you look very closely you can see EGT 6 is not as steady as the others. Let’s isolate EGTs and zoom in from takeoff to landing.
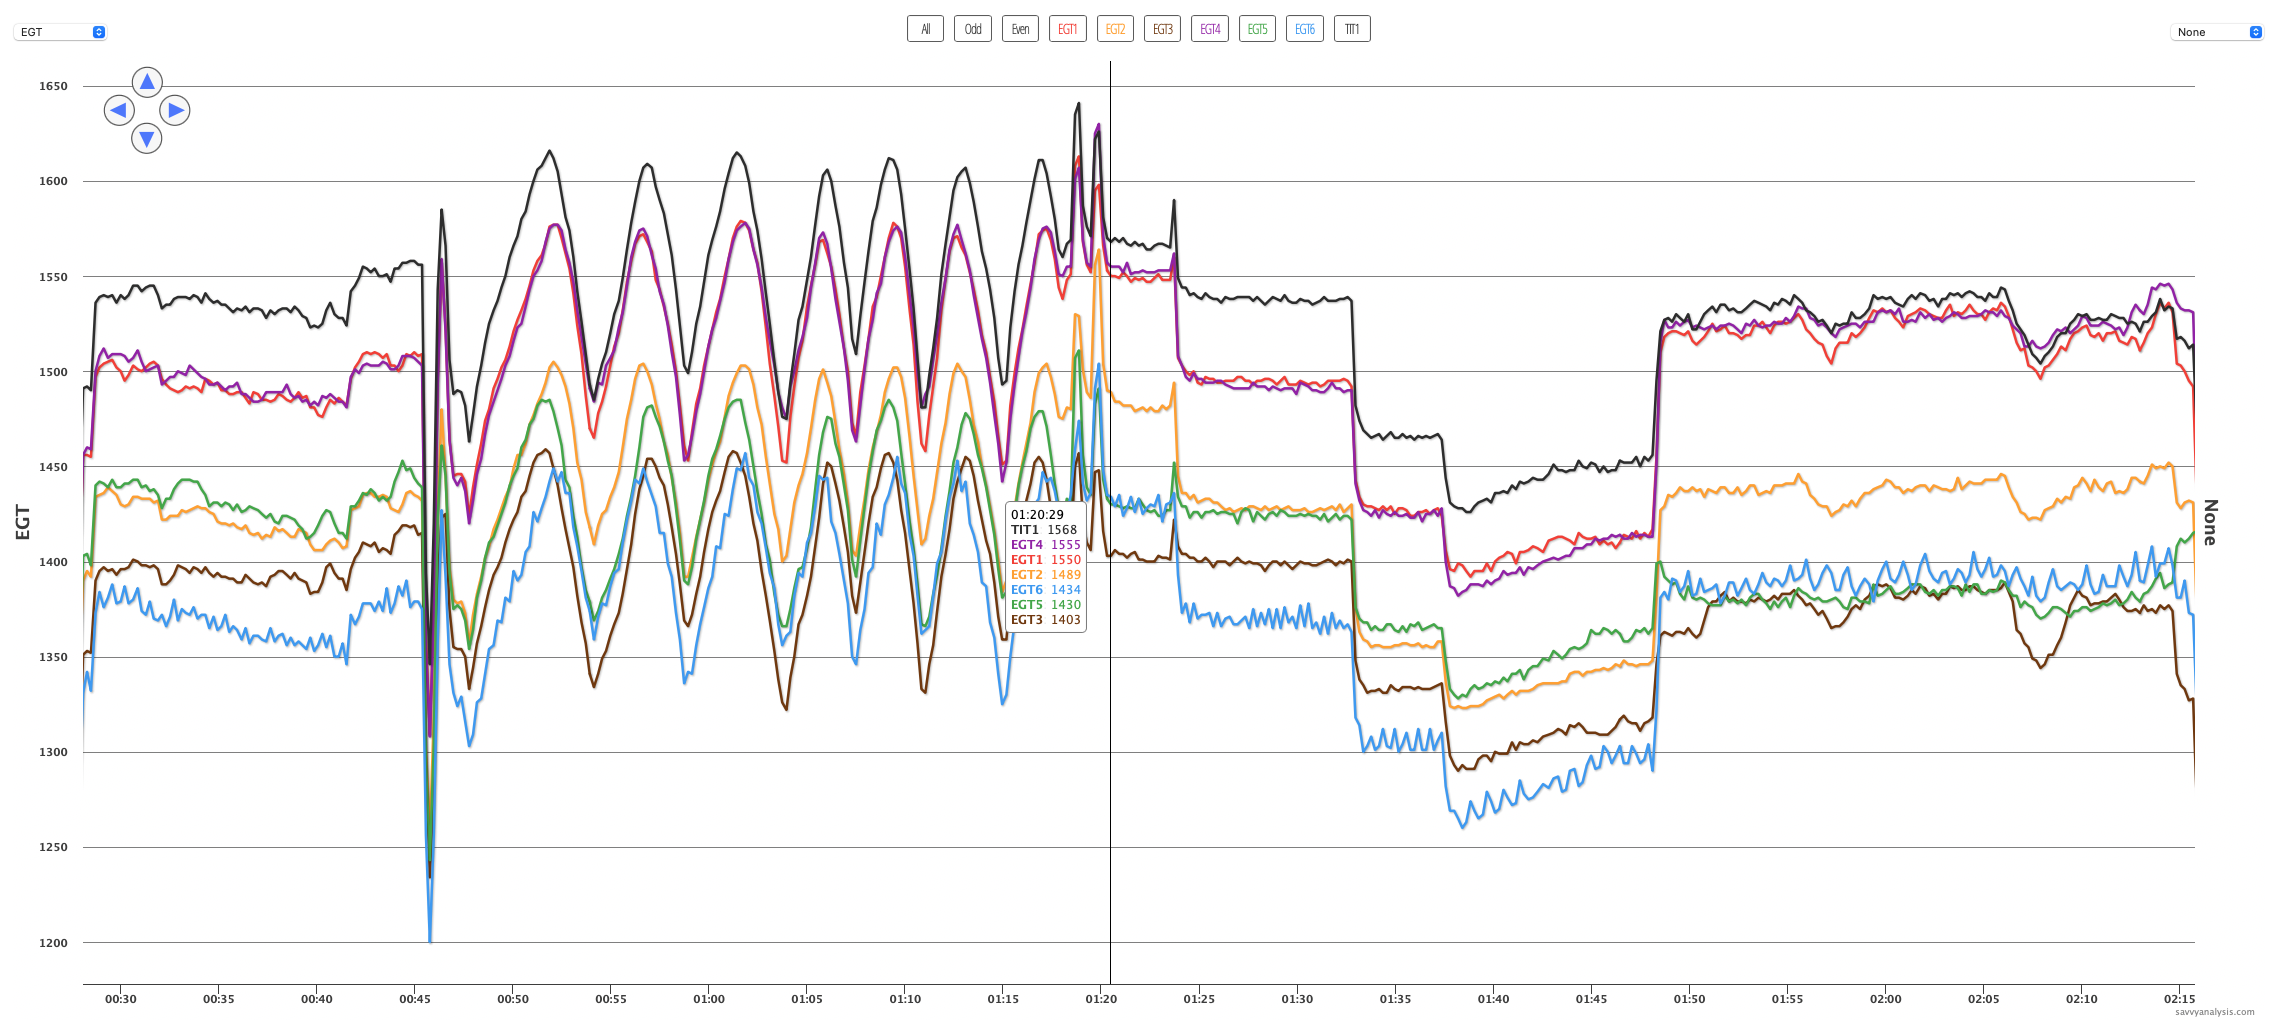
Now it’s easier to see the pattern in EGT 6. It’s pretty persistent – it’s even there during the mixture sweeps. Our FEVA 1 algorithm scans for a change in EGT within a specified degree range and over a specified time. This pattern is not as sinusoidal (sinewave-shaped) as the pattern we typically see. This is more of a sawtooth shape – pointy tops vs rounded tops. We recommended borescoping the cylinder and our client responded “My mechanic told me that #6 cylinder was showing 10 psi for the compression check. The #6 exhaust valve has a green hot spot around 1/3rd of the valve.”
