When guitar strings break there’s no lingering doubt. When an old-style incandescent light bulb fails you might get a bright flash before the darkness, or maybe just the darkness. Either way, no doubt. These are instant, unconditional failures. Then there are failures that are harder to recognize because they evolve over time, like an attitude indicator or DG spinning down after a vacuum pump failure.
As I reviewed this month’s engine data looking for Puzzler candidates, I found some patterns that I hadn’t seen before. I’m always mindful that patterns are easy to spot in the luxury of post-flight analysis, and much harder to spot in real time. Someday soon, once we’ve updated our avionics to comply with the ADS-B deadline, I suspect we’ll have a device in the cockpit that can display cumulative data for the entire flight, not just the number of the moment. Or, maybe you’ll upload to Savvy Analysis in real time and have a fast enough web connection to display our page of your data as you fly. Meanwhile, let’s look at these patterns and remember that for the pilot, they were a series of constantly-updating numbers that got processed with all the other incoming information and sensations of a pilot in command.
First up is data from a Cirrus SR22 with a Continental IO-550-N and data from an Avidyne with a 6 sec sample rate. EGTs on top, below that are CHTs, Fuel Flow and Oil Temp. This is the first hour of a 90 minute flight.
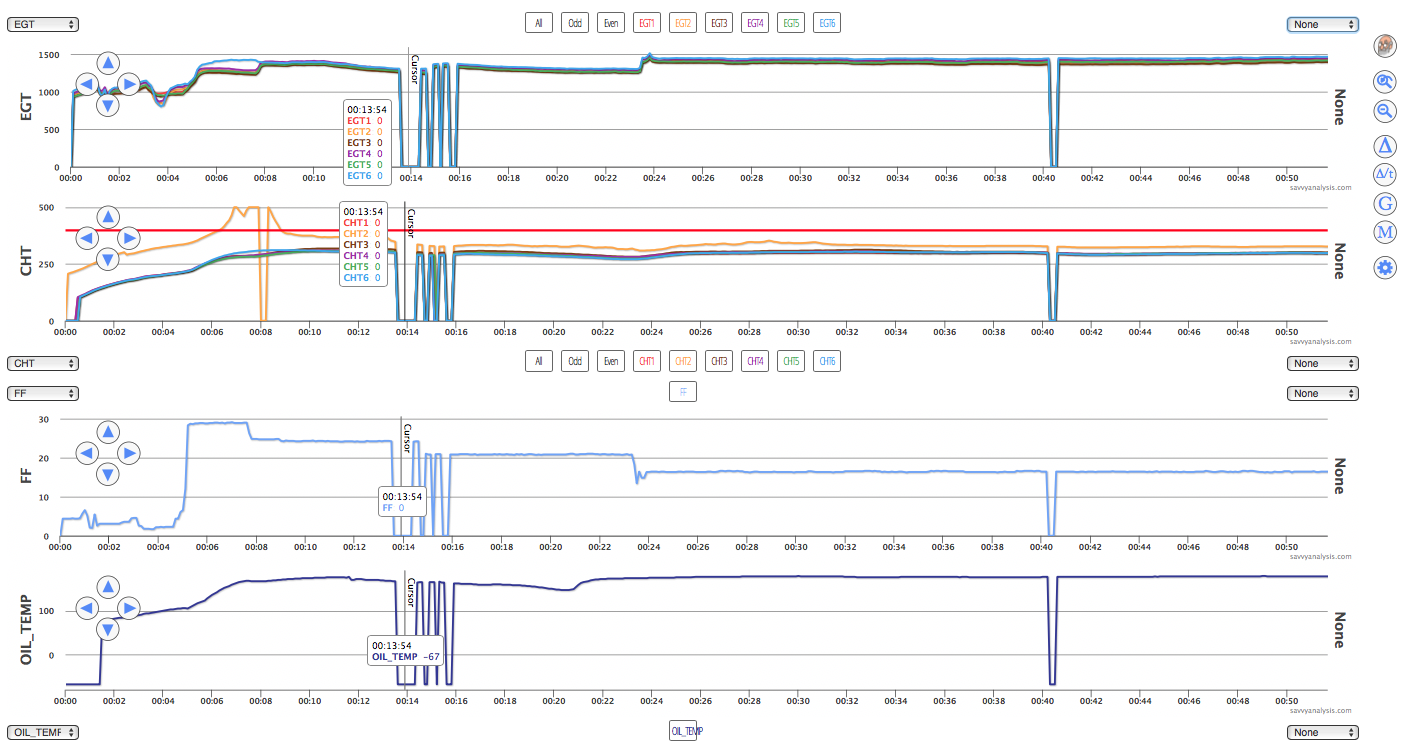
Let’s start at the beginning. CHT 2 – the orange trace – starts by posting early and high. Posting high is not necessarily a trademark of suspicious data, but posting early is. Add them together and we’re suspicious of CHT 2. Apparently the pilot was too, because he elects to take off anyway. CHT 2 continues to rise in the initial climb, all the way to Avidyne’s max value of 500º F. Let’s give the pilot the benefit of the doubt and say he wasn’t concerned about CHT 2 because nothing about EGT 2 corroborated unusual combustion in cyl 2.
EGT 6 is high, and CHT 6 is a little high – the blue traces – so that might be worthy of investigation later on, except we’re about to get bigger fish to fry. After the initial power reduction, CHT 2 drops to zero, then jumps back to 500, then drops into a range that’s almost believable. Then things get interesting. The cursor is parked on the first of four drops to zero for most logged parameters. Oil temp drops past zero to -67º, and OAT (not shown) drops to -58º. Takeoff was about the 5 min mark, so this is about 8 mins later.
This is a flight from one of the Las Vegas area GA airports headed for one of the LA area GA airports in late Spring. If you know the route, you know the mountains southwest of Vegas can rough up the air. GPS ALTitude isn’t logged, but 8 mins probably puts you high enough for a rough ride. In this case it was rough enough to shake the ground strap and confuse the Avidyne for a while. Just when things settle down, there’s another jolt about a half-hour later.
When your post-flight data looks like a series of power cables and utility poles, in real time that was a series of drops to zero, so you can’t trust anything and the biggest worry is will it shut off again and not come back ?
Here’s data from a Cessna T240 TTx with a Continental TSIO-550-C and data from a Garmin G2000 with a 1 sec sample rate. EGTs and TITs on top, below that are CHTs, FF and Oil temp.
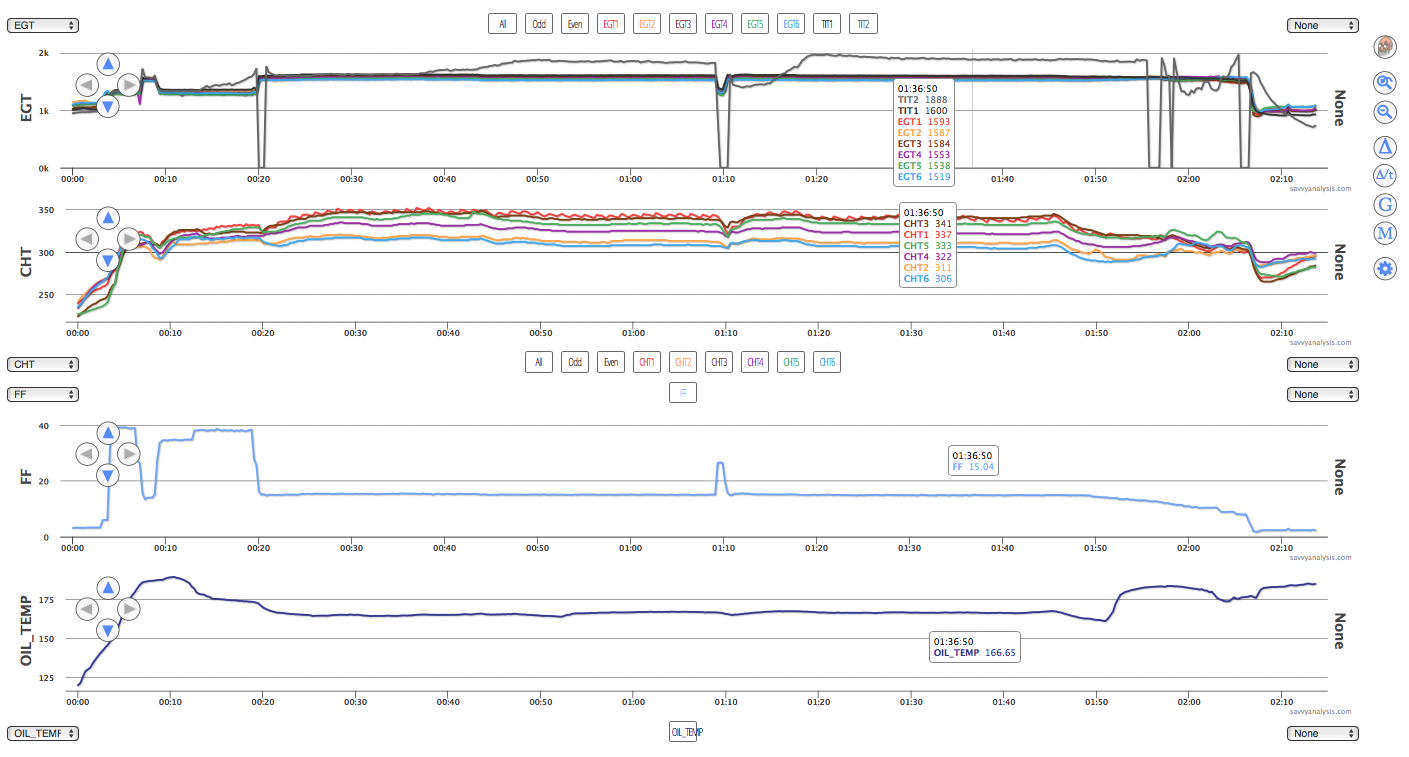
This time only TIT 2 has that power pole look. Highest valve posted was 1960º. No other EGT is out of line, so it’s pretty easy to dismiss this as a failed probe. It always makes sense to check the connections, and if the TIT was only drops to zero and then normal temps, we might consider the connection – but this acts more like a failed probe.
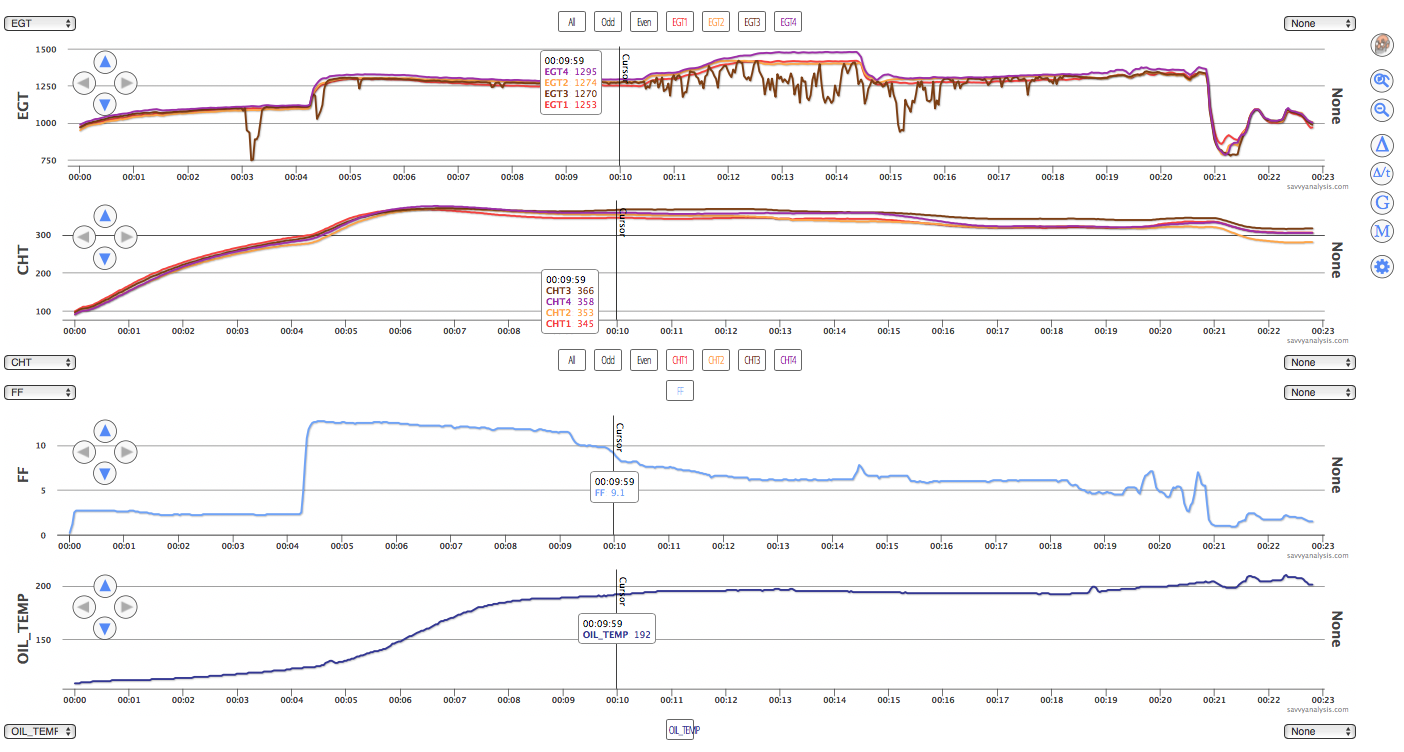
Next up is another Cirrus SR22 with a Continental IO-550-N, but this time data is from a JPI 900 with a 2 sec sample rate. EGTs on top, below that are CHTs, Amps and Volts, then Fuel Flow and OAT.

Note that the cursor is on the OAT spike to 149º. The unusual pattern here is that CHTs seem to randomly jump up, flatline, then go back to normal. That’s interspersed with some more common shorter spikes. Since it’s ok during taxi out, then erratic for about an hour after takeoff, then settles down again, it’s tempting to tie this to RPMs. Investigation revealed this was also a ground strap issue – it’s not hard to imagine vibration being higher at higher RPMs.
Here’s data from a Lancair 360 with a Lycoming IO-320 engine and data from an Advanced Flight Systems monitor with a 1 sec sample rate.
Our nickname for the pattern in EGT 3 – the brown trace – is icicles. I guess technically they’re stalactites – since stalagmites grow from the bottom up – but ice isn’t my field. Like others we’ve seen, the pattern is worse in one phase of flight than in others. Here it’s after leaning for cruise, presumably at highest TAS, so that’s an argument for checking the connection, although the worst spike was just before takeoff with no power change.
Let’s finish this month with data from a Piper Mirage with a Lycoming TIO-540 engine and data from a JPI 930 using a 6 sec sample rate. That gives me a chance to remind JPI users that we recommend a 2 sec sample rate for JPIs. Users of the newer units like the 930 could set it to 1 sec, but you’ll fill the memory twice as fast. 2 is a good compromise – fast enough to capture short events that 6 might miss most of – but you don’t have to dump data as often. EGTs on top, below that are CHTs, then FF and MAP – the red trace, then oil pressure and oil temp – the green trace.
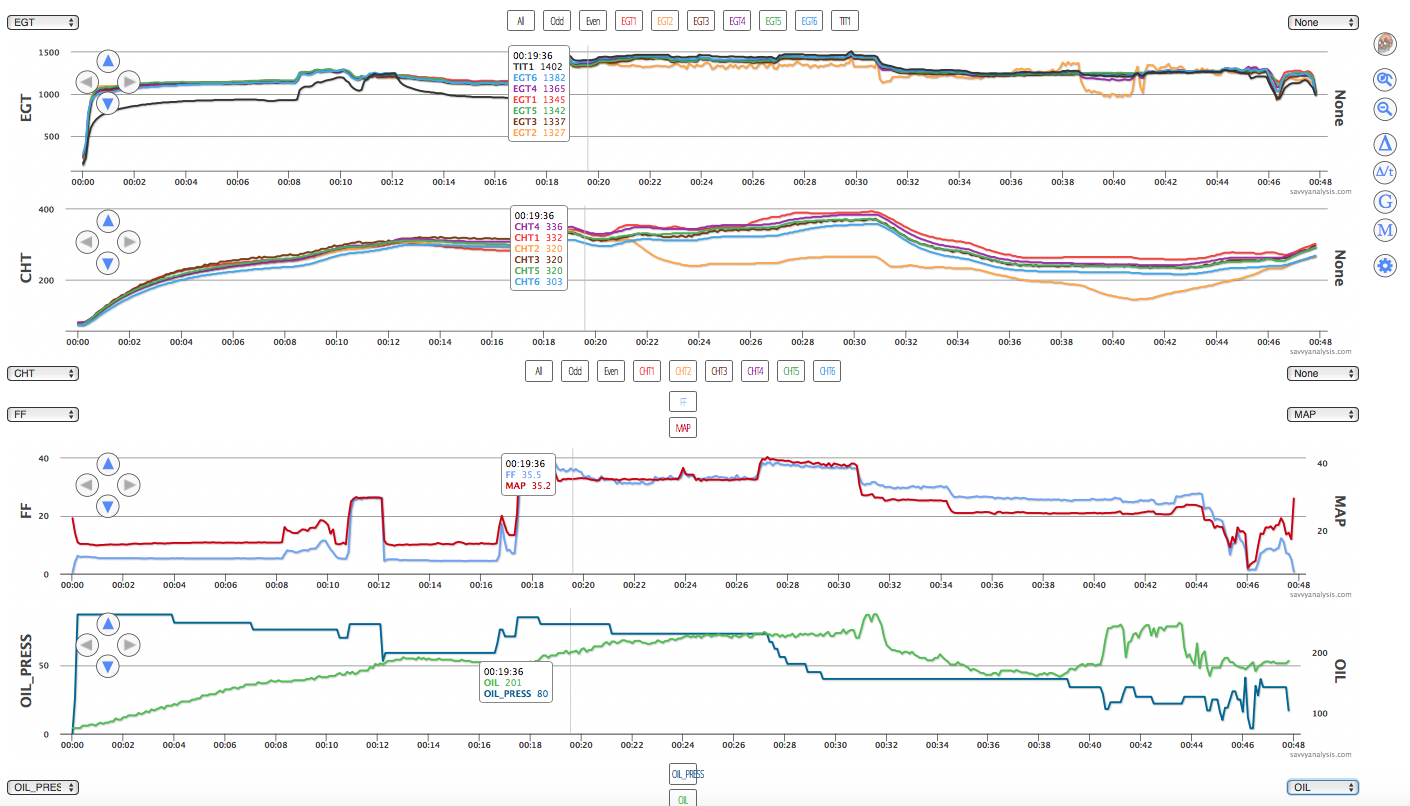
The cursor marks initial climb, which is just before things go wrong. Our client reported a power loss and noted the fluctuating EGT 2, the drop in CHT 2 and the drop in oil pressure. Caution – this is a tough puzzle and there are facts not yet in evidence. But this is what we saw initially, and here was our thought process.
Because MAP is high after engine start and just before shutdown we considered an induction leak. But a cylinder running lean due to a leak should post higher EGT and CHT when rich of peak, and that’s not happening. Plus, an induction leak would not account for a significant drop in oil pressure.
The interesting thing about the oil pressure drop is the timing of it. At takeoff it’s 85, then 80 (where the cursor is), then 73 at the event, then maintains 73 until MAP rises at 27 mins. Meanwhile, EGT is wobbly but still making spark. But it doesn’t rise as we’d expect with a fouled plug or a clogged injector – neither of which should have any effect on oil pressure. Oil temp was 185 at takeoff – which is ok – then it climbs to 204 at the event, and keeps climbing as cyl 2 drops off, to a peak of 262 before falling again. That’s probably why the other CHTs rise after the event.
We recommended a borescope of cyl 2, and a careful inspection of the oil filter. We would not have been surprised to find a missing a piece of valve. Before that was accomplished, we got an update, including these pictures. Hint – it was a metallic object, it’s part of the valve train, but not part of the valve face.
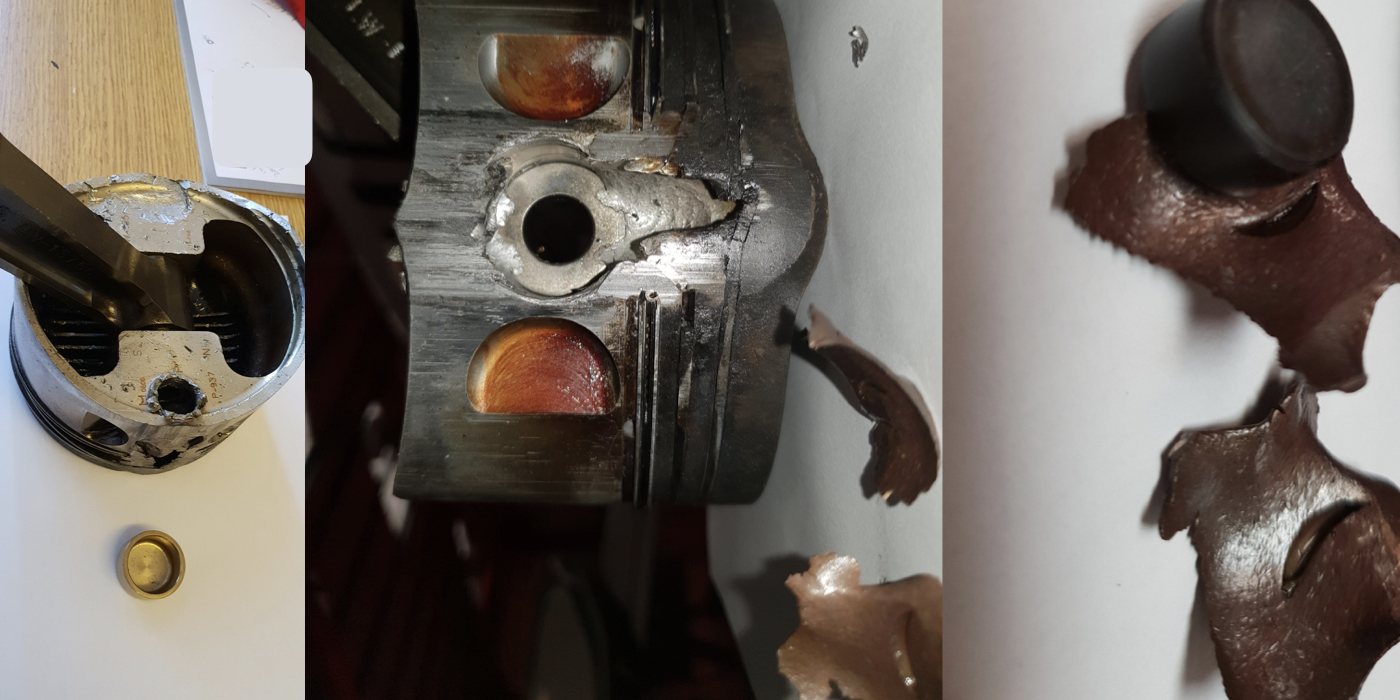
Evidence suggests that a foreign object was inside the piston end cap, that it rattled furiously around, damaging the piston pin end cavity and eventually firing itself out. The piston pin is not itself damaged, but something has clearly been working its way up and down the cavity [middle photo above]. Best theory about the foreign object is a rotator cap, based on the size of the “bullet” hole. The mystery is there are no rotator caps missing from any of the exhaust valves.
