Part of the job of engine data analysis is separating relevant, useful information from red herrings. I always wondered why there were two definitions for red herrings; the first is a smoked fish and the second was something meant to distract from the main issue in an argument. What did one have to do with the other? It turns out that the smoked fish – which turned red in the smoking process – was used to train hunting dogs to focus on the scent of the prey and to ignore distracting smells. Sometimes we get an analysis request that contains a piece of information that’s tempting to chase, only to find it’s a separate issue or not an issue at all.
Pilots have to deal with red herrings in real time. The mother of all red herrings is failure of a flight instrument. Shortly into my instrument check ride, with me under the hood, the attitude indicator went toes up. The DPE waited for me to say something – it didn’t take long. We weren’t far from base so we shot a partial panel approach, swapped that Archer for another, and finished the ride. There’s nothing about it in the private pilot training, but a pilot would be smart to be able to recognize bad engine monitor data from a real occurrence. But I’m preaching to the choir – that’s why you read the Puzzlers.
Let’s start this month with data from a Cessna P210 with a Continental TSIO-520 engine and data from an AuRACLE 2100 with a 2 sec sample rate. EGTs on top. then CHTs then FF and RPMs. The cursor is no place special – just out of the way.
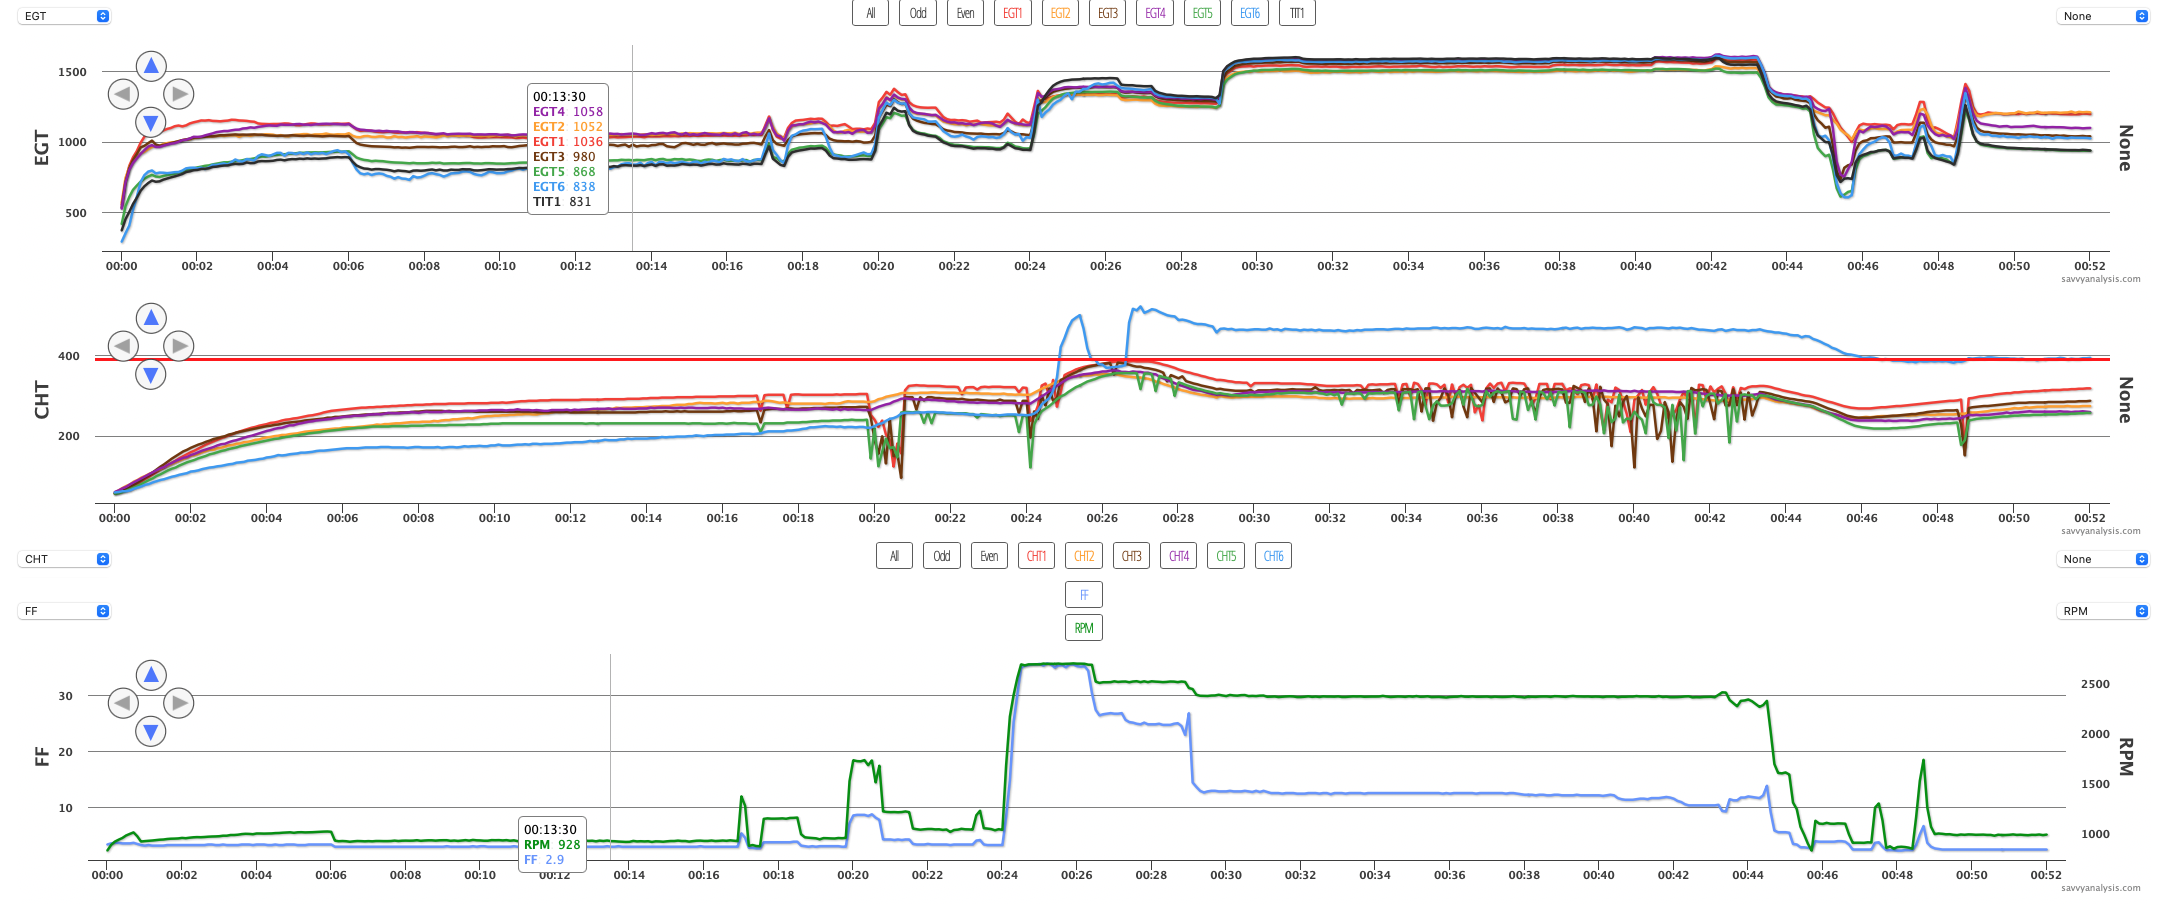
It’s a 52 min flight with takeoff just before half of that – so a pretty long taxi out. There are three instances of FF and RPM increases, two at 17 mins and one at 20 mins. Here’s a chart of the same 52 min flight showing CHTs only.
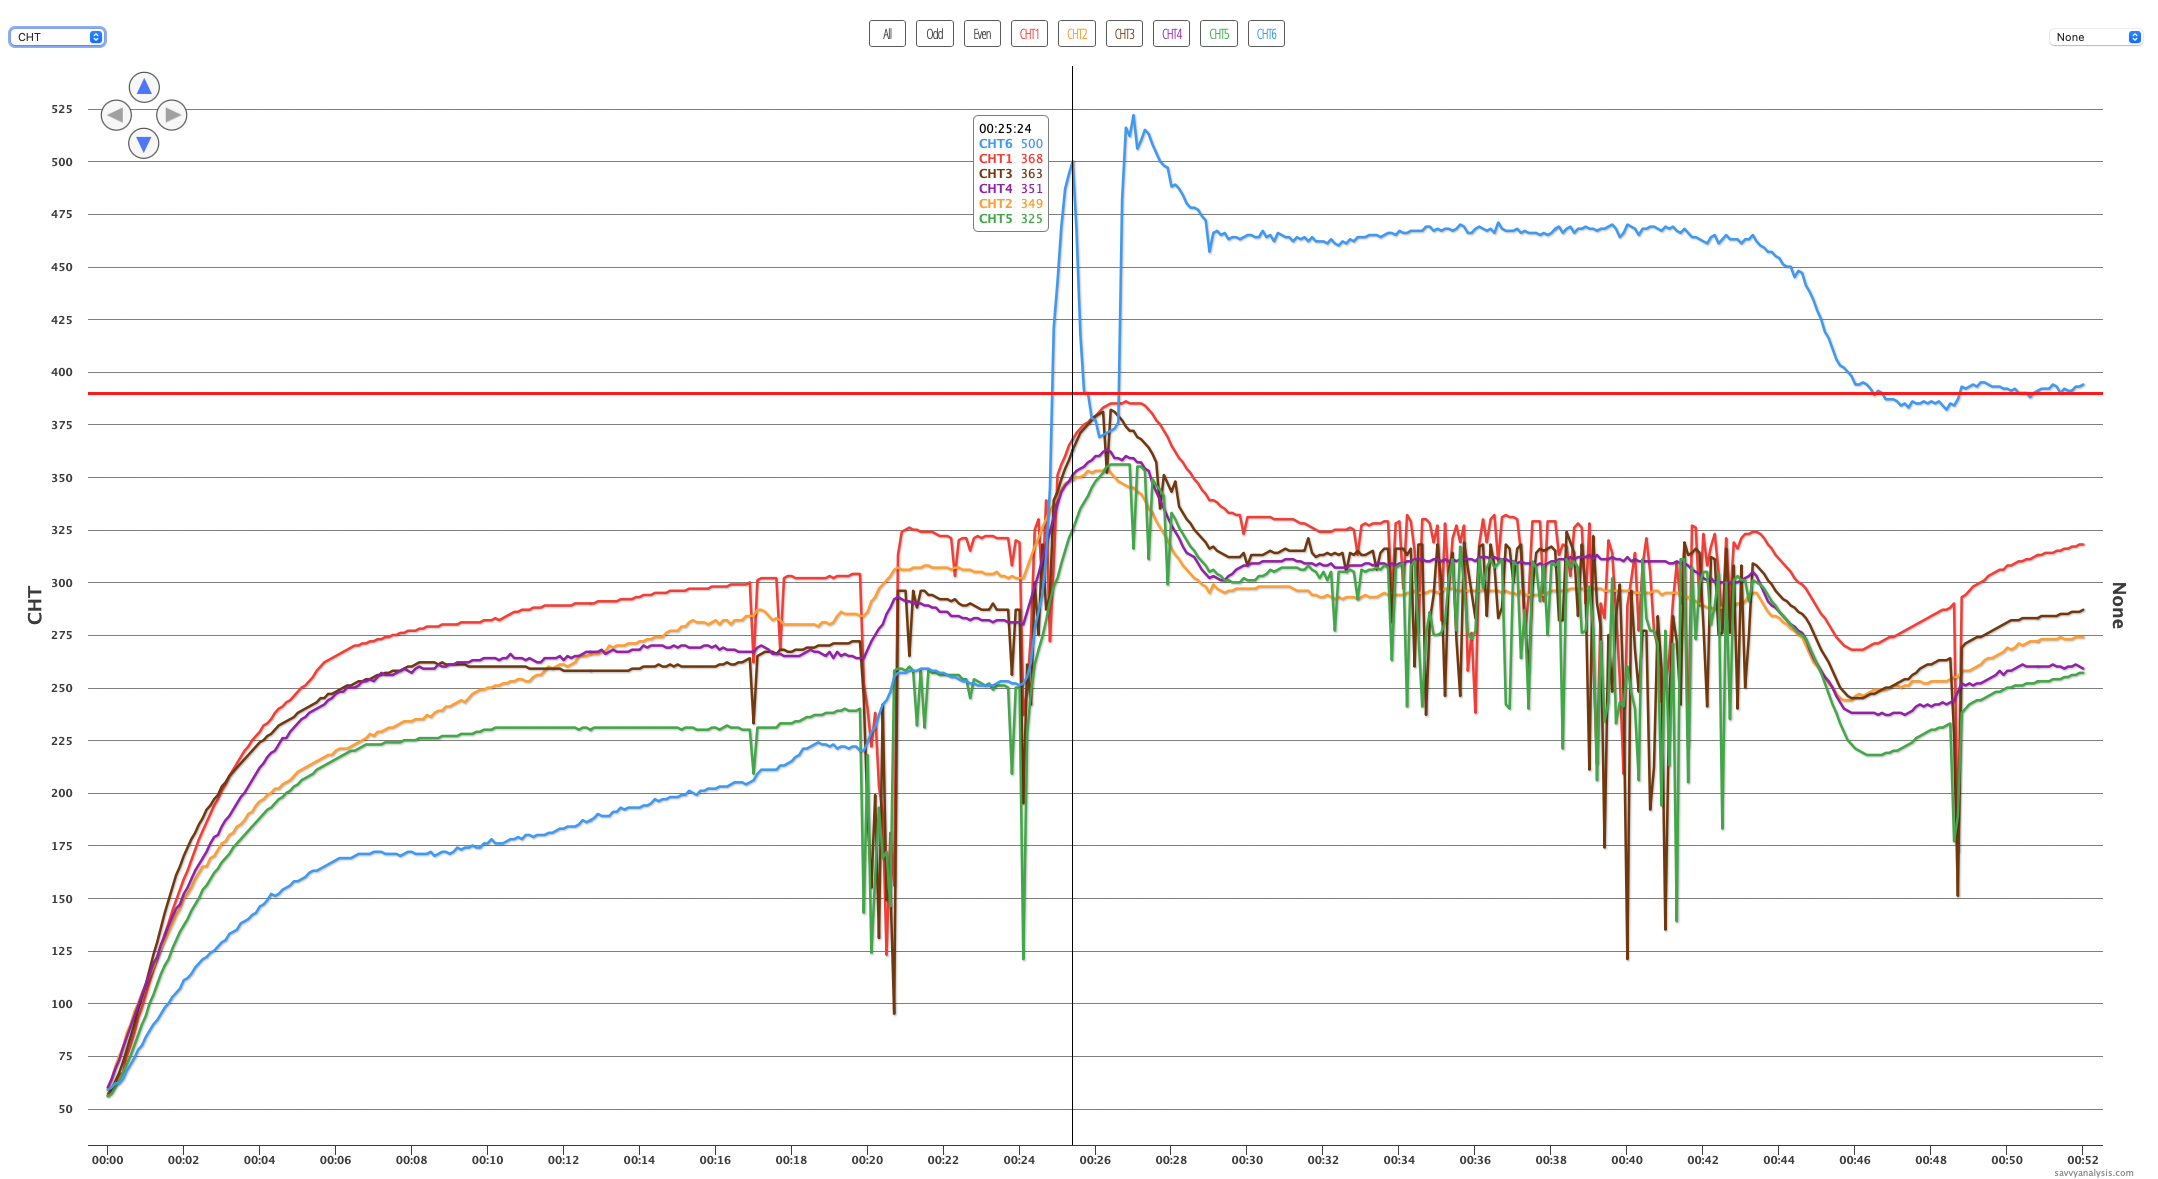
In the first runup at 17 mins CHTs 1-3-5 drop and quickly recover. It’s fast so could be the pilot never saw that one. It’s also uncharacteristic of the thermal mass of a cylinder. Next event is a drop in CHT 1 by itself. Then at 20 mins CHTs 1-3-5 drop and recover again. It’s hard to miss this one but easier to dismiss it as bad data since cylinders don’t shed heat like this. There are a few more blips in the data before takeoff. But so far all the mischief is in the odd cylinders, while 2-4-6 are tracking normally. That’s about to change.
When takeoff power is applied, CHT 6 goes vertical, then drops as quickly, then goes vertical again with a high reading of 522º in the second peak. When power is reduced in the climb all CHTs drop, with CHT 6 displaying about 460º until approach. Meanwhile, CHTs 1-3-5 are also acting up, a little during climb and a lot during cruise. Then just as quickly they settle down during approach, except for one last hurrah from 1-3-5 at 49 mins.
Where to start? Since 1-3-5 are clearly acting as a group, it makes more sense to start by checking signals where they are routed as a group, like through the firewall or at the back of the panel-mounted unit. But we’ve seen enough MIFs that you can’t rule out three loose probe connections – maybe somebody got distracted and didn’t tighten up that side.
Without passing judgment on what this pilot did, feel free to comment on what you would have done after seeing the CHT from one side drop during runup, then seeing one of the CHTs from the other side jump way past the TCM redline of 460º in initial climb. And then stay there at redline.
Next up is a Questaire Venture with a Continental IO-550 and data from a Dynon Skyview with a 1 sec sample rate. The issue was fluctuations in the oil pressure.
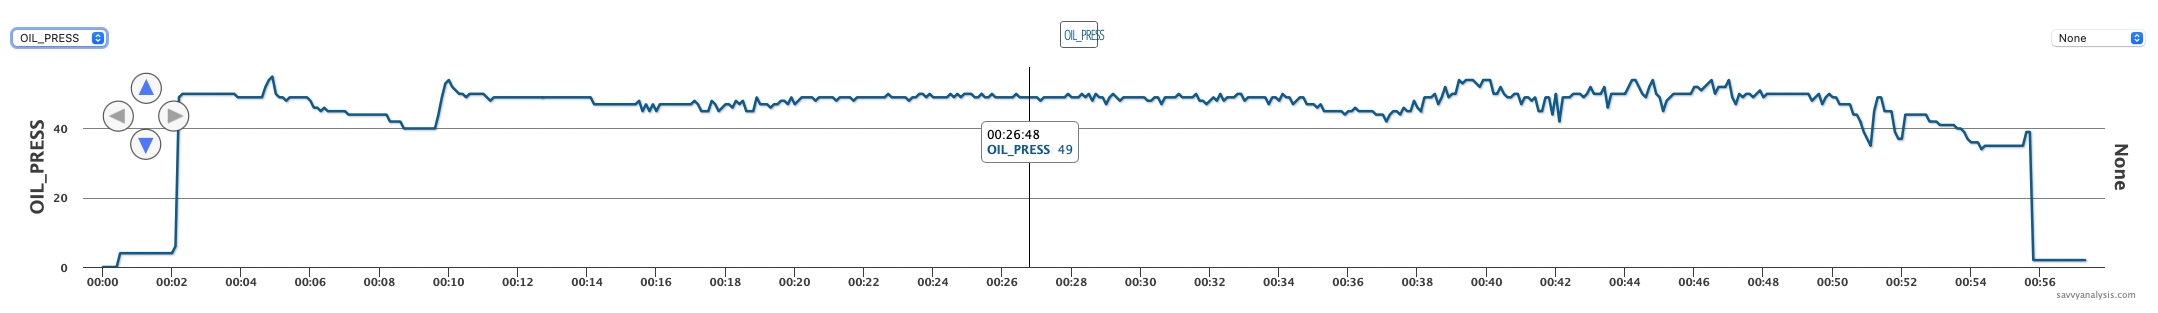
When this started, the owner overhauled the oil pressure relief valve. When it kept happening, he replaced the oil pressure sensor. When it continued, he requested analysis of the data. When we compared flights before and after maintenance, we noticed that the flights before valve and sensor replacement – like the one above – showed fluctuations in flight, and greater as the flight went on, while the post-maintenance flights showed jumpy readings on the ground and smoother readings in flight. Below is a sample of that.
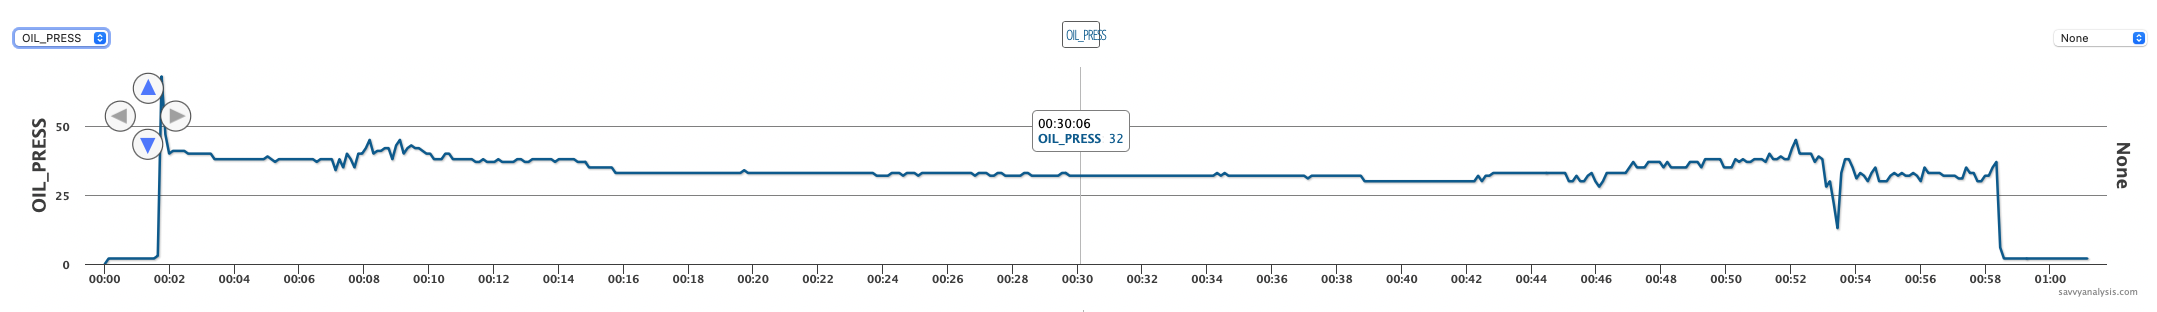
Did you notice that the average reading in cruise is in the low 30s vs the high 40s earlier? We looked at RPM. No significant correlation or change from pre- to post-mx. The only loose correlation we found was with the AMP reading. Here’s a sample of that.
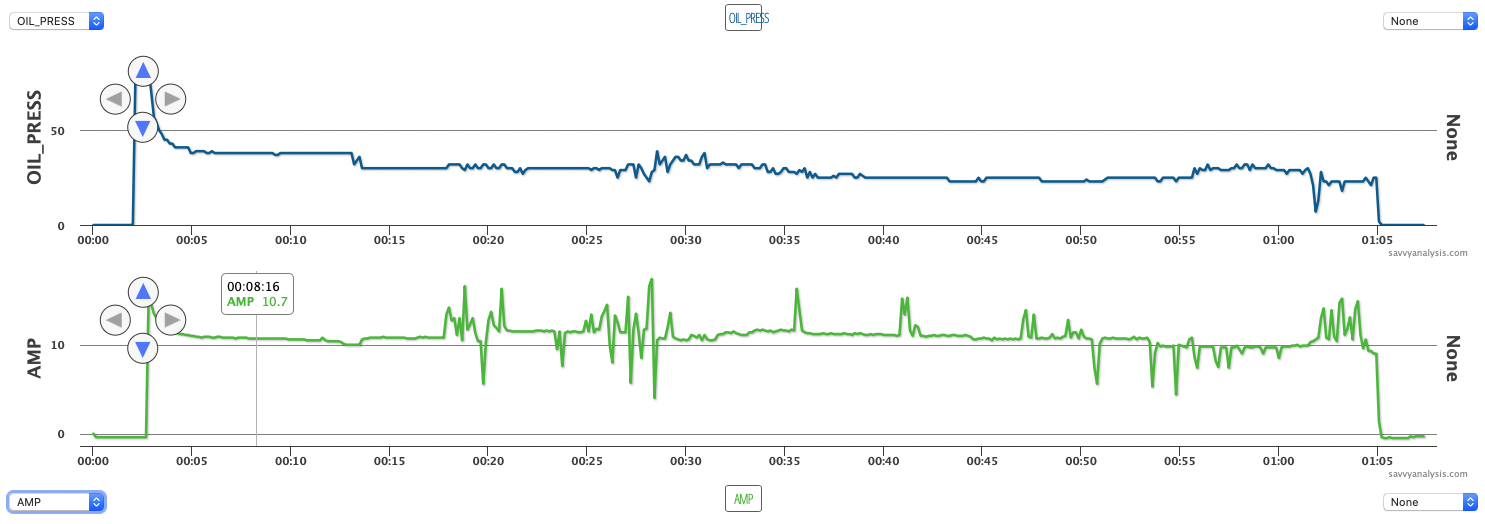
A correlation with electrical data would suggest a sensor problem, a wiring problem or a loose connection. And that turned out to be a red herring. Here’s what our client reported —
It was the oil pressure relief valve itself, although this unit was just overhauled and reinstalled recently. We took the relief valve off, cleaned it and found a strange piece of plastic materials, hair thin about 0.25″ long, although the relief valve was previously cleaned, overhauled and reinstalled, this piece of debris must have been missed, it was not found the first time.
Next is a flight from a Cirrus SR22T with a Continental TSIO-550 and data from a Garmin Perspective with a 1 sec sample rate. EGTs, then CHTs then FF.
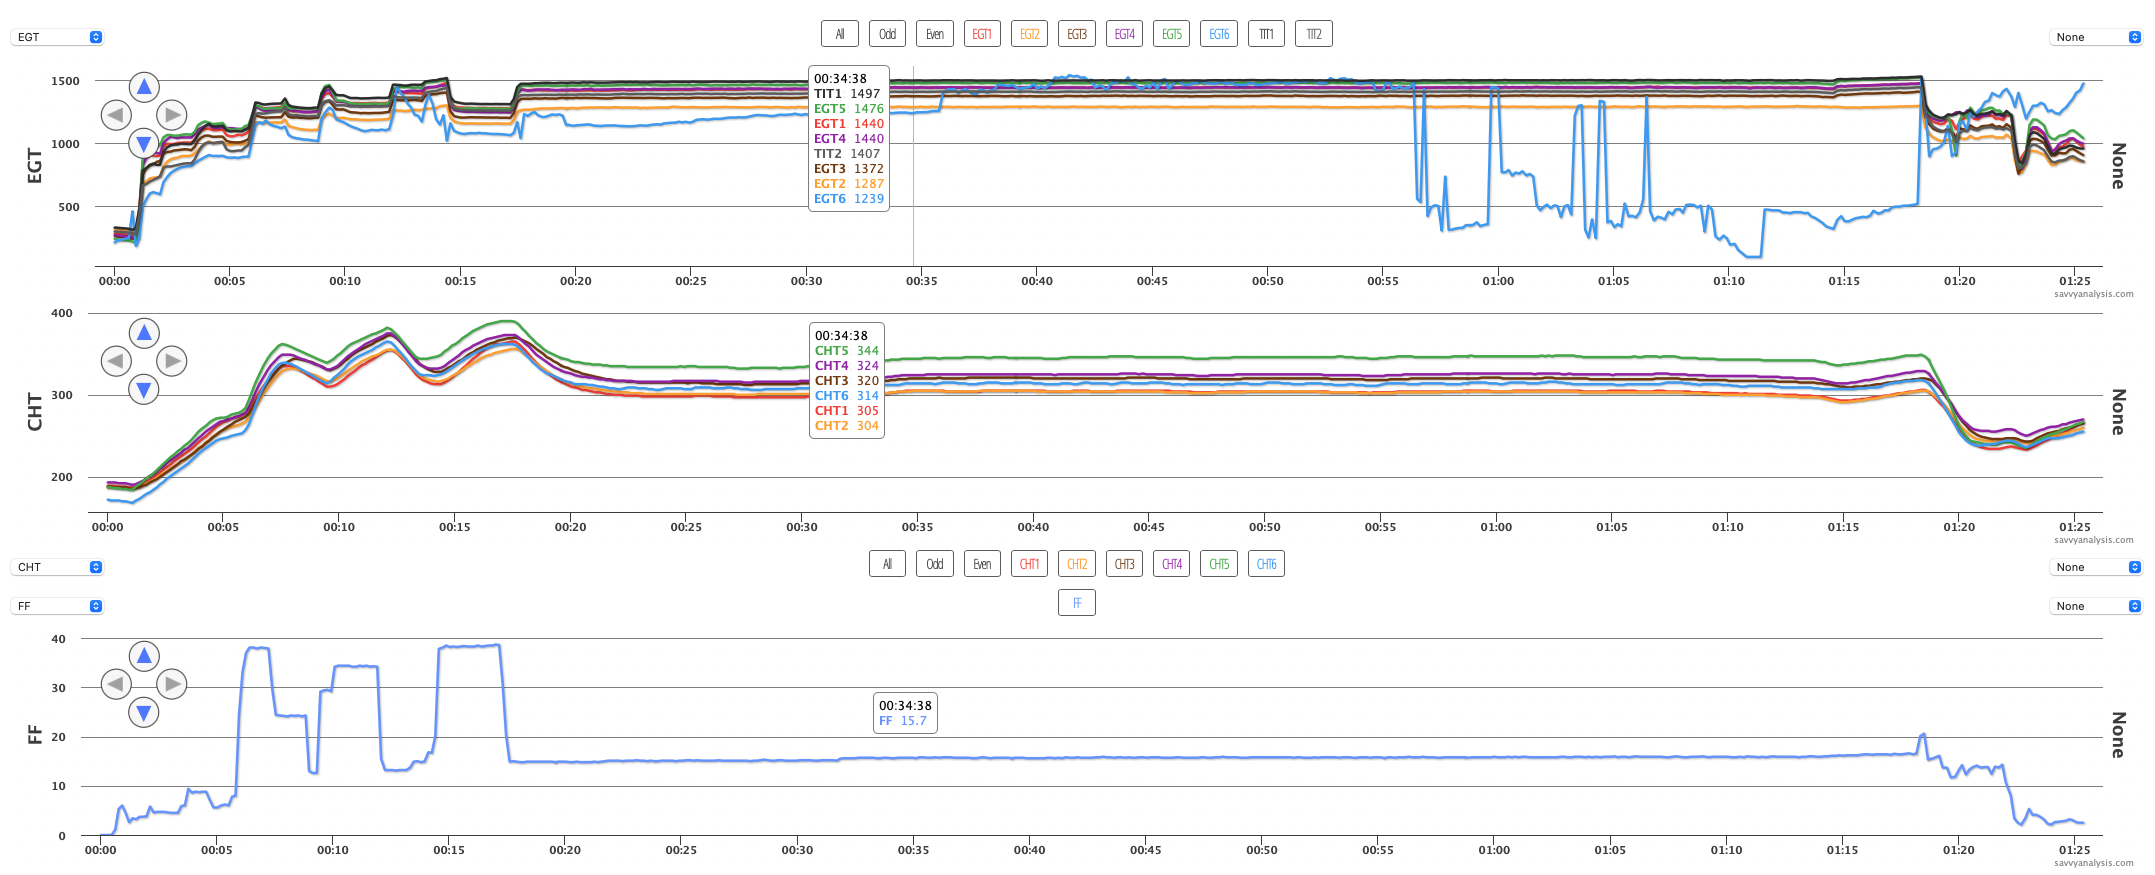
EGT and CHT on the low side might get your attention, but the erratic EGT 6 trace takes the spotlight. To the left of the cursor it’s low and steady, although increasing. To the right of the cursor it’s in the same range with the others, but jumpy. Then at 56 mins it’s bonkers. CHT 6, meanwhile, is normal although there’s a small wavy pattern throughout that other CHTs don’t display. We asked about roughness and there was none. FF which is shown and RPMs and MAP which aren’t shown didn’t offer any clues. Steady and normal throughout.
So it looks like a failed probe, but only because we have the huge jumps in the data. If the pilot had landed at 55 mins, it’s not as clear.
See you next month with more interesting data.
