Last October I mentioned Eastern Airlines flight 401, which crashed into the Everglades in 1972 because all three crew members were fixated on a failed landing light. I first read about the importance of that flight, and so many others, by reading books and columns by Richard L. Collins, who we lost in April. I think I’ve read everything he wrote at least once.
Before he installed an engine data monitor in his beloved P210, Collins saw the value in tracking engine parameters and printed up blank sheets for his lapboard. Here’s a screenshot from the 01:19 mark of his Engine Management video for Air Facts.
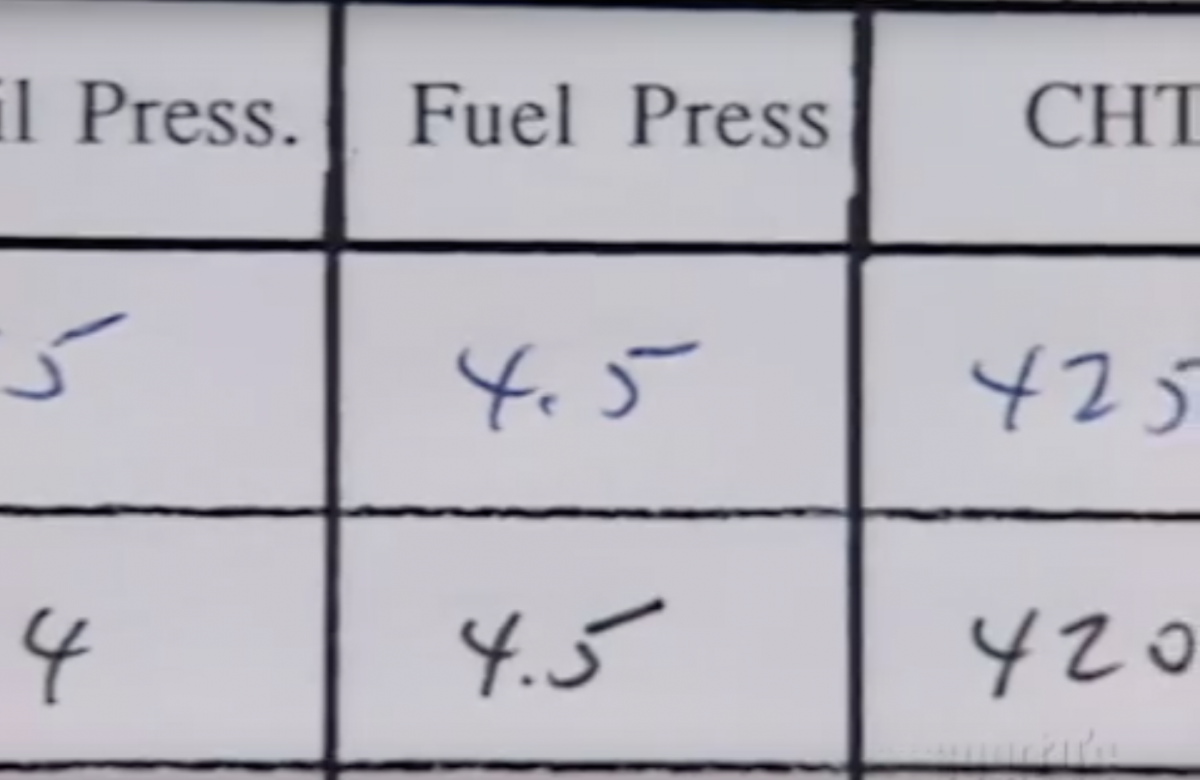
Yeah, that CHT of 420-425º got my attention, too. I’m willing to give him the benefit of the doubt and suppose that it was the highest reading of the needle on an old Alcor one-at-a-time CHT gauge. And since this was pre-digital data gathering, it was pre-GAMI and pre-resurgence of LOP cruise, when TCM’s CHT redline of 460º was unchallenged. And I’m not positive these numbers are from N40RC – the P210. The higher oil pressure number from a few frames earlier suggests it might have been from the Lycoming engine in his Cardinal RG. Anyway, he was doing post-flight and trend analysis while I was still learning turns about a point.
I did have lunch with him once – at Oshkosh – and told him what a fan I was, which I’m sure he heard a hundred times a day. I never flew with him, although when you read his work you feel like you’re up there with him. He said matter-of-factly, without bragging or apologizing, that his formal education ended with graduation from high school in the woods of Arkansas. But if ever there were a life-long learner, it was Dick Collins. So thanks, Professor, for setting the bar high for writers and for pilots and for leaving a body of work that we can continue to learn from.
Now let’s see what we can learn from this month’s data. I don’t have data from N40RC, but I do have data from a Cessna T210 with a Continental TSIO-520-R and data from an Electronics International MVP-50 with a 1 sec sample rate. EGTs are on top, MAP below that and FF below that.
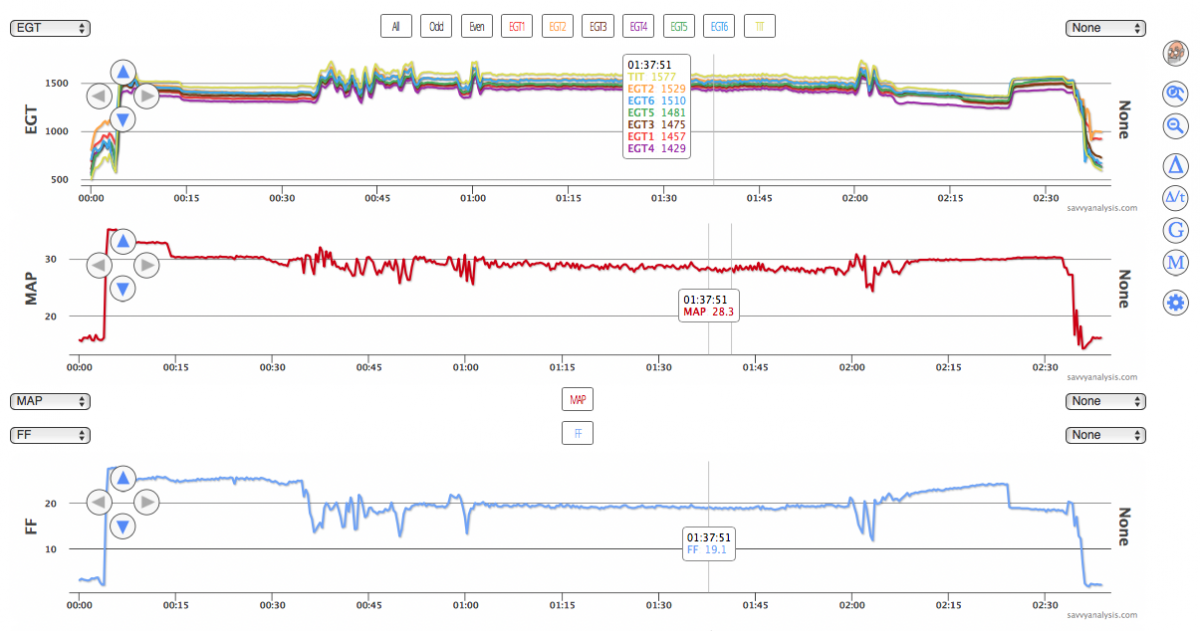
There’s nothing special about the cursor placement in the screenshot – I just wanted to get it out of the way of the action. MAP is ok at takeoff and through the climb. Then there are a series of adjustments from about 30 mins to the 1 hour mark. For a long time, the pilot had only seen high TITs in a narrow range right around peak EGT – 15.5 – 15.8 GPH – then the turbo controller was overhauled, the entire exhaust system was replaced, and after that he was seeing redline TITs between about 14 and 17 GPH.
Inspection revealed a broken hose clamp on the output side of the turbo compressor. The new clamp slipped off in the next flight, so they replaced the round clamp with a V clamp. That clamp stayed in place, but the engine wouldn’t maintain MAP in the climb. Next they discovered missing screws in the intercooler and replaced them – no change. Then they found two things that were corrected simultaneously. First was a loose fitting on the fuel line that controls MAP, and second was a couple of pinholes in a turbo controller line. Once those were corrected, the airplane performed normally again.
Pre-repair, the wastegate was in a more closed position, but MAP didn’t rise because he was retarding the air intake using the throttle body. That resulted in higher back pressure and lower detonation margins, which the data doesn’t measure. This probably would have resulted in a lower critical altitude, but the relatively short hops of the project at the time didn’t get the airplane high enough to reveal that part of the problem.
Next up is data from a Cessna 182 with a Lycoming IO-540 engine and data from a JPI 930 using a 6 sec sample rate. EGTs on top, CHTs below that, FF and RPMs below that and oil temp on bottom. Again, nothing special about cursor placement, just moving it out of the way of the event at the 15 min mark.
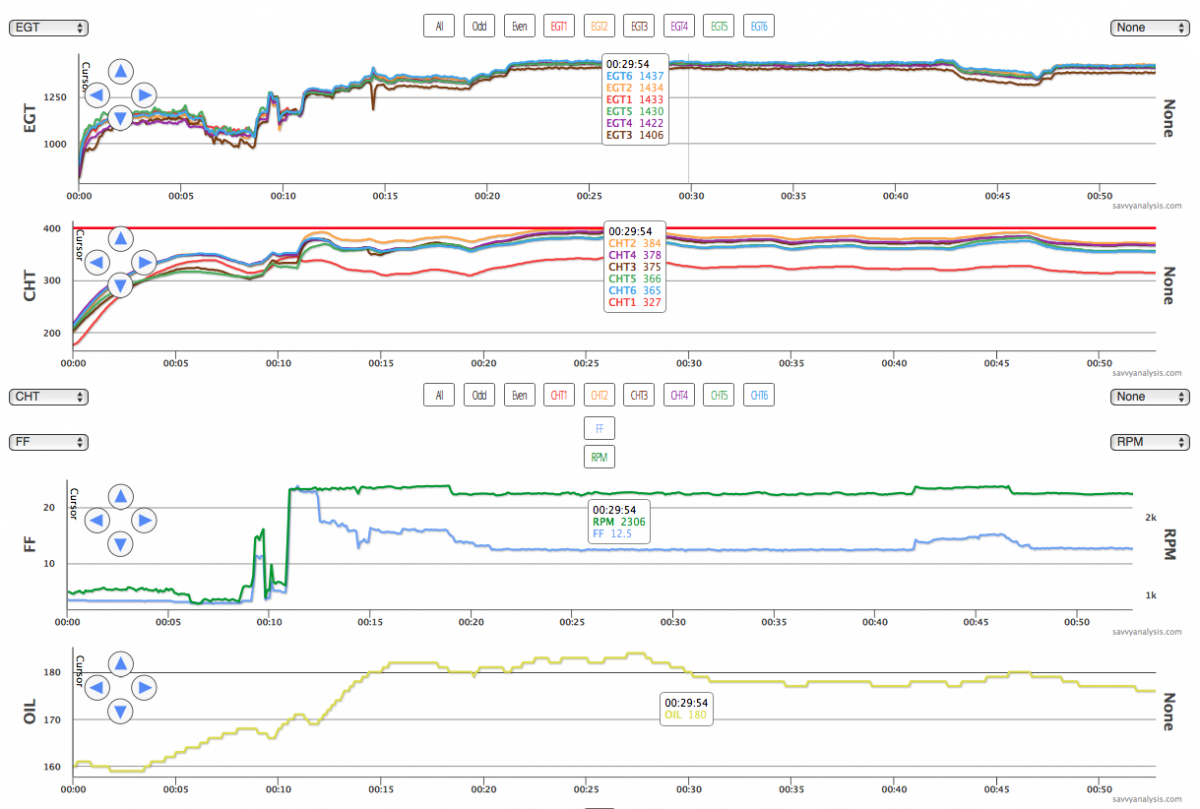
Let’s tackle the elephant in the data first – CHT 1 is a gasket probe that tracks low throughout. The issue isn’t CHT 1, it’s cylinder 3. EGT 3 is a little low during ground ops, including the mag check, but joins the pack when takeoff power is applied at about the 11 min mark. When FF is reduced in the climb, all EGTs rise a little as expected. Oil temp was 170º at takeoff, and rises a little in the climb. Then, just shy of the 15 min mark, EGT 3 drops, corroborated by CHT 3, and FF and RPMs drop for a moment, too.
After the event, CHT 3 looks normal, but EGT 3 tracks low until the end of the 2 hour flight. I zoomed into this half of the flight because nothing different happens later and I wanted a better picture of the event. Putting our puzzle-solving hats on, does it look like a clogged injector ? EGT is low but CHT isn’t. Also, the EGT doesn’t change much as FF is reduced from its intermediate setting where the event took place to its lower cruise setting. Weak spark should send EGT higher, not lower. Magneto problem ? Not likely because a mag should effect all cylinders – not just cyl 3.
Upon landing, they noticed an oil leak, traced it to the cyl 3 push rod area, and noticed a bent push rod. So that downspike in EGT 3 was the valve sticking – enough to bend the rod – and the subsequent lower EGT is because the valve was closing a little earlier than normal, because the bent rod was shorter than spec. You’d have to be staring at the 930 to notice the quick drop and recovery of FF and RPM, but you might catch – or the JPI might alert you – that EGT 3 dropped when the other EGTs rose, or that EGT 3 is now lower than it was. The 6 sec sample rate isn’t helping us here – our recommendation for JPIs is 2 secs. If you download your flights regularly, then use the 1 sec setting, but your card will fill up twice as fast.
Next up is data from a Cessna 400 Corvalis with a Continental TSIO-550-C and data from a Garmin G1000 using a 1 sec sample rate. EGTs on top, CHTs below that, then FF and GPS altitude below that. This is two quick trips around the pattern with about 7 mins in-between.
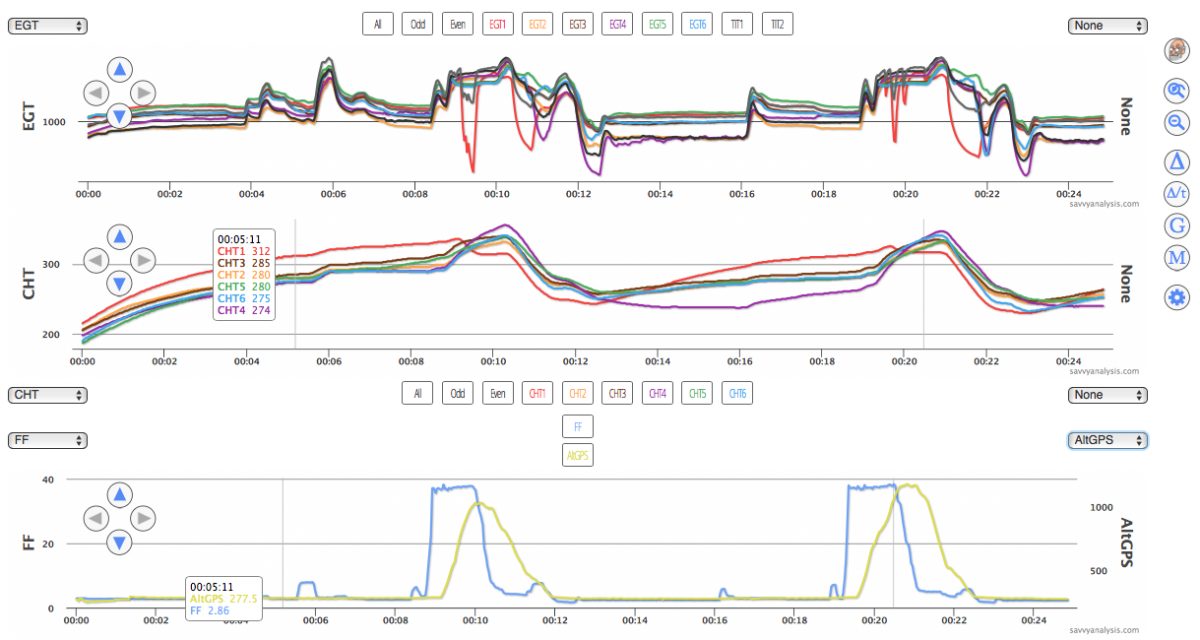
Let’s take it from engine start. CHT heats up faster than the others, but it’s not in a range where you’re worried, and EGT 1 looks ok. So you apply takeoff power, and after liftoff EGT 1 is erratic, normal, then erratic again. CHT 1, which had been hot, is now coolest. You come back and land.
CHT heats up again, as it did in the first ground run, but still not in the worry range. EGT and CHT 4 are now lowest, but EGT 1 isn’t erratic anymore, so you launch again. And again, after it’s too late to abort EGT 1 is erratic again. So you come back and land again , upload your data and request analysis.
Erratic data like EGT 1 could be a failing probe, but that doesn’t explain the CHT 1 rises and drops. Like the man in the commercial says, “We’ve seen a thing or two…” and last year we had a case of an erratic EGT like this that turned out to be a broken valve spring. But you couldn’t rule out a broken rocker arm. Before posting that for our client I wanted to get the thoughts of other analysts. Just when I was ready to suggest pulling the valve cover and inspecting the valve train, the client posted that inspection had discovered a broken valve spring.
Once you know the answer, the data makes sense. At idle, CHT was rising because the valve wasn’t efficiently removing the exhaust from the barrel. Under power, the valve wasn’t closing at the right time in the suck-squeeze-bang-blow cycle, so with less power generated, CHT 1 dropped.
If this happens to you, let’s hope it happens close enough to an airport that you can reduce power and land. As Professor Collins said in his Air Facts blog from last August, “I flew for 57 years and 20,000 hours without declaring an emergency. But I did always encourage pilots to say one of the magic words if he felt like he needed whatever help might be available in case something was going awry.”
