Apparently the 80/20 rule is also known as the Pareto Principle. Broadly applied, it means that 20% of your activities will account for 80% of your outcomes. In my previous careers in advertising and education, I would contend that 80% of stuff I spent my time on were caused by 20% of my ad clients – or students. After nearly ten years of reviewing engine data, I’d say about 80% of our tickets are either fuel issues, spark issues or bad sensor data. That’s good news for our clients, because both are relatively easy to fix, and good news for SavvyAnalysis because those are usually easy to spot and we can deliver a quick and accurate diagnosis. But when the Puzzler deadline rolls around each month, it’s the other 20% that are usually more interesting to write about.
This month we’ll look at data from a Piper Saratoga, an RV-6, a Cessna 414, and a Cessna 182.
First up is data from a Piper Saratoga with a Lycoming IO-540 engine and data from a JPI 700 with a 6 sec sample rate. Even though the older JPI’s shipped with a six second sample rate, we advise clients to reset that to two seconds so that we can get more granularity in the data. EGTs on top,, then CHTs and FF below.
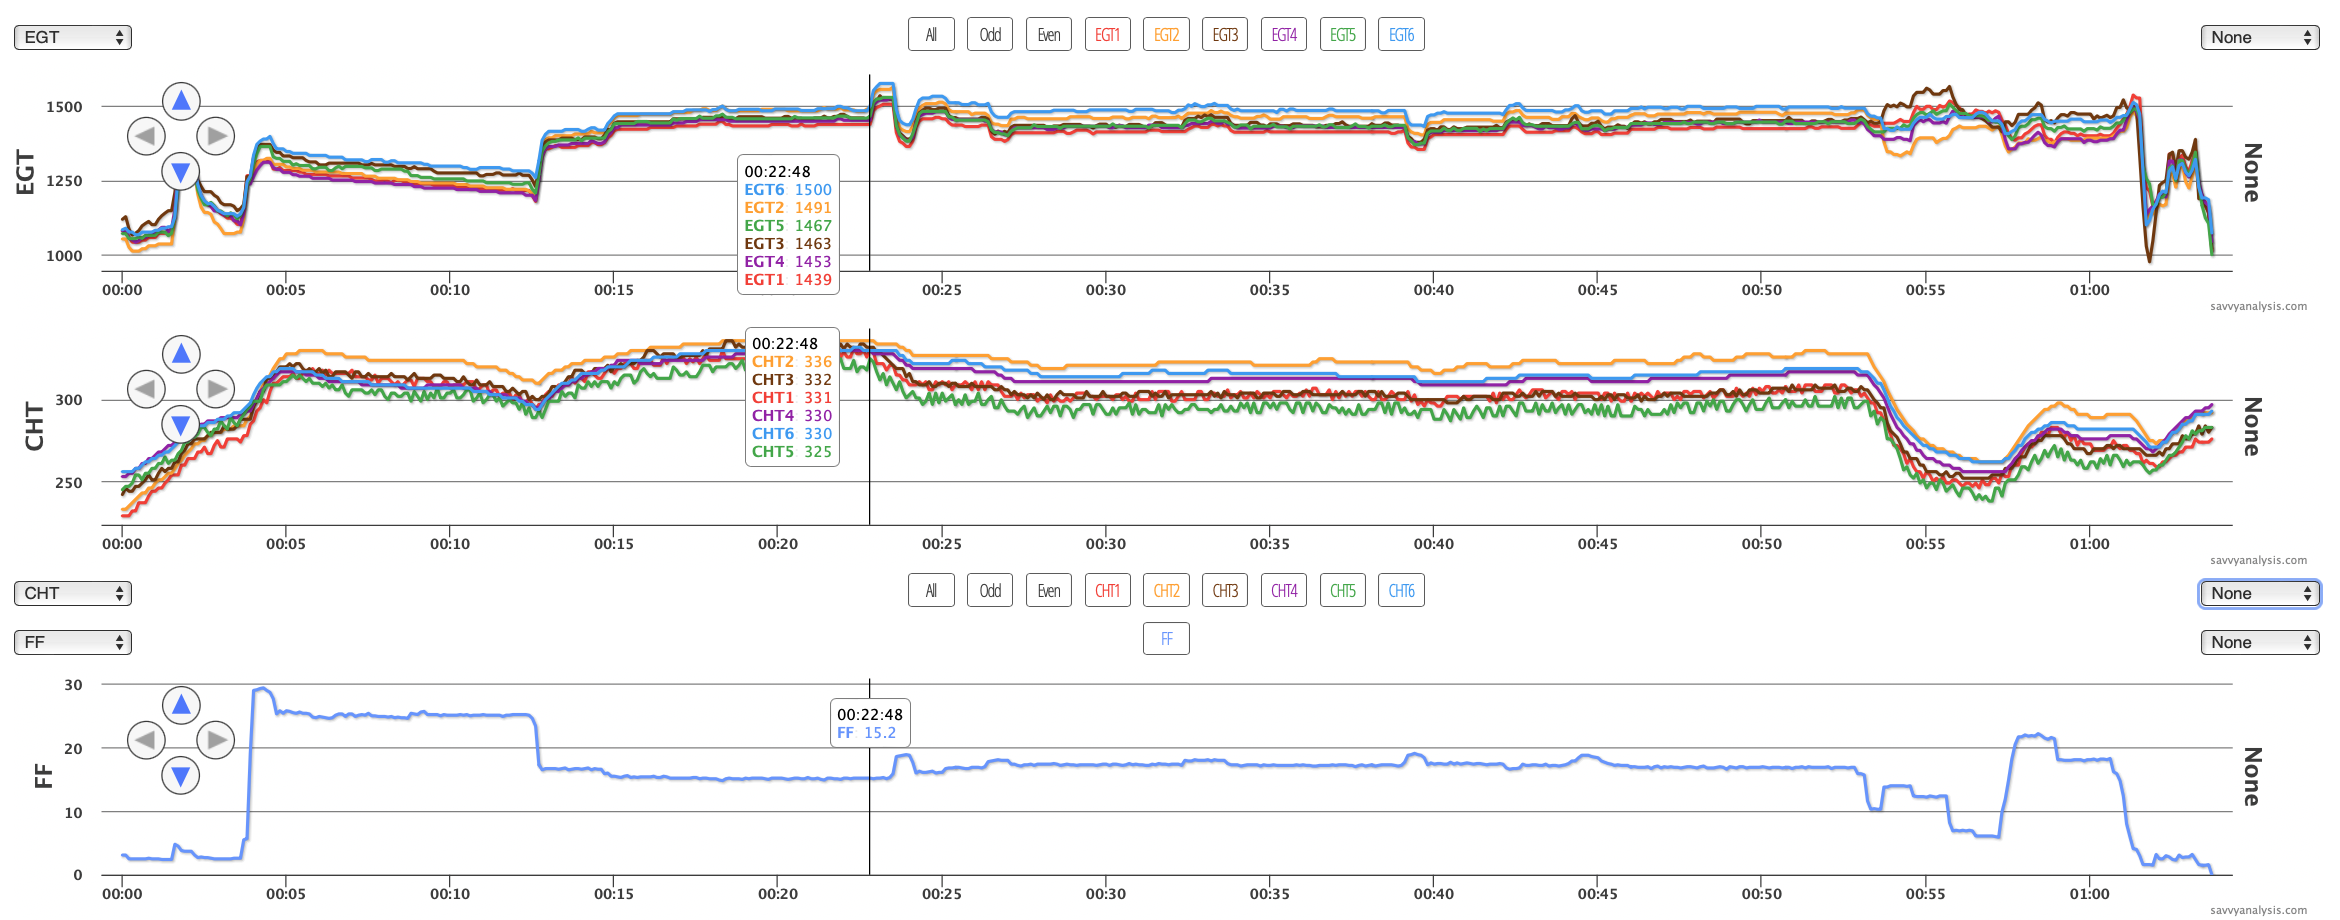
Cursor is on the rise in all EGTs. RPMs and MAP are not logged, but there’s no pilot-commanded change in power there. EGTs just shoot up. Let’s zoom in. Here’s the same data zoomed in from 20 to 30 mins.
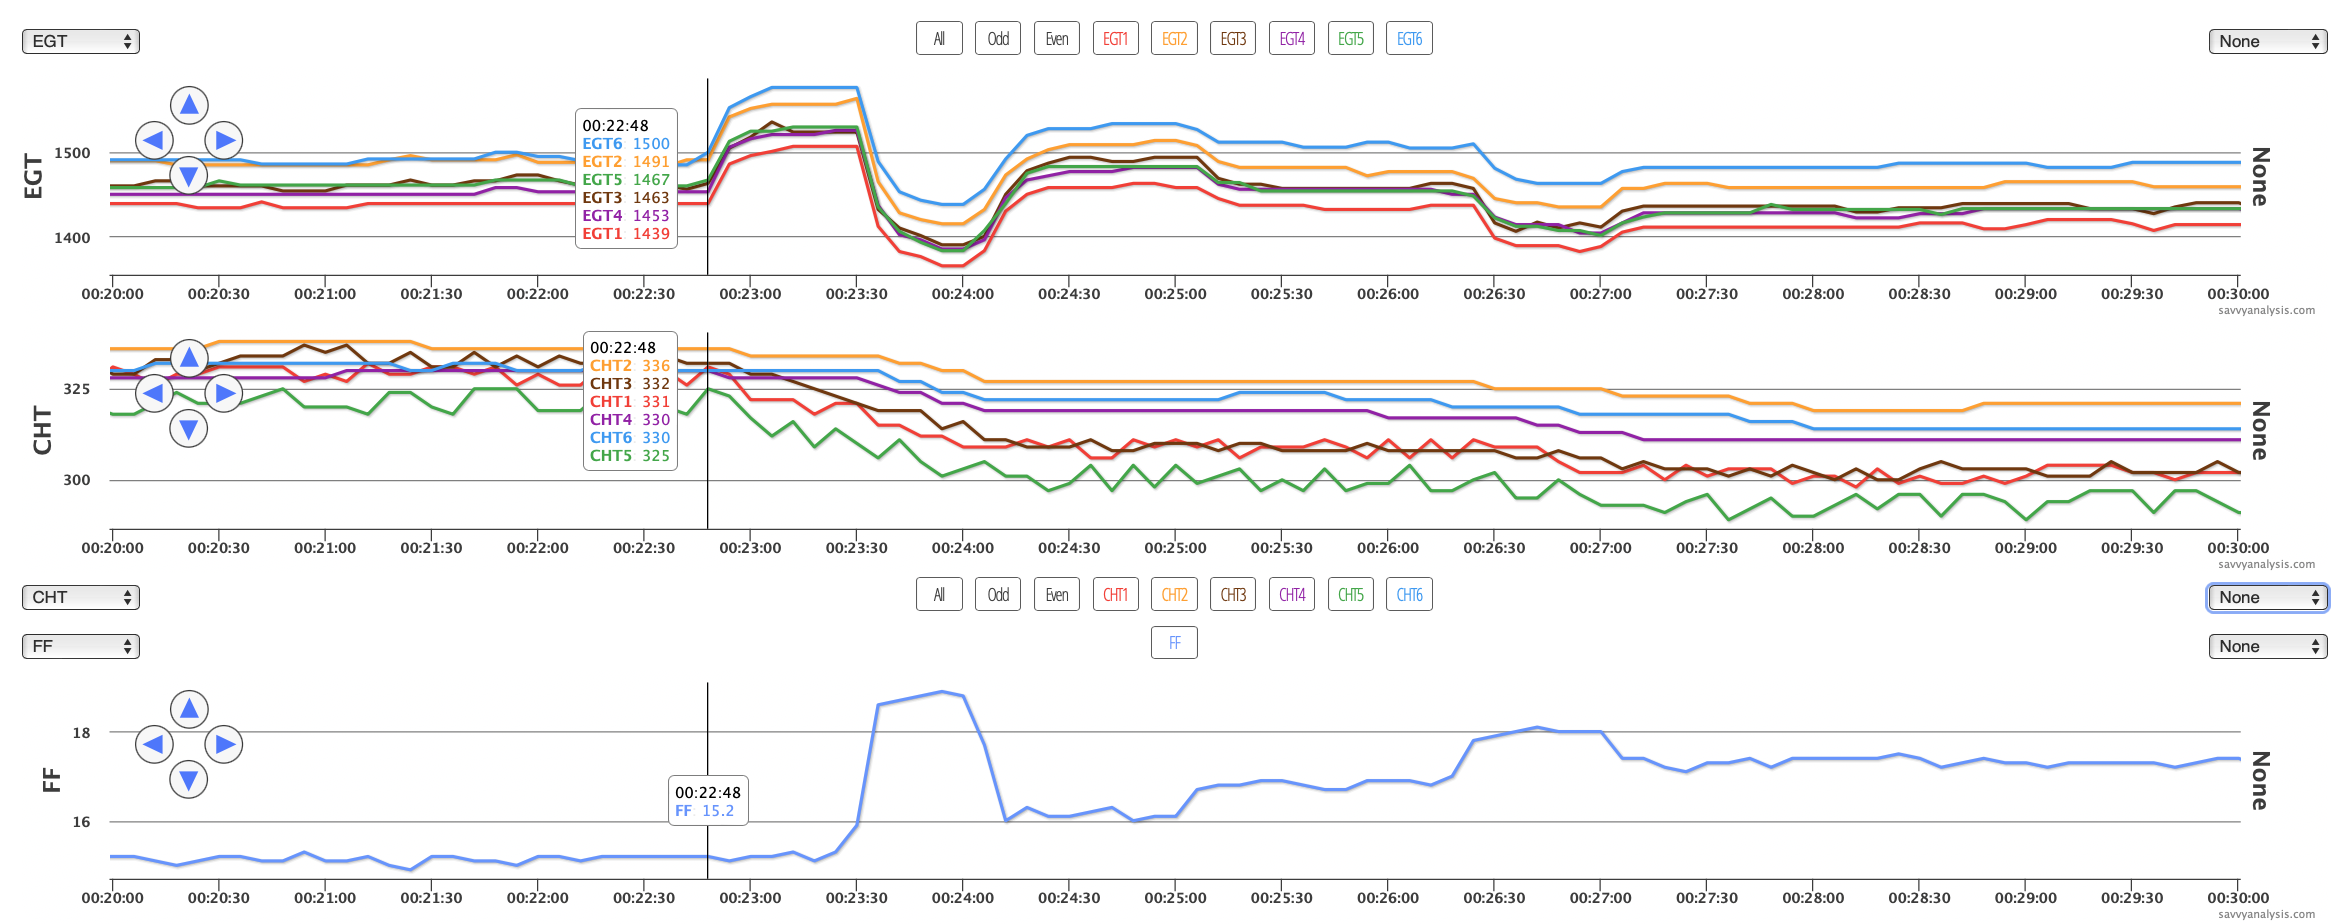
EGTs rise, the pilot adds FF in response causing EGTs to fall below their original point, then the pilot reduces FF and EGTs get back to about where they were initially. Are the sawtooth patterns in CHT a clue? Did you notice that the traces for 2-4-6 are stable, and the sawtooth is on 1-3-5? And it’s there from engine start until shutdown. So we think that’s electrical interference on the 1-3-5 side and unrelated to this jump in EGTs. But we think there is a clue in CHTs because all six of them drop to the right of the cursor – as EGTs rise.
If just one EGT rose about this much we’d consider a failed or fouled plug. But can all 6 plugs fail or foul at the same time. Yeah, but only if the mag fails.
Subsequent inspection revealed that’s exactly what happened. It’s interesting that there’s not a preview of coming attractions – no hint of impending failure. Just poof and it’s offline.
Next is data from an RV-6 powered by an Aero Sport IO-360 engine and data from a GRT 66R with a 1 sec sample rate. The issue was oil temp so here’s a graph of EGTs, CHTs, FF and oil temp.
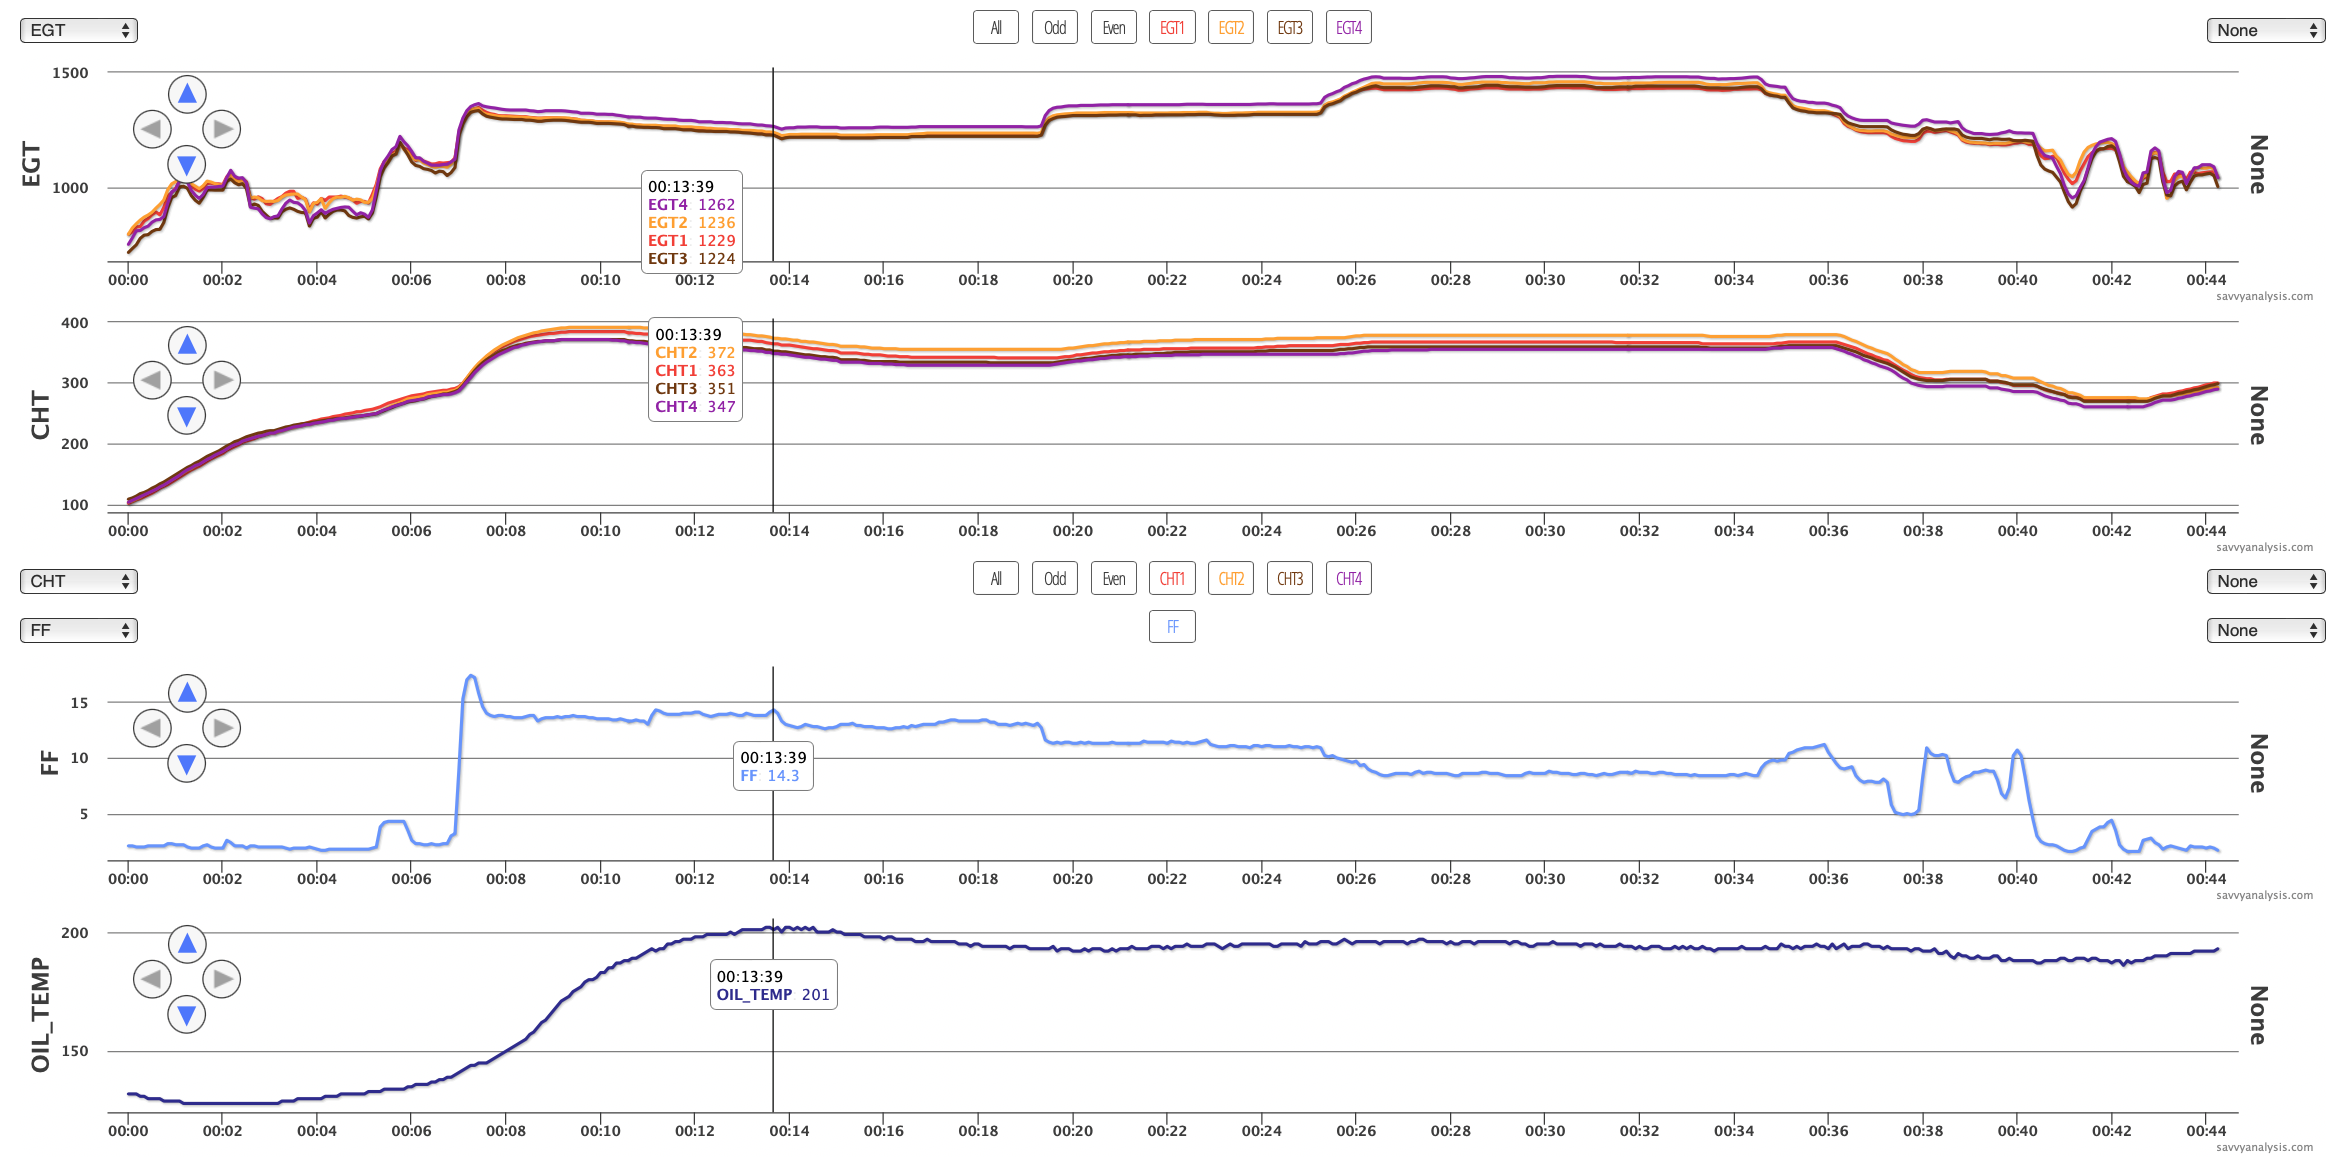
A peak of 201º isn’t bad – we want oil temp to get to at least 212º somewhere in its travels to burn the moisture out of the oil. But this was a higher oil temp than this owner/builder/pilot was used to seeing. If the vernatherm is working properly, we should see oil temp get to a number around 190-200º and then see a drop in oil temp as oil travels through the oil cooler. We weren’t seeing that in recent flights so we suggested bench checking the vernatherm.
This client was very comfortable borescoping the vernatherm seat – which checked out ok – then pulling the vernatherm and checking it using boiling water. It failed the water test, so he ordered a new one. Then he took a step which many of us would have skipped, but he water-tested the new one. It passed, so he installed it and temps immediately improved. (Here’s a puzzler devoted to vernatherms.)
Next up is data from a Cessna 414 Chancellor powered by RAM TSIO-520 engines and data from a JPI 760 with a one sec sample rate. Here’s the flight with the problematic right engine and the cursor is on the event.
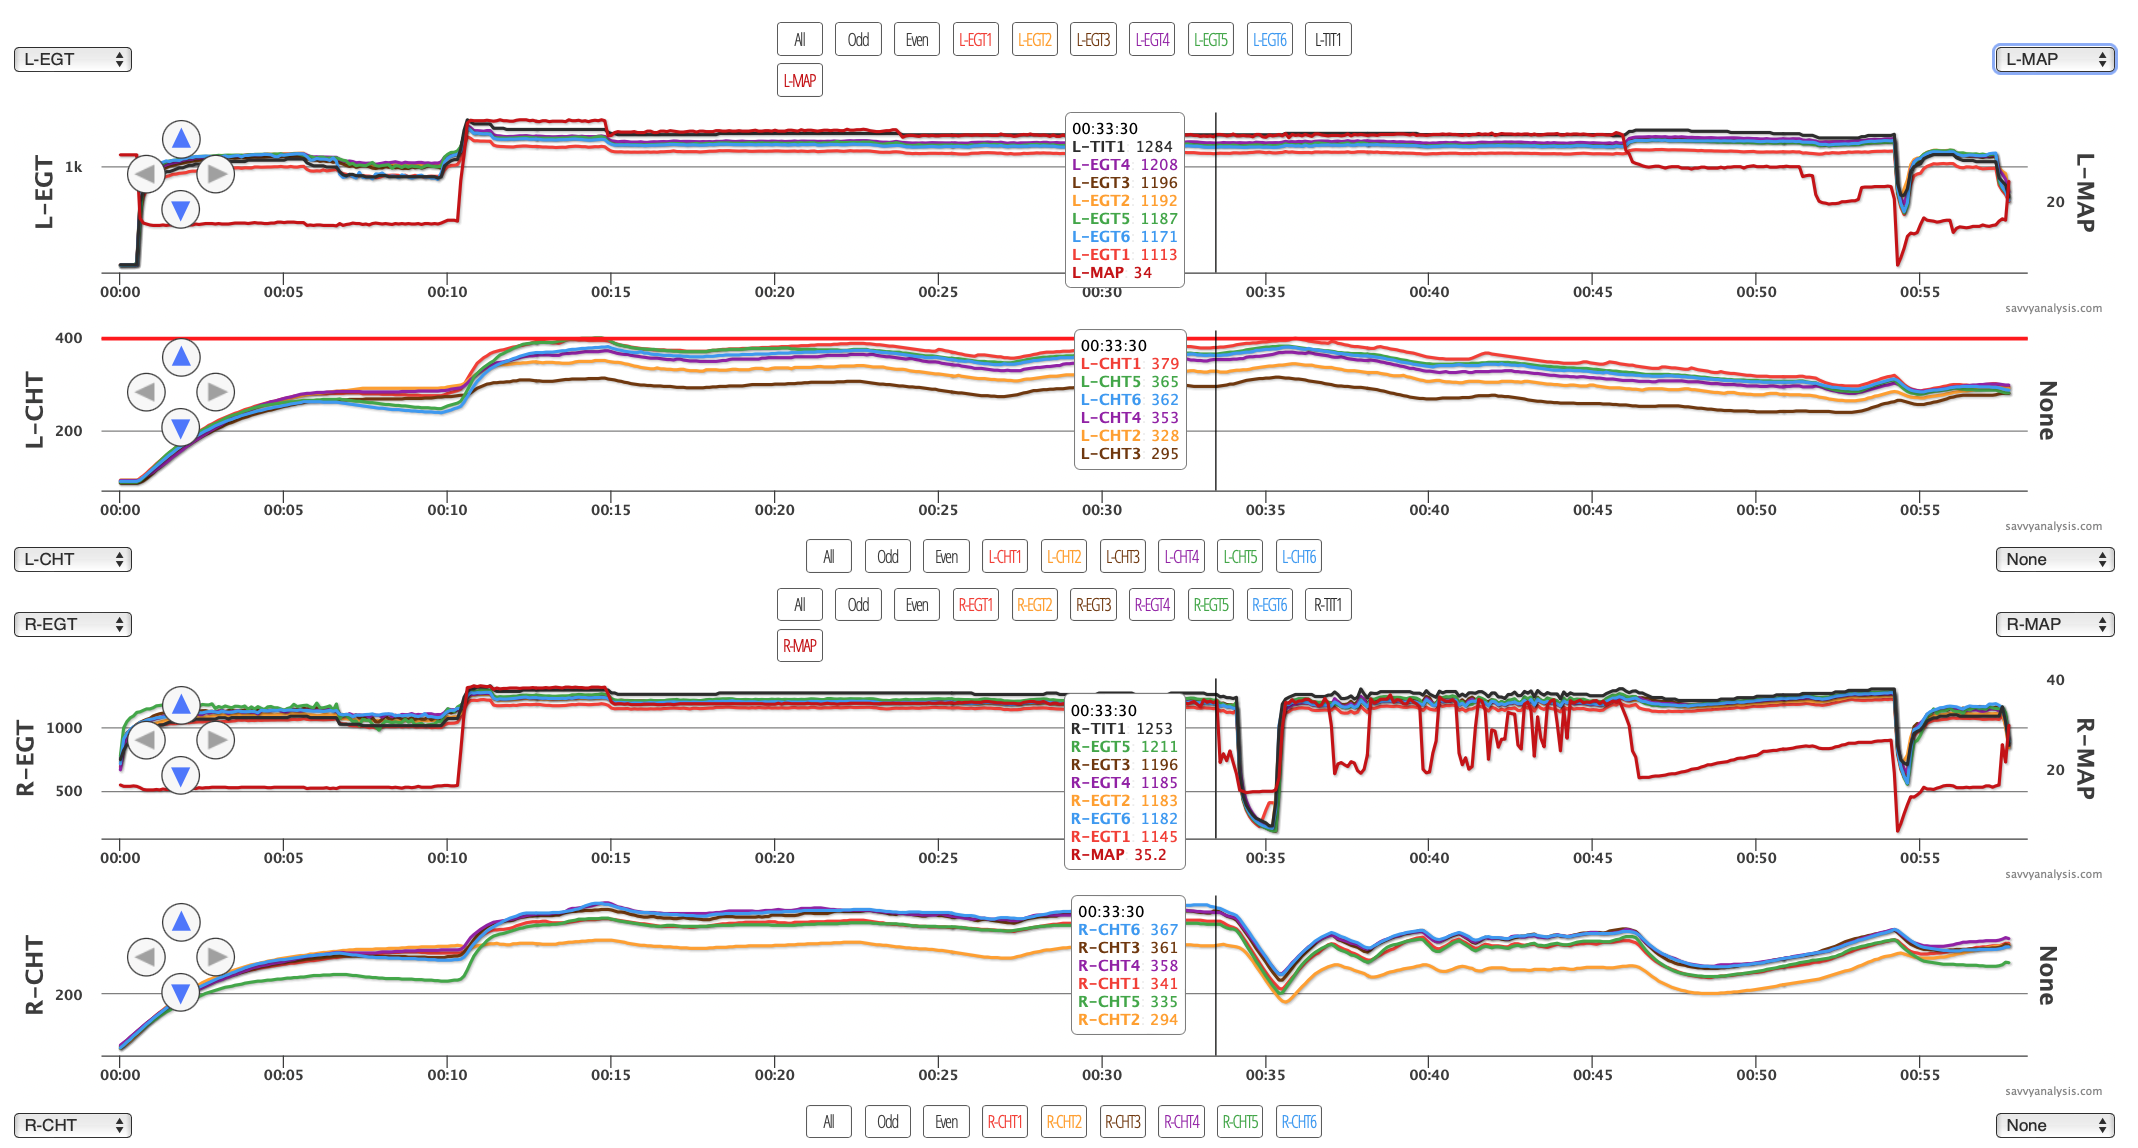
With that overview, let’s zoom into the R engine once starting about 14 minutes before the event. Altitude is not logged but the pilot reported that this happened during a climb at around 19,000 msl. Here’s R EGT and R MAP.
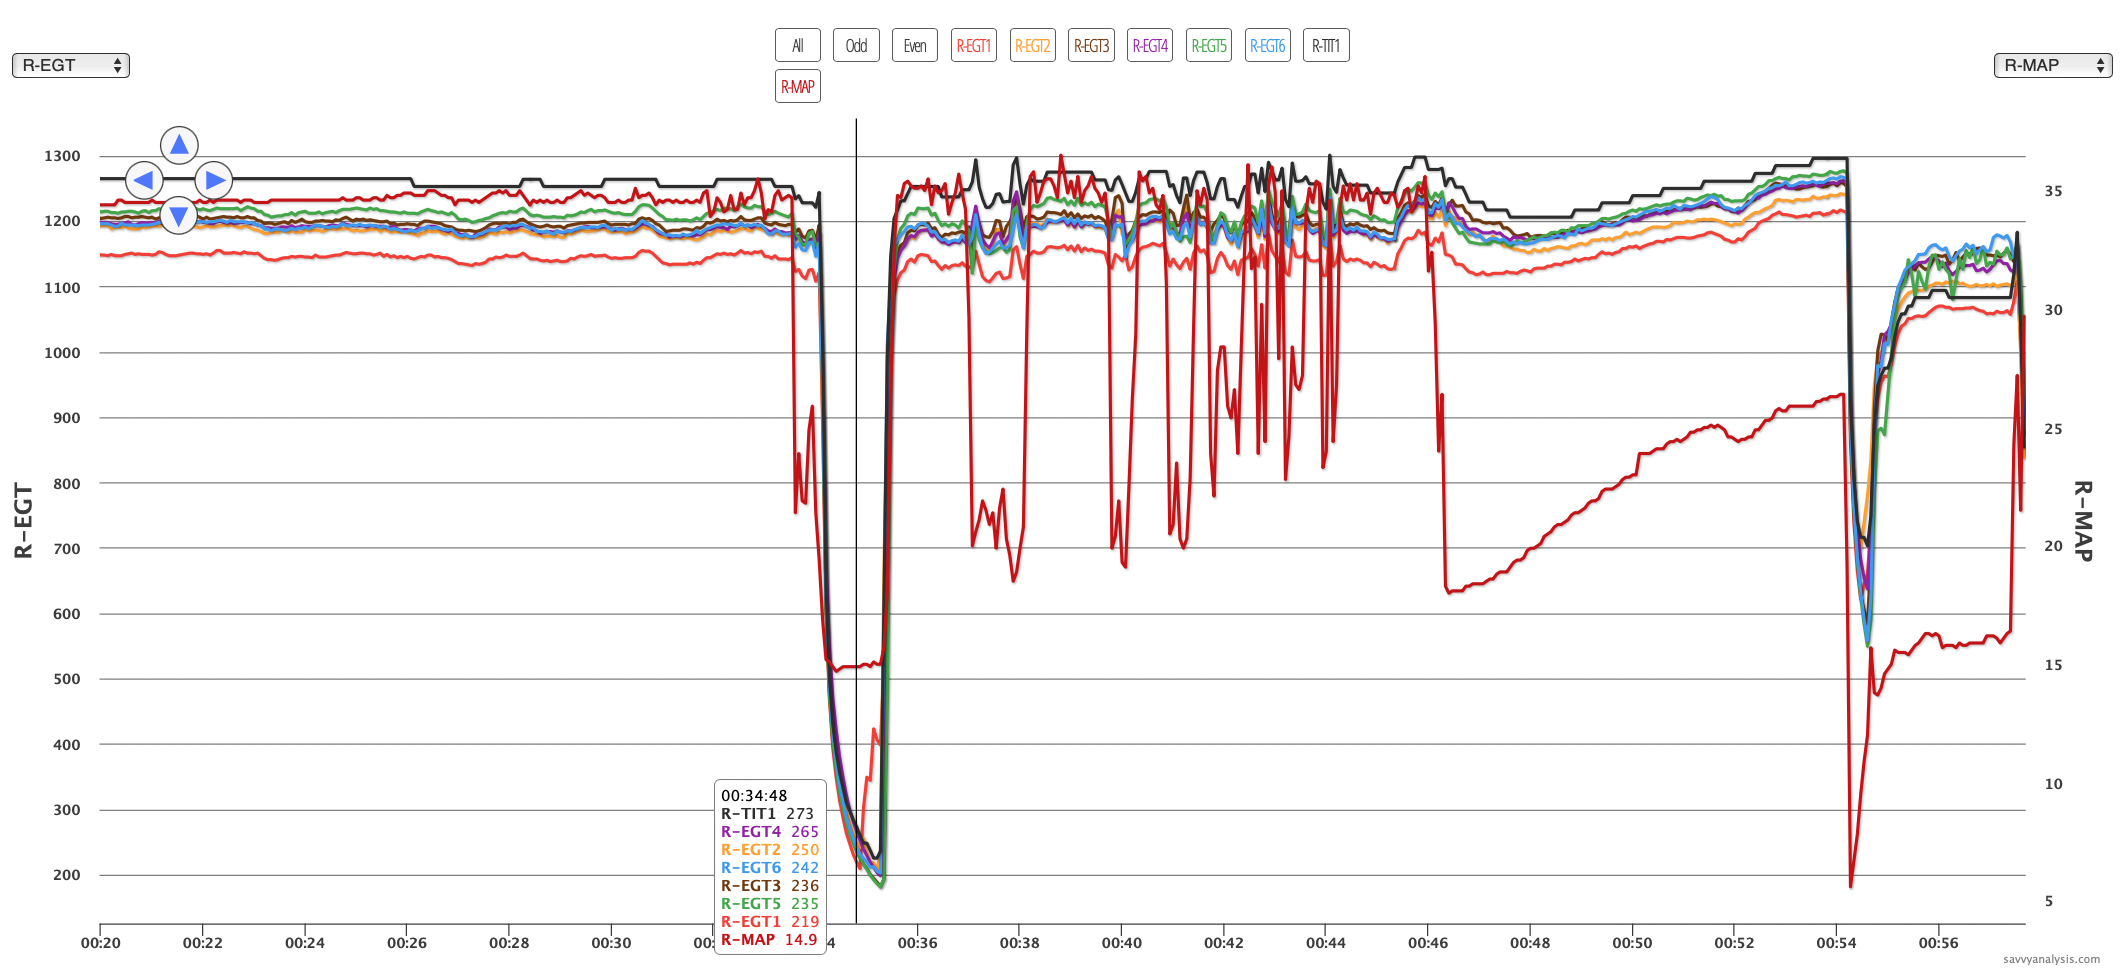
Starting around the 16 min mark, MAP starts to oscillate a little, and EGTs follow. Curiously, TIT has a couple of ups and downs, but isn’t following the MAP and EGT patterns precisely – although in that 26-30 timeframe when MAP drops, TIT rises a little. Then for about a minute, MAP fluctuates faster, then it drops, and drops again. Here’s what the pilot reported —
On the above flight I lost power on the right engine at 19000 ft while climbing. Engine responded to boost pump temporarily. The engine surged back to full power several times until it stablized at about 24 inches MP. Changing tanks did not affect the function.
We wondered if the big jumps in MAP were pilot-induced. Here’s the response —
Initially it failed completely. As I was trouble shooting engine surged back to full power and would run for a while then lose power again but only shortly. As I descended it became stable and ran at 24 in. until landing. I considered shutting it down but since it was producing power decided to leave it running.
We observed that on the first dip it looked like the turbo had failed completely. Ambient MAP at 19,000 is about 14.3″ and R engine MAP is reading 14.9″ in the screenshot. But after that one first dip the subsequent drops at minutes 37, 40, 42 etc — he’s getting some boost from the turbo — about 20″ and then back to 35″ when it kicks in again. Had to be a heck of a ride…
Inspection revealed that the turbo would seize and release, then repeat that pattern – just like the data shows.
We’ll finish August with data from a Cessna 182 powered by a Continental O-470 engine and data from a JPI 930 with a 1 sec sample rate. EGTs, CHTs and FF.
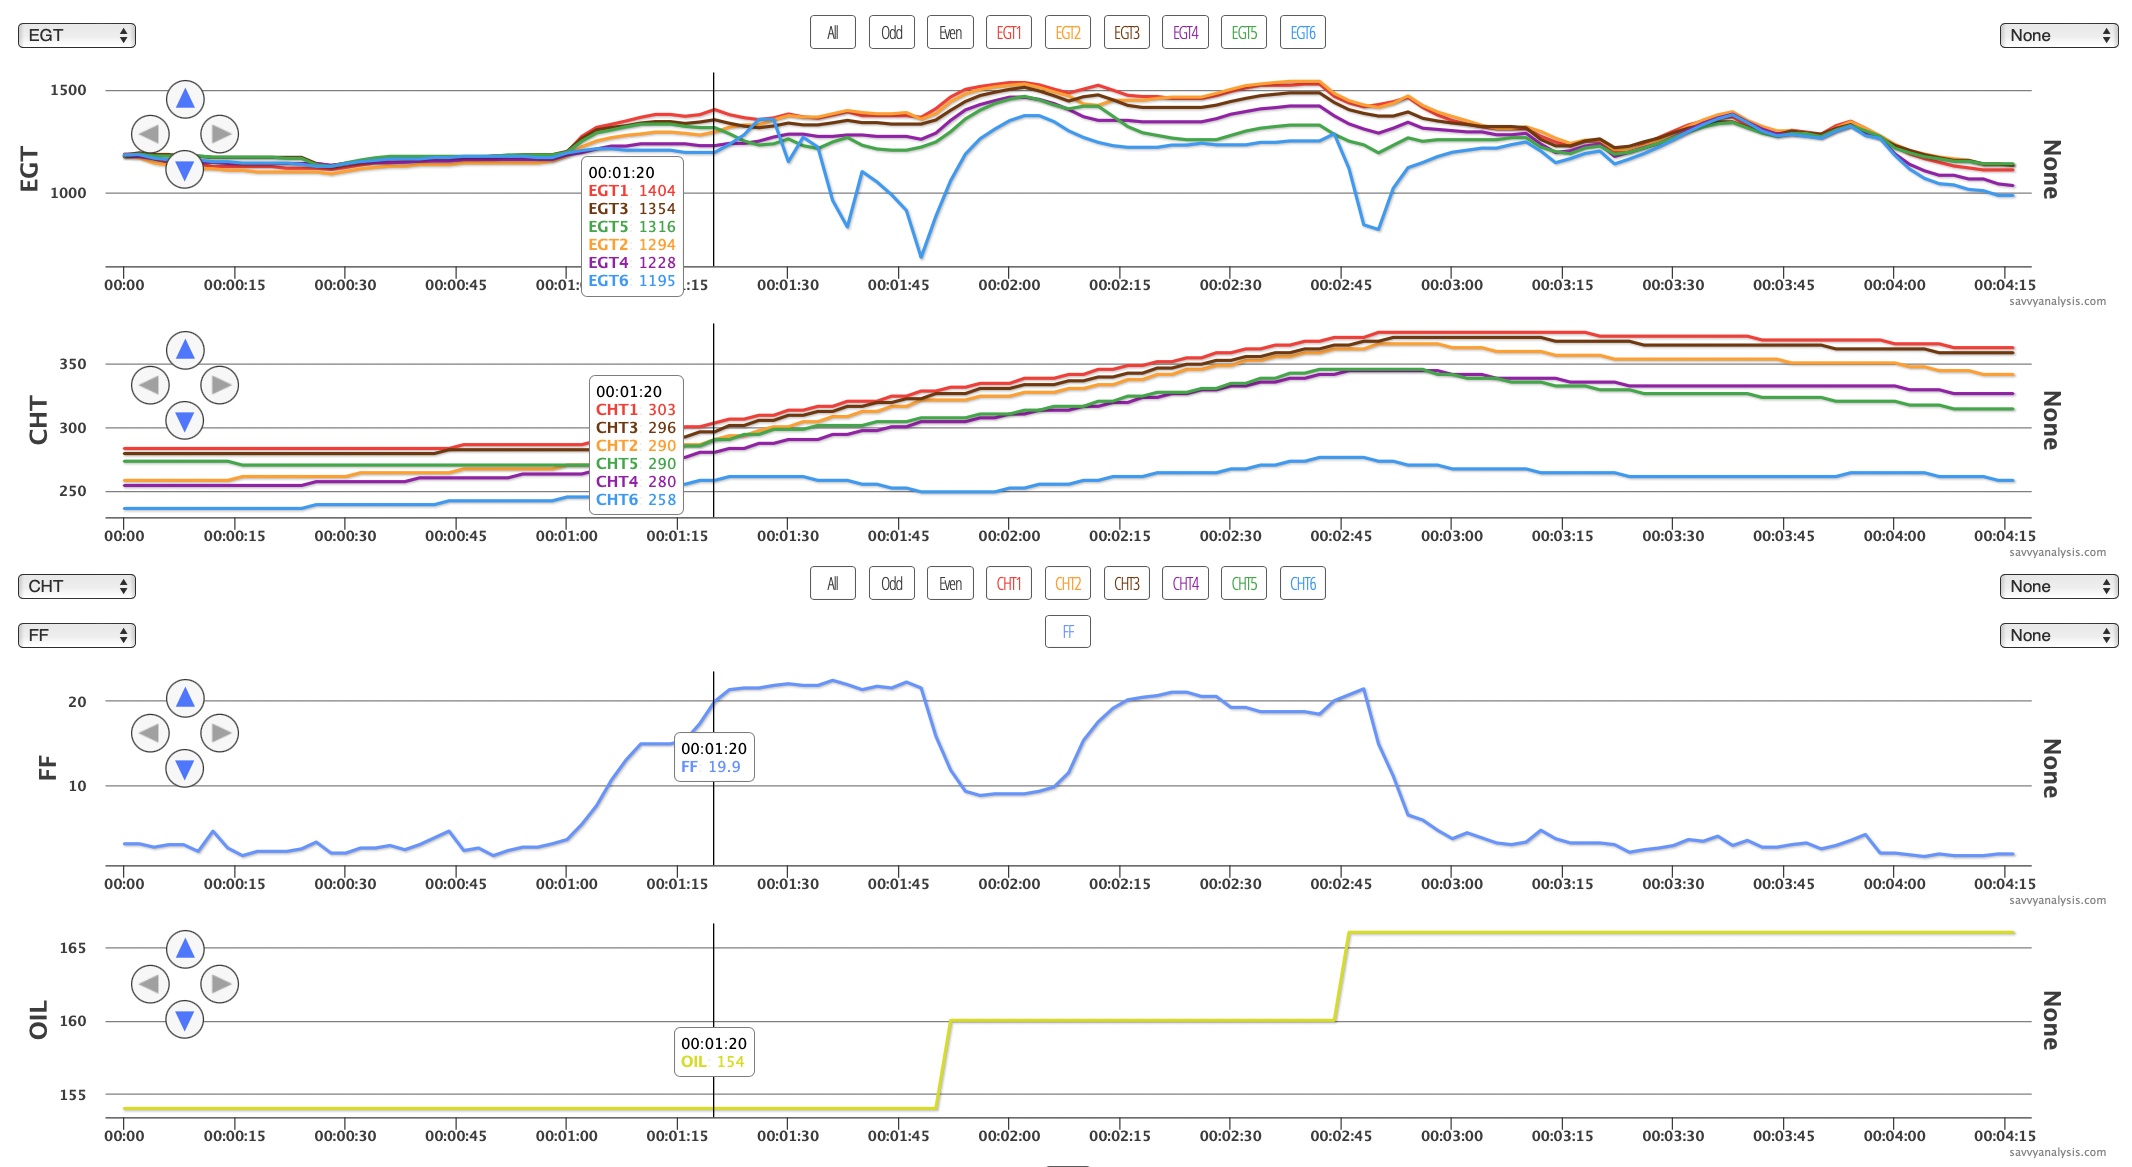
Sometimes data would look like this, and other times it would be normal. Even in this flight, EGT and CHT 6 are problematic on the takeoff at 00:01:15, then CHT is more like normal on the second power increase just after the 2 min mark – although CHT 6 is still low there. It’s not really acting like a fuel or spark issue. It could be induction, but idle MAP is normal. The mechanic decided to replace the sleeves and clamps because they were showing their age, and found aluminum tape lodged in the throat of the carb —

Like I said, the 80% are important for dispatch reliability, but the oddball 20% are more fun to write about.
