Scottish poet Robert Burns wasn’t a pilot – but his words are good advice for flight planning. This Puzzler is about anomalies that happened in flight. 14 CFR 91.103 directs pilots to become familiar with all available information concerning a planned flight prior to departure. We plan and prepare for what we think and hope will unfold, then we use our training and experience to deal with what really happens. Captains Al Haynes and Sully come to mind. And Apollo 13.
It’s a January tradition to restate the mission of these Puzzlers. Our goal is to help pilots recognize data anomalies in real time to make good decisions about the safety of the flight, and help owners to make informed maintenance decisions. This month we’ll look at data from a Cessna 182, A Commander 114 and a Cirrus SR22TN.
How often do you review your engine data? If you had a runaway CHT event in flight are you sure you would have noticed it in real time? A CHT excursion would not necessarily lead to poor performance after the event. It might, but it might not. It might just be a warning sign for more serious event to come.
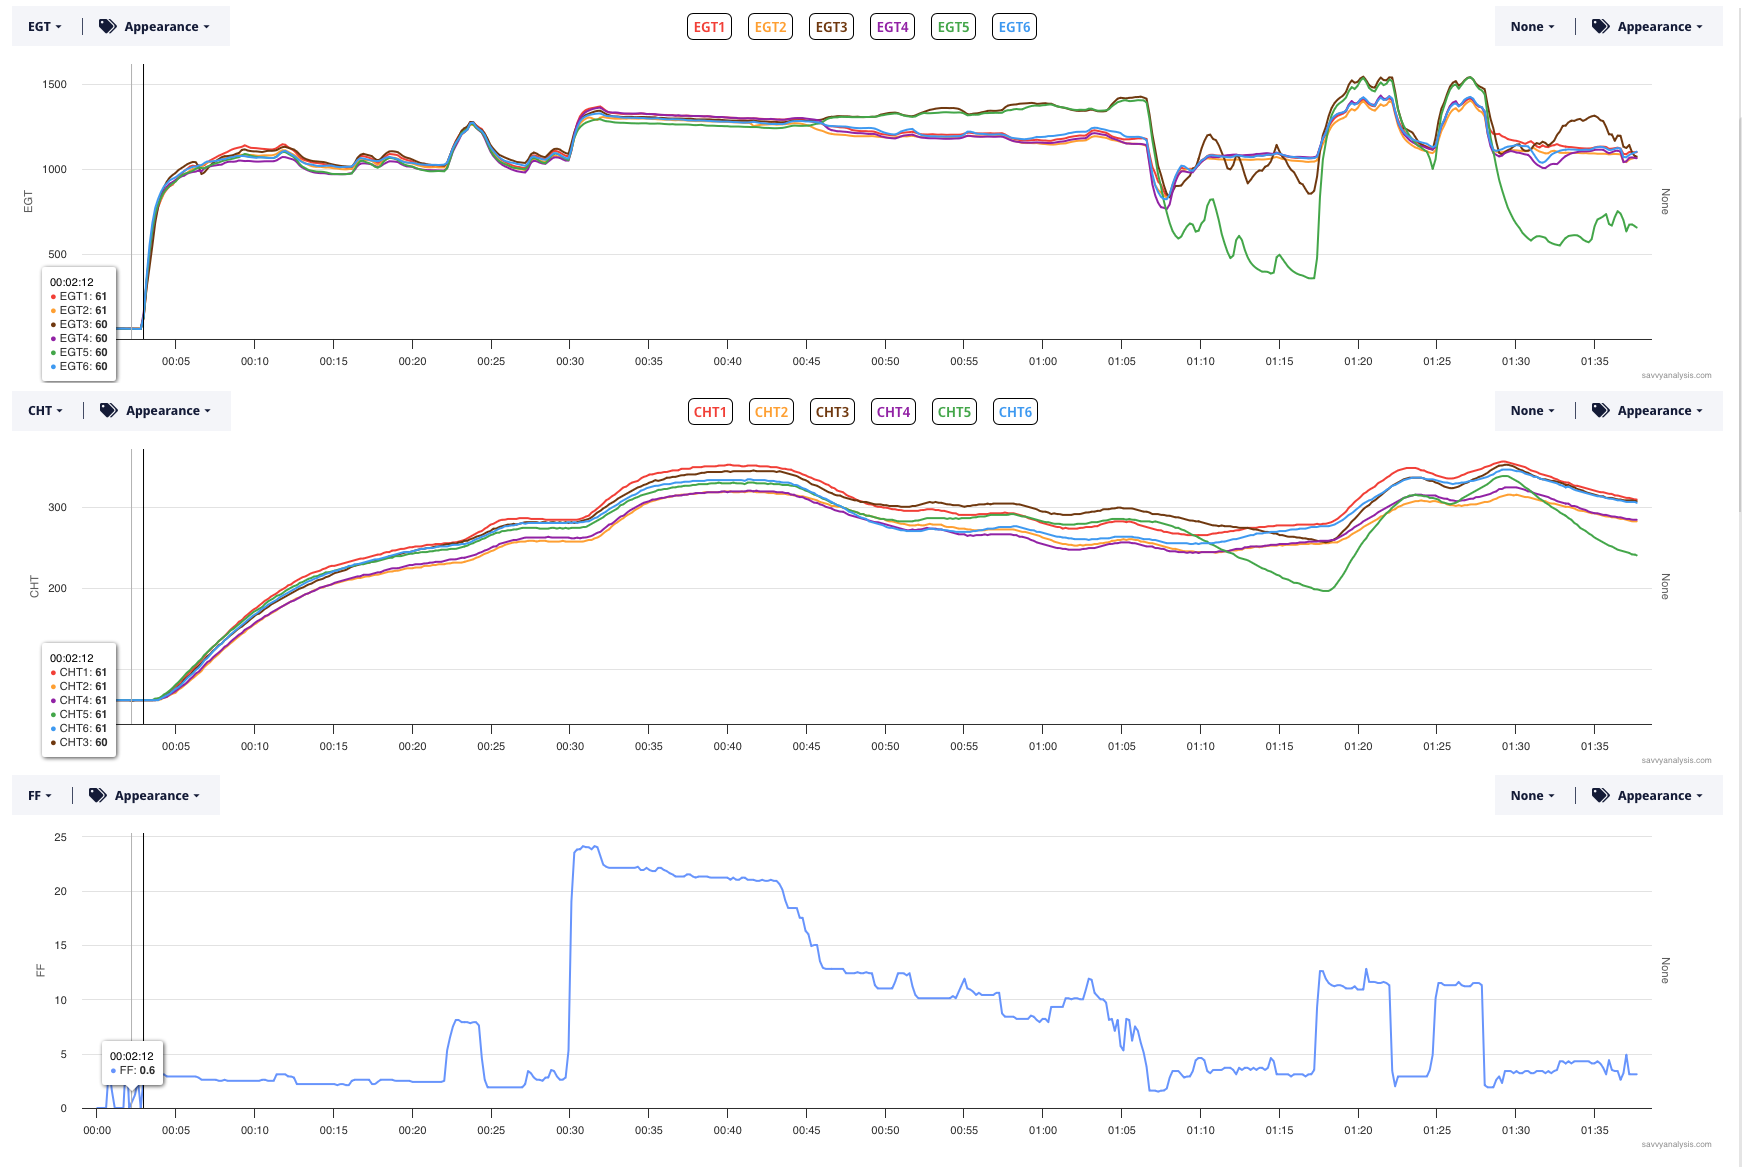
That’s the case with this Cessna 182 used as a skydive jump plane. The 1956 airframe is powered by a Continental O-470-U engine and data is from a JPI 730 with a 2 sec sample rate. Here’s data from a mid-November flight. If GPS ALT were logged I would have depicted it – because the climb rate is probably more aggressive than a typical flight. In skydiving, time is money. Here are EGTs, CHTs and FF, with the cursor on the max CHT reading of 672º.
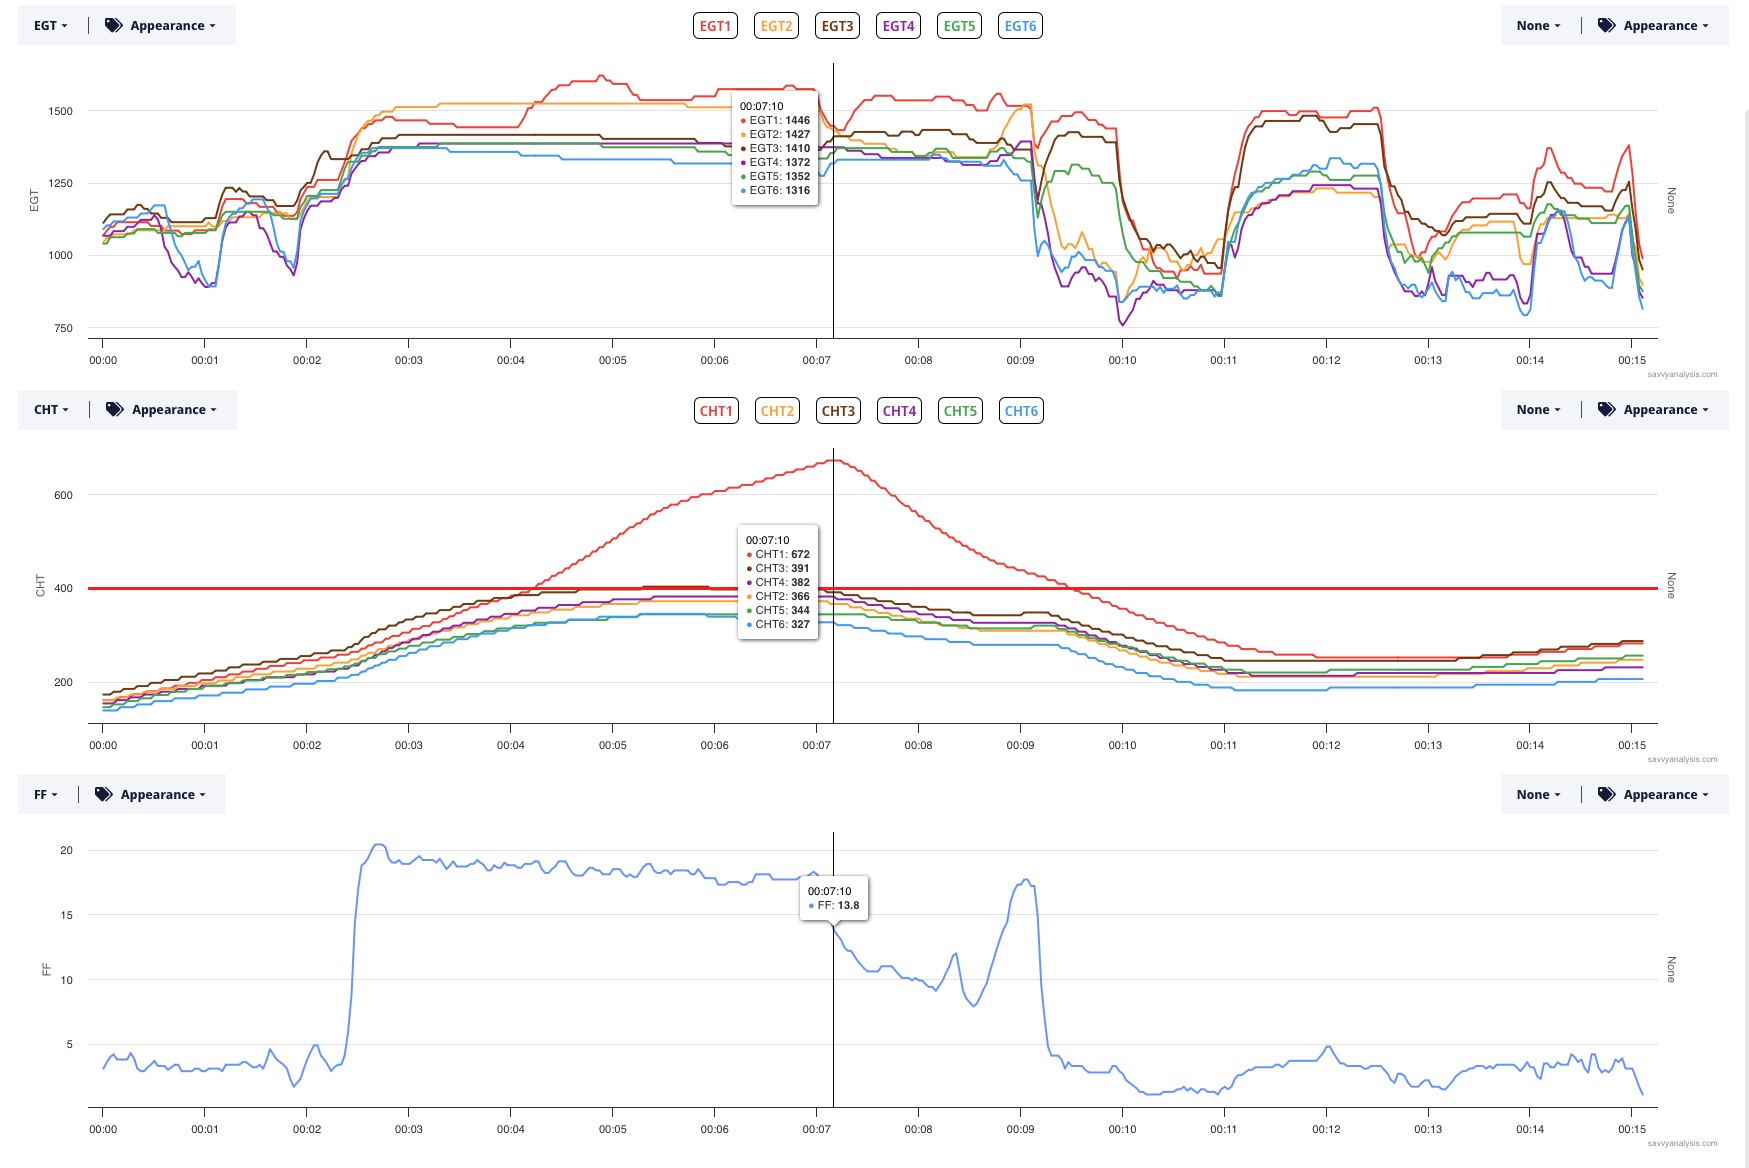
Let’s start on the left at the 1 minute mark. There are two instances where EGT’s 4 and 6 drop while the others don’t. Now, let’s skip ahead to the 9 minute mark, and again we can see EGT’s diverging. This time they separate into odds and evens. Then at the 11 minute mark 1 and 3 move higher while the others don’t. And at the 13 minute mark we see what we saw after engine start. So the data is suggesting that there’s a mixture imbalance, which could be an induction leak given the separation into odds and evens.
But that’s not the elephant in the room. The elephant is the giant CHT 1 excursion beginning at four minutes and ending at about 10 minutes with a peak at 672°. EGT 1 rises along with CHT 1 – the ∆ is about 150º. About a half hour later the 182 takes off again with another load of jumpers. Here’s the data from that flight.
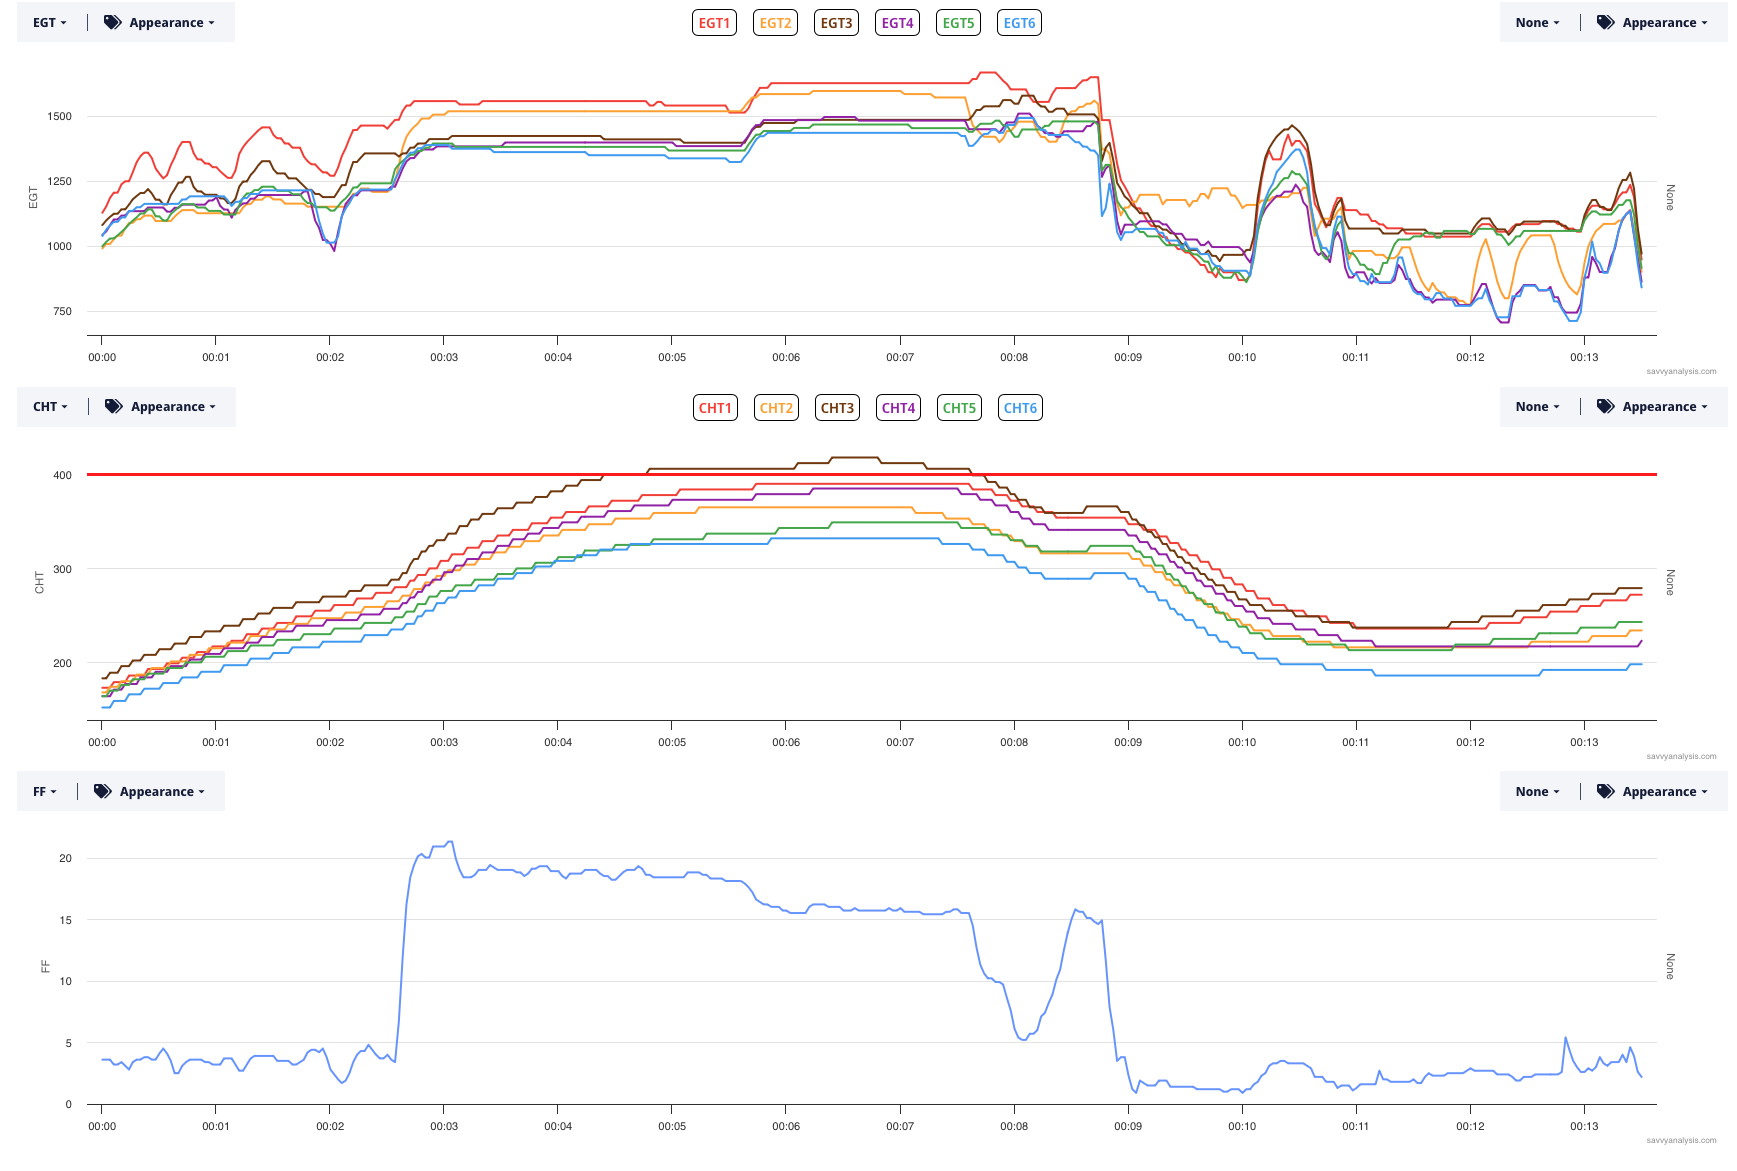
EGT 1 is high again, but no CHT 1 excursion this time. Over the next two days the plane stays operational logging 8 similar flights with no excursions. Then on the third day…
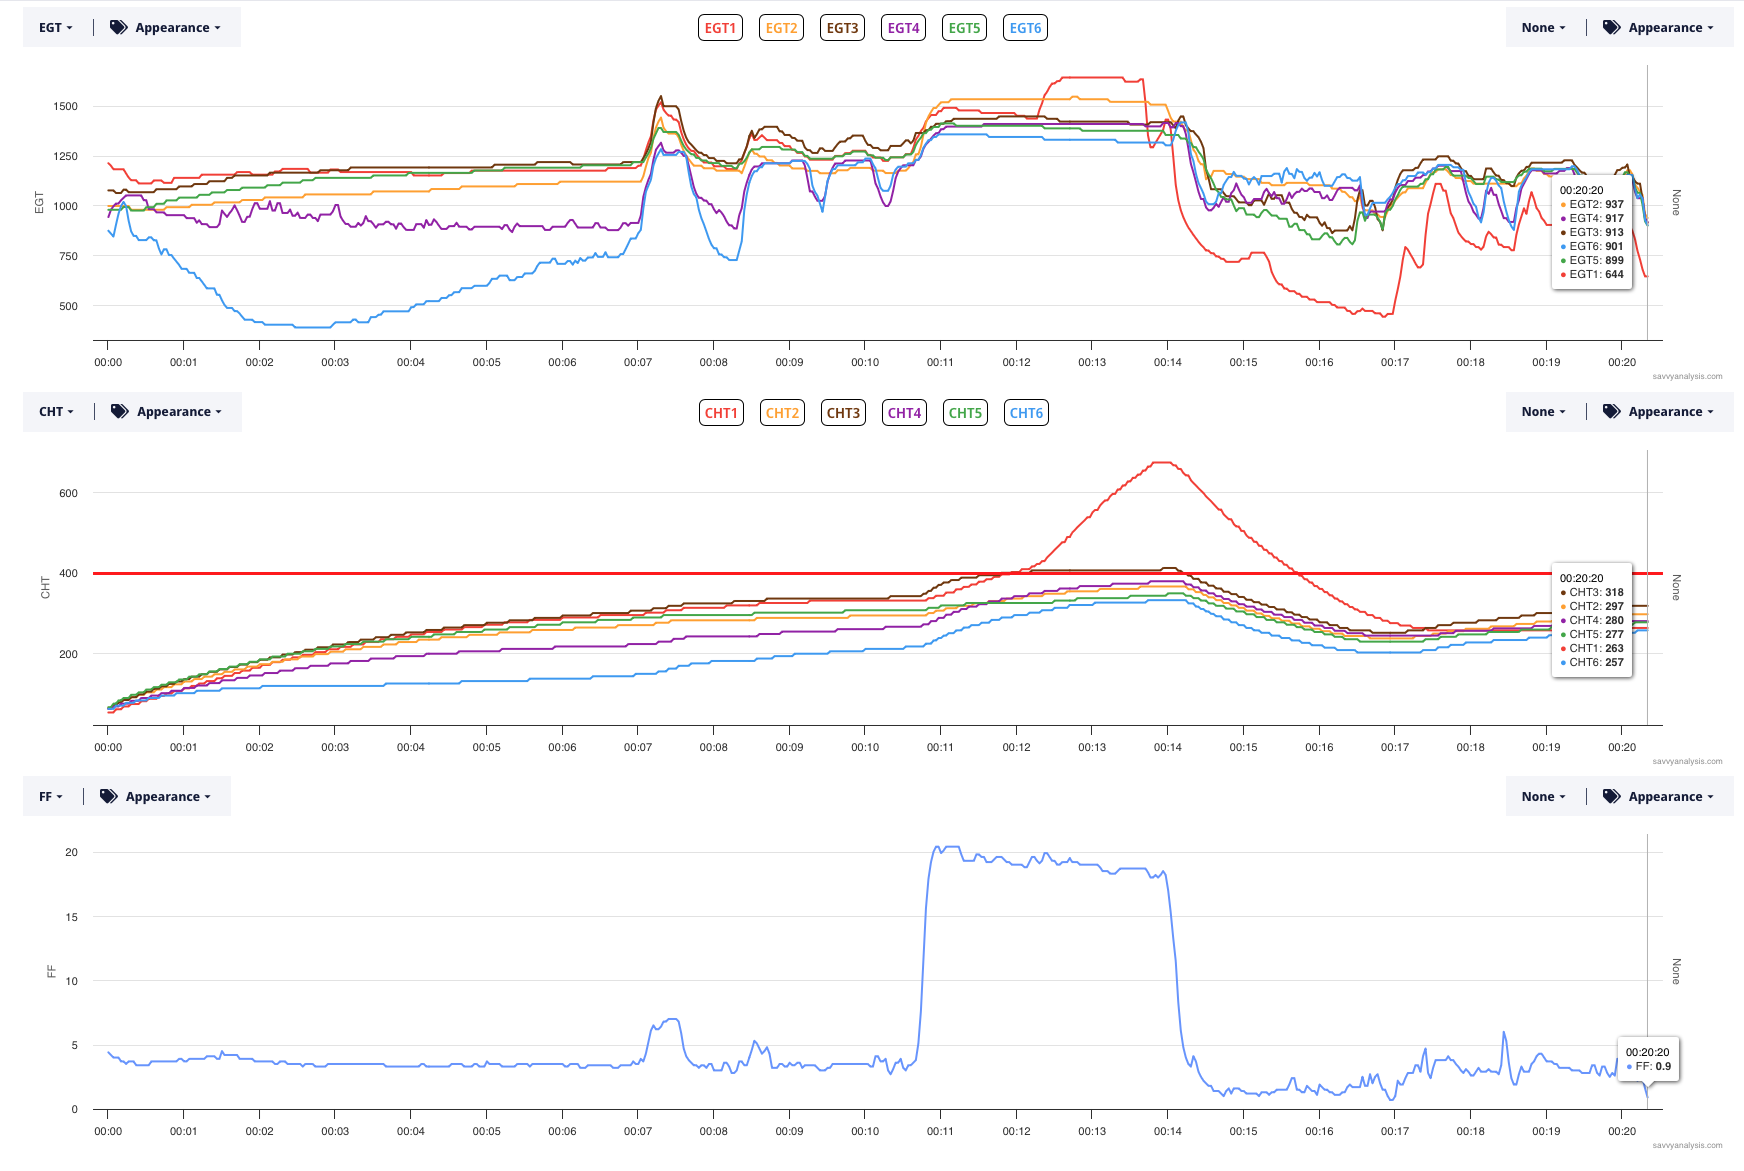
I moved the cursor off to the right so you could see the pattern for EGT 1. Remarkably, the CHT peak this time is 674°, just 2° higher than the first one. This time EGT 1 drops significantly as part of the pre-ignition event.
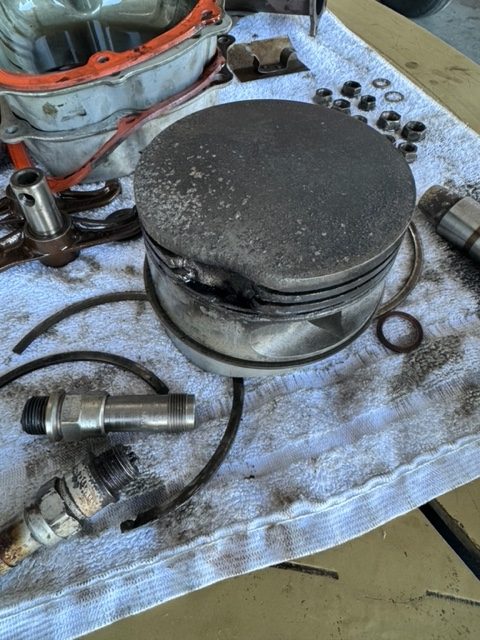
Examination of cylinder 1 reveals serious damage to the piston and parts of the rings melted away.
One thing that can easily cause an event like this is failure to properly torque down a spark plug. If the spark plug starts to back out, it loses its heat sink through the copper gasket, heats up like crazy, and turns into a glow plug.
Next we’ll look at data from a Rockwell commander 114 powered by a Lycoming IO-540 and data from an EI CGR–30 P with a 1 sec sample rate. EGTs, CHT and FF. Cursor is off to the left to keep it out of the way.
Startup, taxi out, runup, takeoff and climb all look normal. Then at the 45 min mark EGTs 3 and 5 split off and start rising. Two interesting observations — it’s 3 and 5 but not 1, so it’s not the whole odd side. And the split happens about half way through the FF reduction – not at the beginning and not at the end. CHTs 3 and 5 were not hottest before the split. After the split, 1-3-5 are the hottest CHTs, but the spread (between the hottest and the coolest) is about the same before and after the EGT split.
FF goes to idle at about 01:07 and cylinder 5 drops offline. But it comes right back 10 minutes later when the pilot does a couple of runups. Our diagnosis? Check induction for 3 and 5. Weak spark could also cause EGTs to rise, but we’d expect lower power output from the weak spark – and maybe some roughness.
Why not clean injectors 3 and 5? With clogged injectors, we should see higher EGT and CHT at Max FF and we’re not seeing that. We should also see lower EGT and CHT when FF is reduced and we’re not seeing that.
We’ll finish this month with data from a Cirrus SR 22 with a Continental IO–550TN turbo normalized engine. Data is from an Avidyne Entegra with a 6 sec sample rate. This time it’s oil temp, oil pressure and RPMs. The cursor marks the spot where oil temp and pressure oscillations begin – about an hour into the flight.
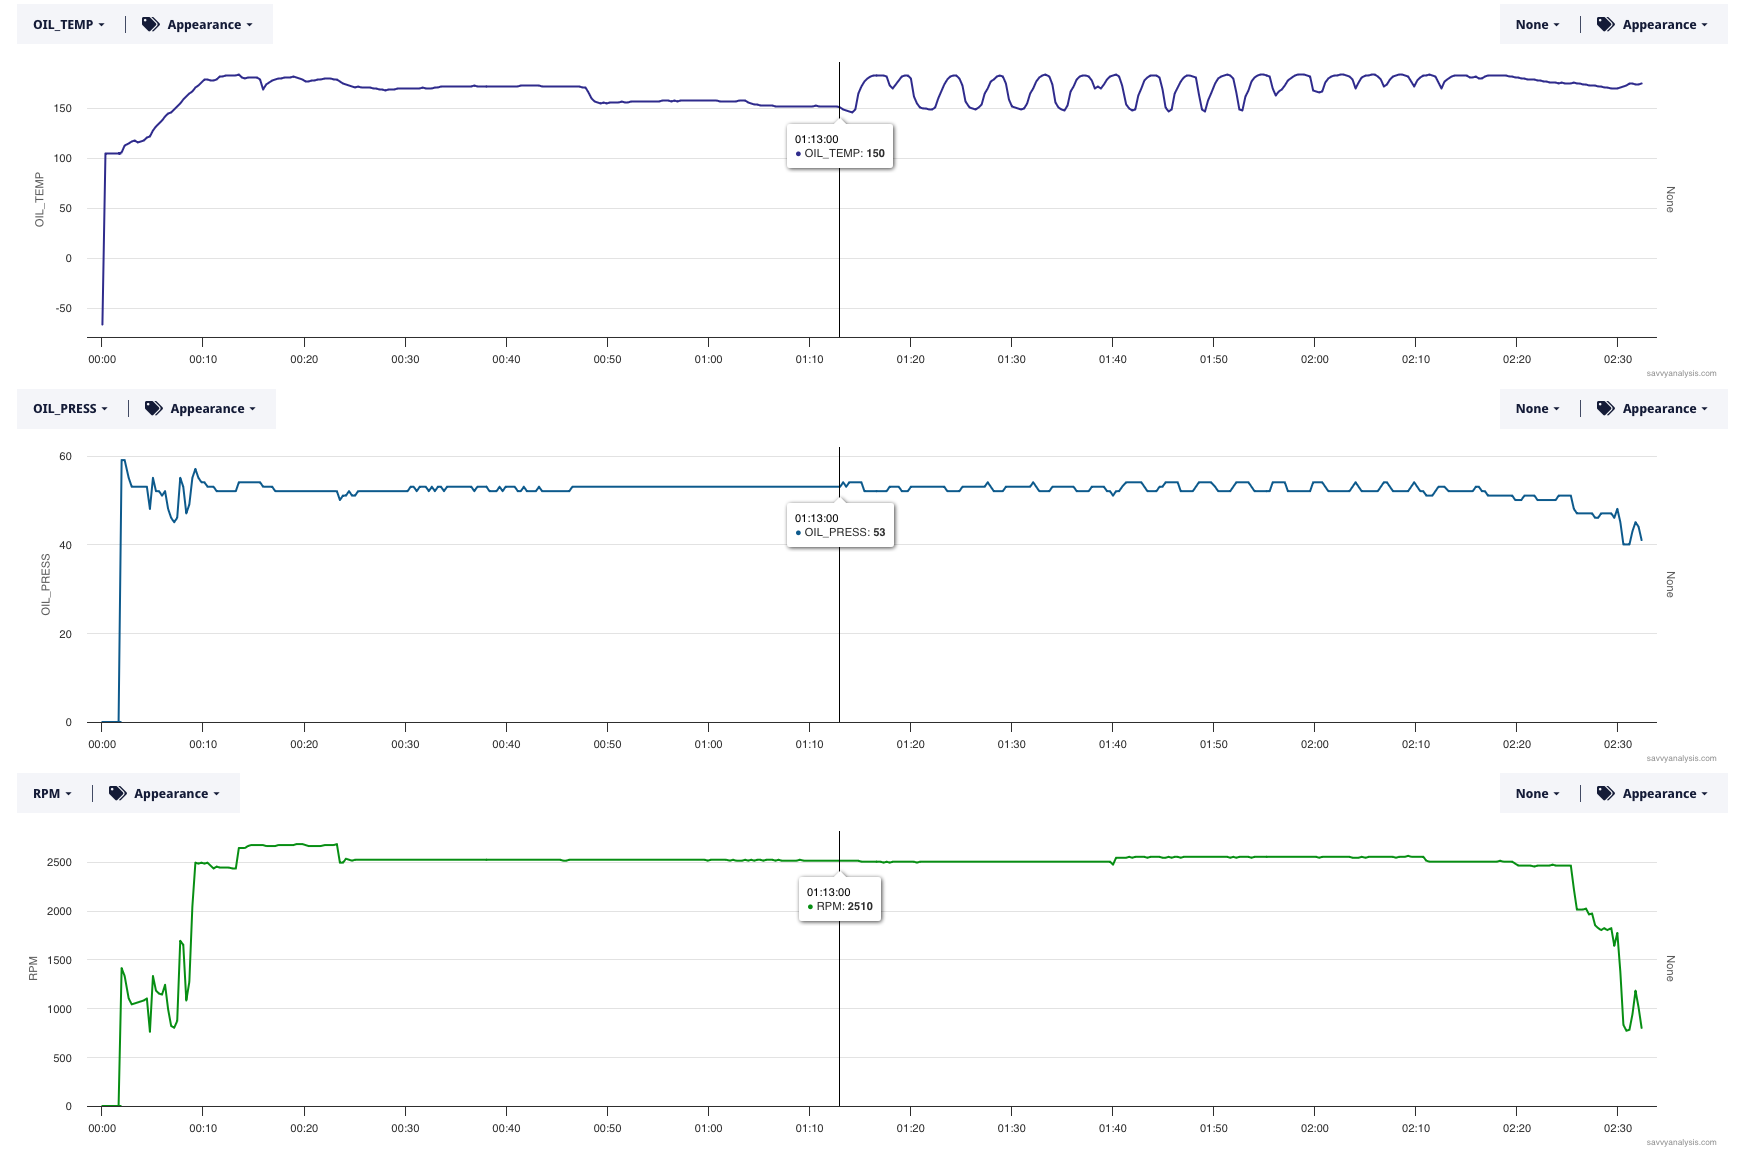
It would be tempting to pin the changes in oil temp to a bad connection or a faulty sensor. Except that pattern is too regular – even when it changes at the 2 hour mark. And a faulty temp sensor should not cause a similar oscillation in oil pressure. In case you’re wondering, when oil temp goes up, oil pressure goes down. It’s a little hard to tell zoomed out this far. RPMs aren’t moving at all, and EGTs, CHTs and FF are similarly flat during this pattern.
The pilot didn’t report any surging. The pattern just sort of trails off about an hour after it started. Here’s the kicker. On the next flight there’s no sign of this pattern. Nor on any subsequent flight. Oil temp and pressure move up and down as expected. Our best guess is that it was related to oil quantity. Probably not enough oil, since it happens an hour into the flight. If it was too much oil we would have seen it early in the flight, right?
Thanks for reading. See you next month.
