Baseball has the cycle – single, double, triple and home run. What would that be for an analyst working a shift? Clogged injector is probably the single. Bad spark plug is probably the double. Let’s say the triple is a stuck valve. And the homer is a detonation event. How about a catastrophic part failure? Clearly a broken bat hit. Foul ball is a failed probe. Still working on the analysis equivalent of a bunt. This month’s puzzler isn’t exactly a cycle, but it should keep you thinking.
First up is a Cessna 170 powered by a Continental O-300 and data from am EI CGR-30P with a 1 sec sample rate. EGTs, CHTs and FF. Nothing special about cursor placement – just midway through the flight.
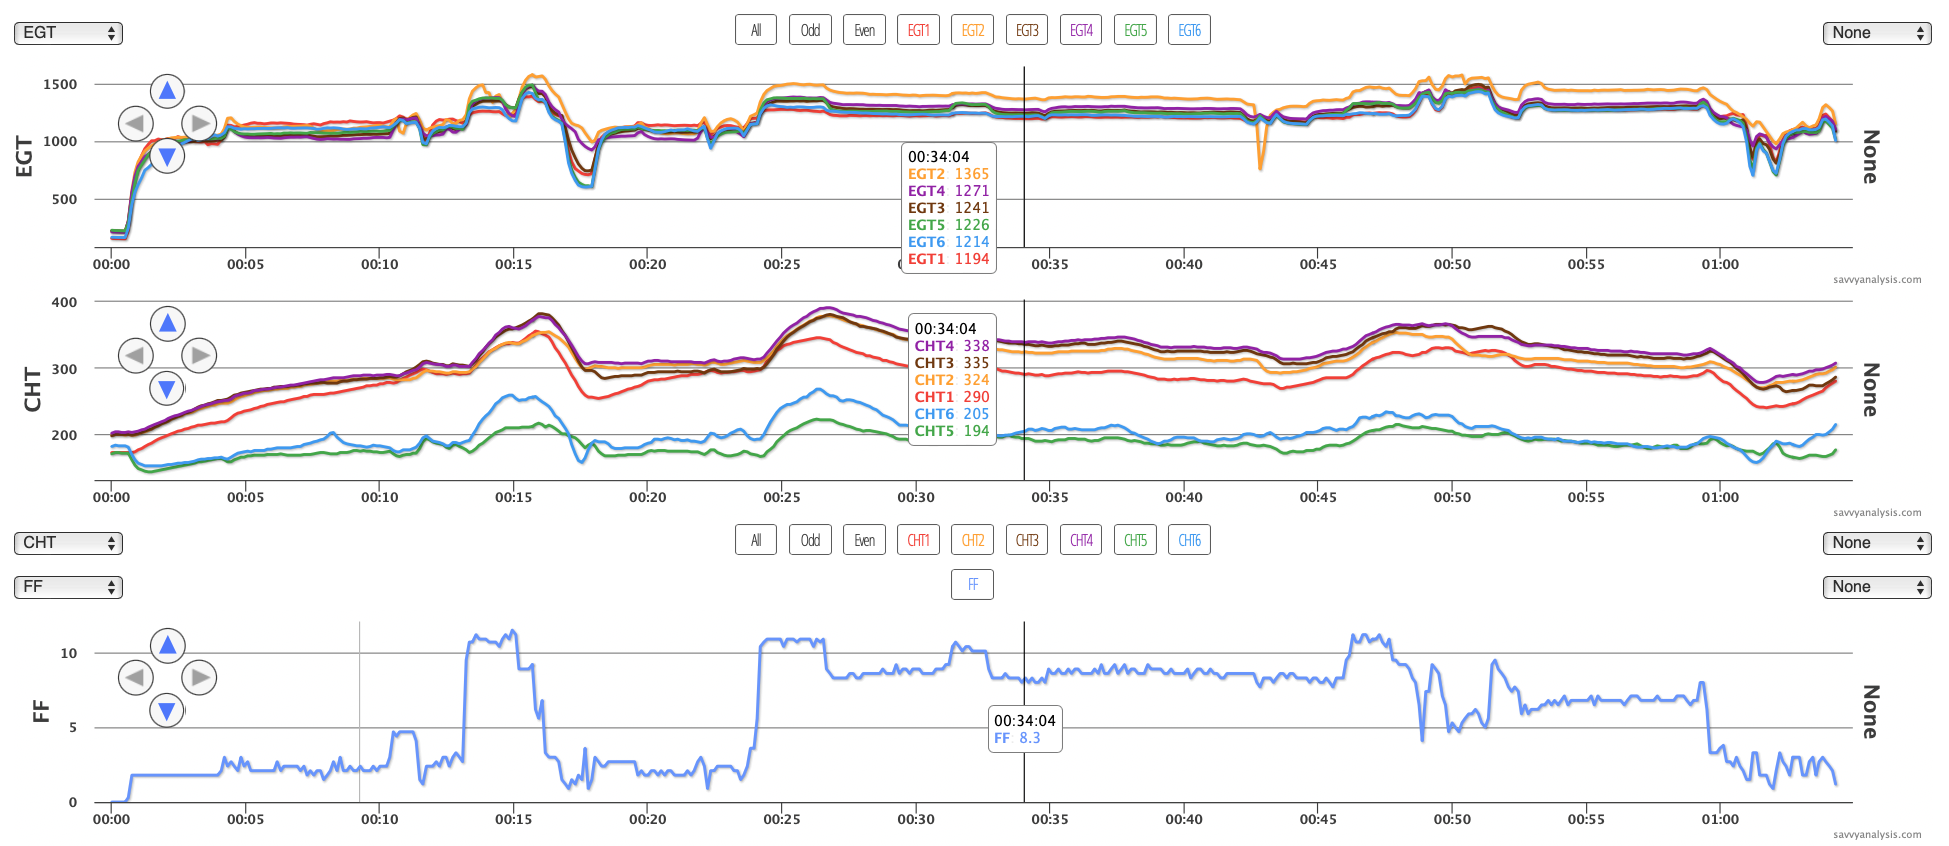
The things that jump out are —
EGT 2 is high whenever the engine is making power – during idle it drops down with the others.
CHT 2 is a little lower than 3 and 4 which are hottest.
CHTs 5 and 6 are abnormally low, in the 200 range in cruise. But EGTs 5 and 6 are right there with the others, suggesting that the low CHTs are because of cooling and not from weak combustion.
The pilot reported roughness in cruise. Kudos for performing an inflight mag check. Let’s use the mag tool to isolate odd and even EGTs and zoom in there.
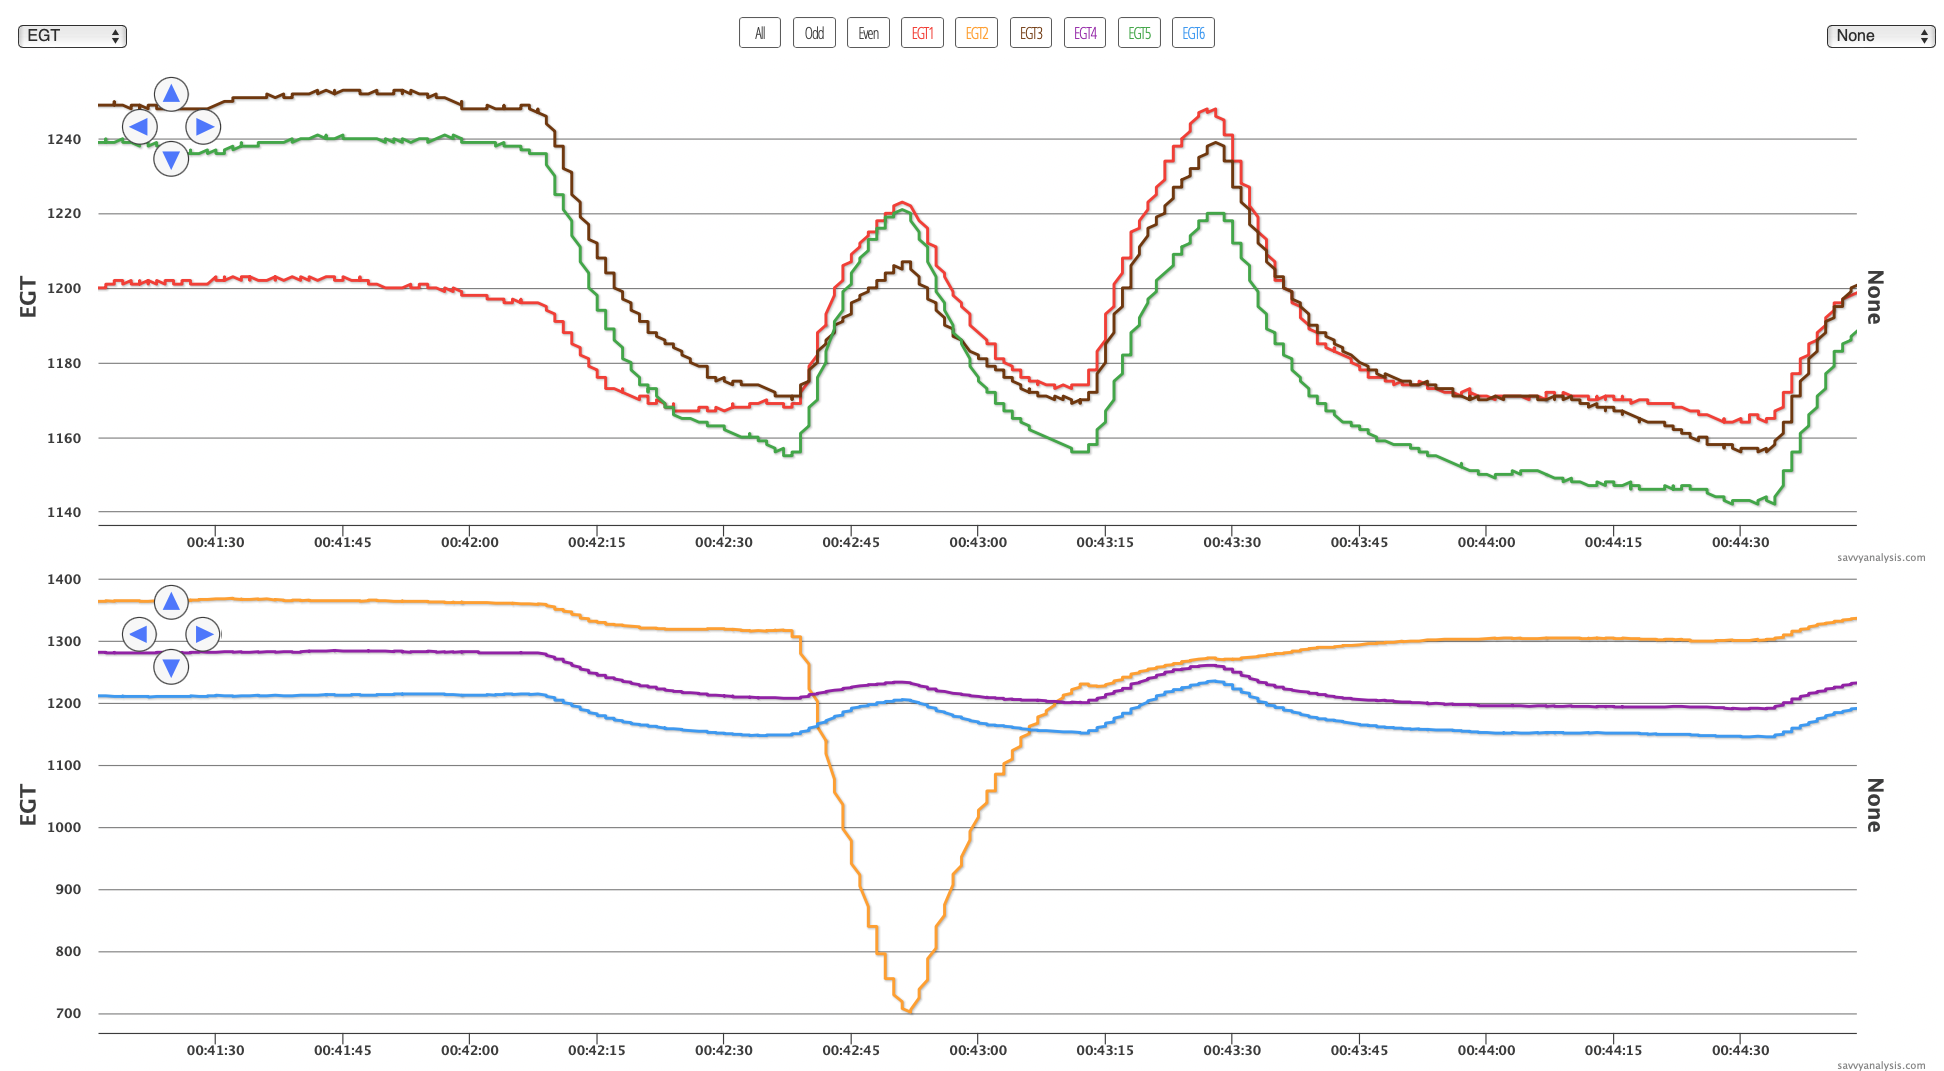
Torturing the baseball analogy, this is a 4-pitch walk. The plug fired by the first mag checked is fouled. Then the question is which mag is that? Since the EGTs of cyls 1 and 3 rise from the first mag checked to the second mag checked, the first mag must be firing the tops of 1 and 3, right? And with a standard mag configuration, that would mean the first mag is firing the bottoms of 2 and 4. Except…
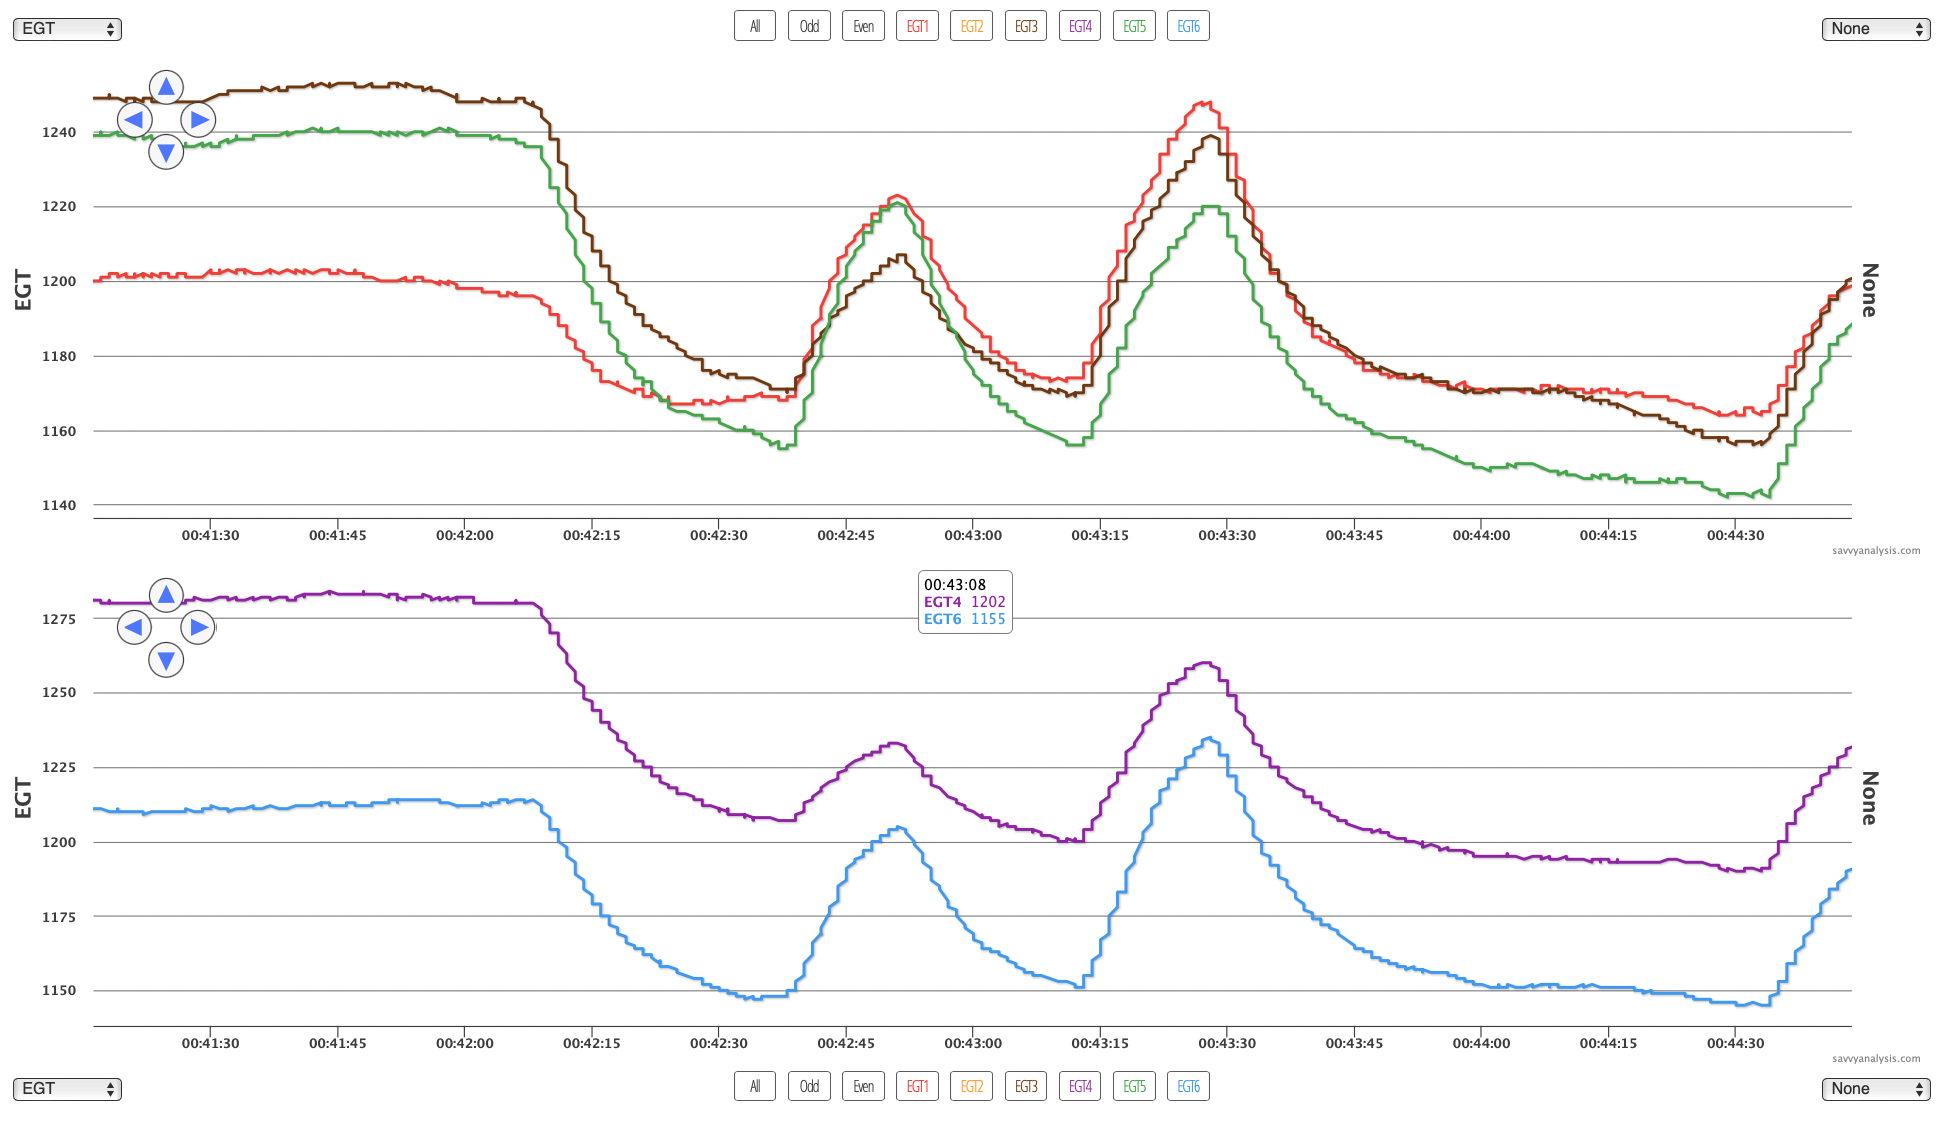
If we hide the EGT 2 trace we see that all EGTs rise from the first mag to the second mag. Which might mean that one mag is firing the tops and the other is firing the bottoms.
Most of the time we can tell which mag was isolated and which plugs are misfiring. In this case our money’s on the bottom plug, but if we know which mag was checked first then it’s easy to follow the harness to the guilty party.
Next up is a Diamond DA40 powered by a Lycoming IO-360 engine and data from a Garmin G1000 with a 1 sec sample rate. Cursor is at the beginning of the Savvy test profile.
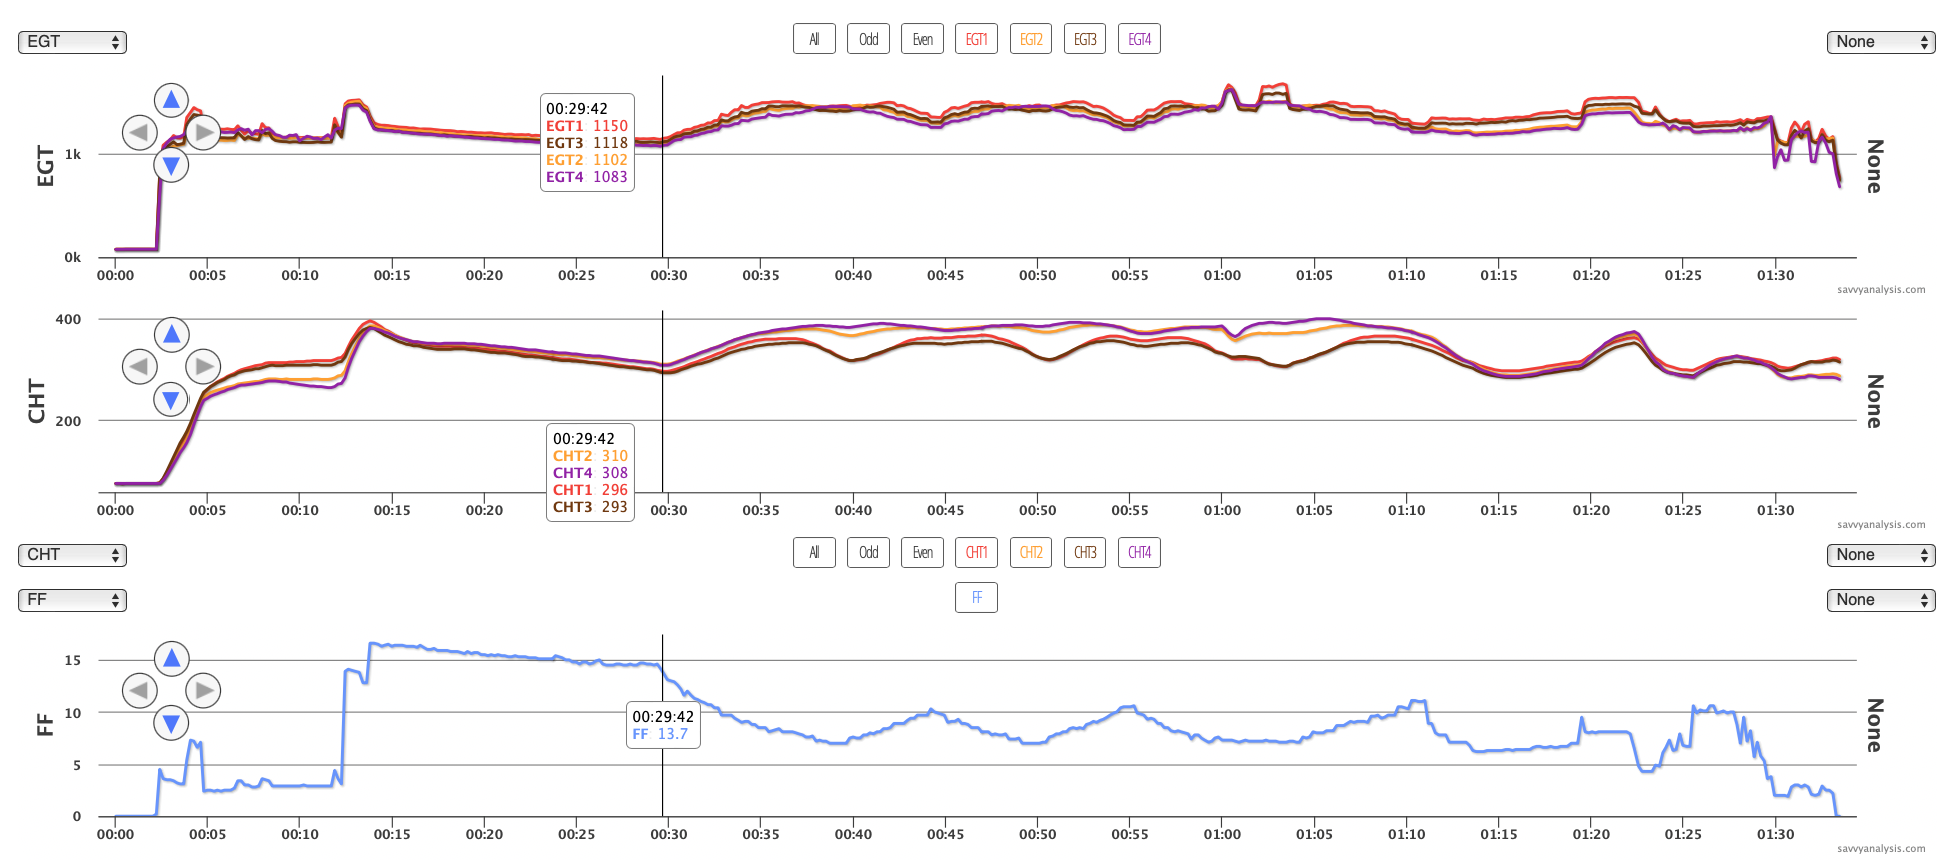
The report was that the engine would not run LOP as it had before. There was no intervening maintenance.
Even zoomed out, there’s something odd about the EGT and CHT patterns during the mixture sweeps. So let’s switch to GAMI mode and get a better look.
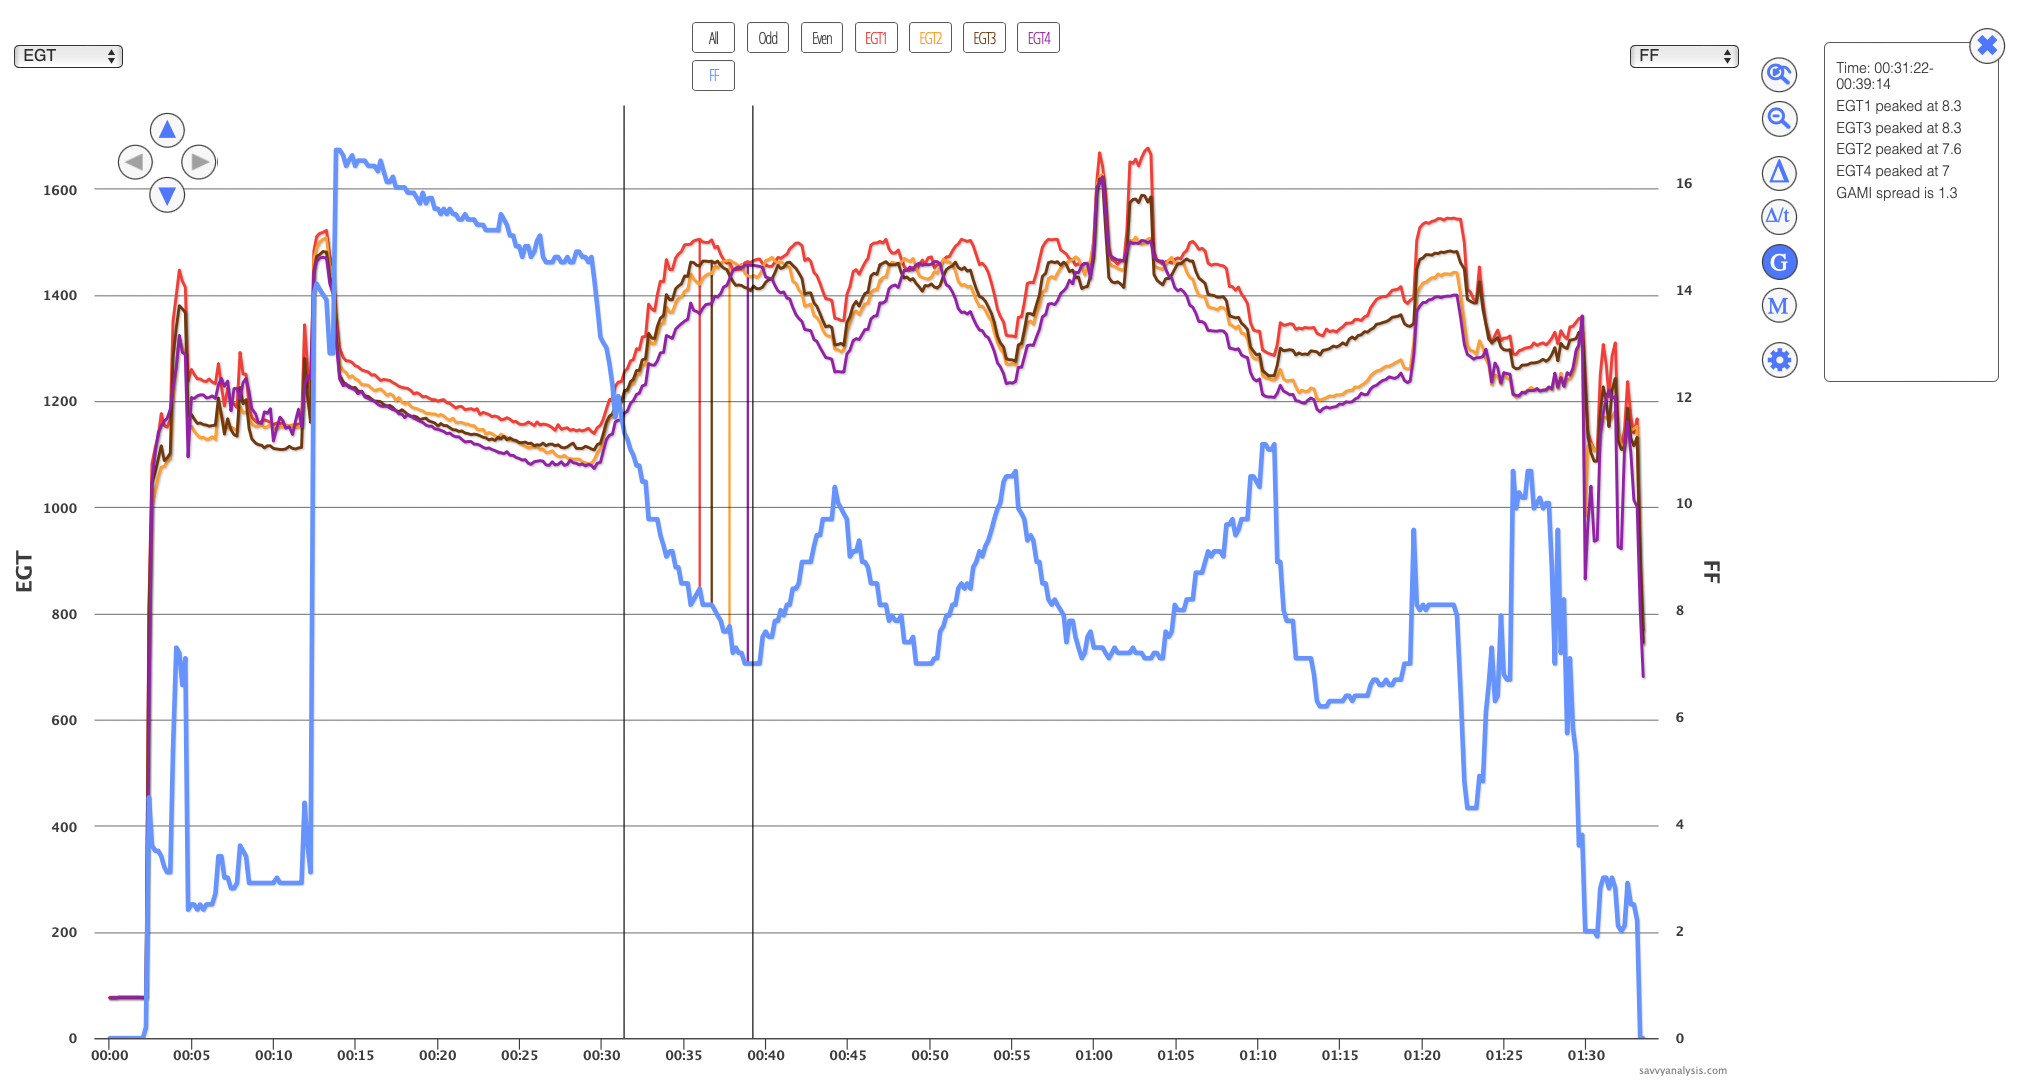
We noted that 1 and 3 are peaking well ahead of 2 and 4, and recommend cleaning 1 and 3. Our client told us that all injectors – and O-rings – had recently been cleaned in troubleshooting this issue. Then another symptom was reported – a slight bobble and sputter if the mixture control went to the firewall too fast. It didn’t sputter if it were a more gradual increase.
Right about then, the mechanic working the problem suggested swapping the fuel divider – aka the spider. It was next in line upstream from the injectors, and the data did support something different between the odd and even cylinders. We considered recommending the bottle test to measure the FF out of each injector. In the interest of getting the airplane back in the air, our client decided to opt for replacing the spider and that fixed it.
We don’t see it often, but we’ve seen it before. A tear in the rubber diaphragm, a bad spring, a blocked vent or a loose bead of RTV can effect the way an engine responds as fuel flow increases and decreases.
Next is a Cessna 172 Cutlass RG powered by a Lycoming IO-360 and data from a JPI 700 with a 6 sec sample rate. EGTs, CHTs and FF, and note that FF is in Liters per Hour. The bottom rank is oil temp in yellow and oil pressure in blue. Cursor is on the beginning of the CHT 3 excursion.
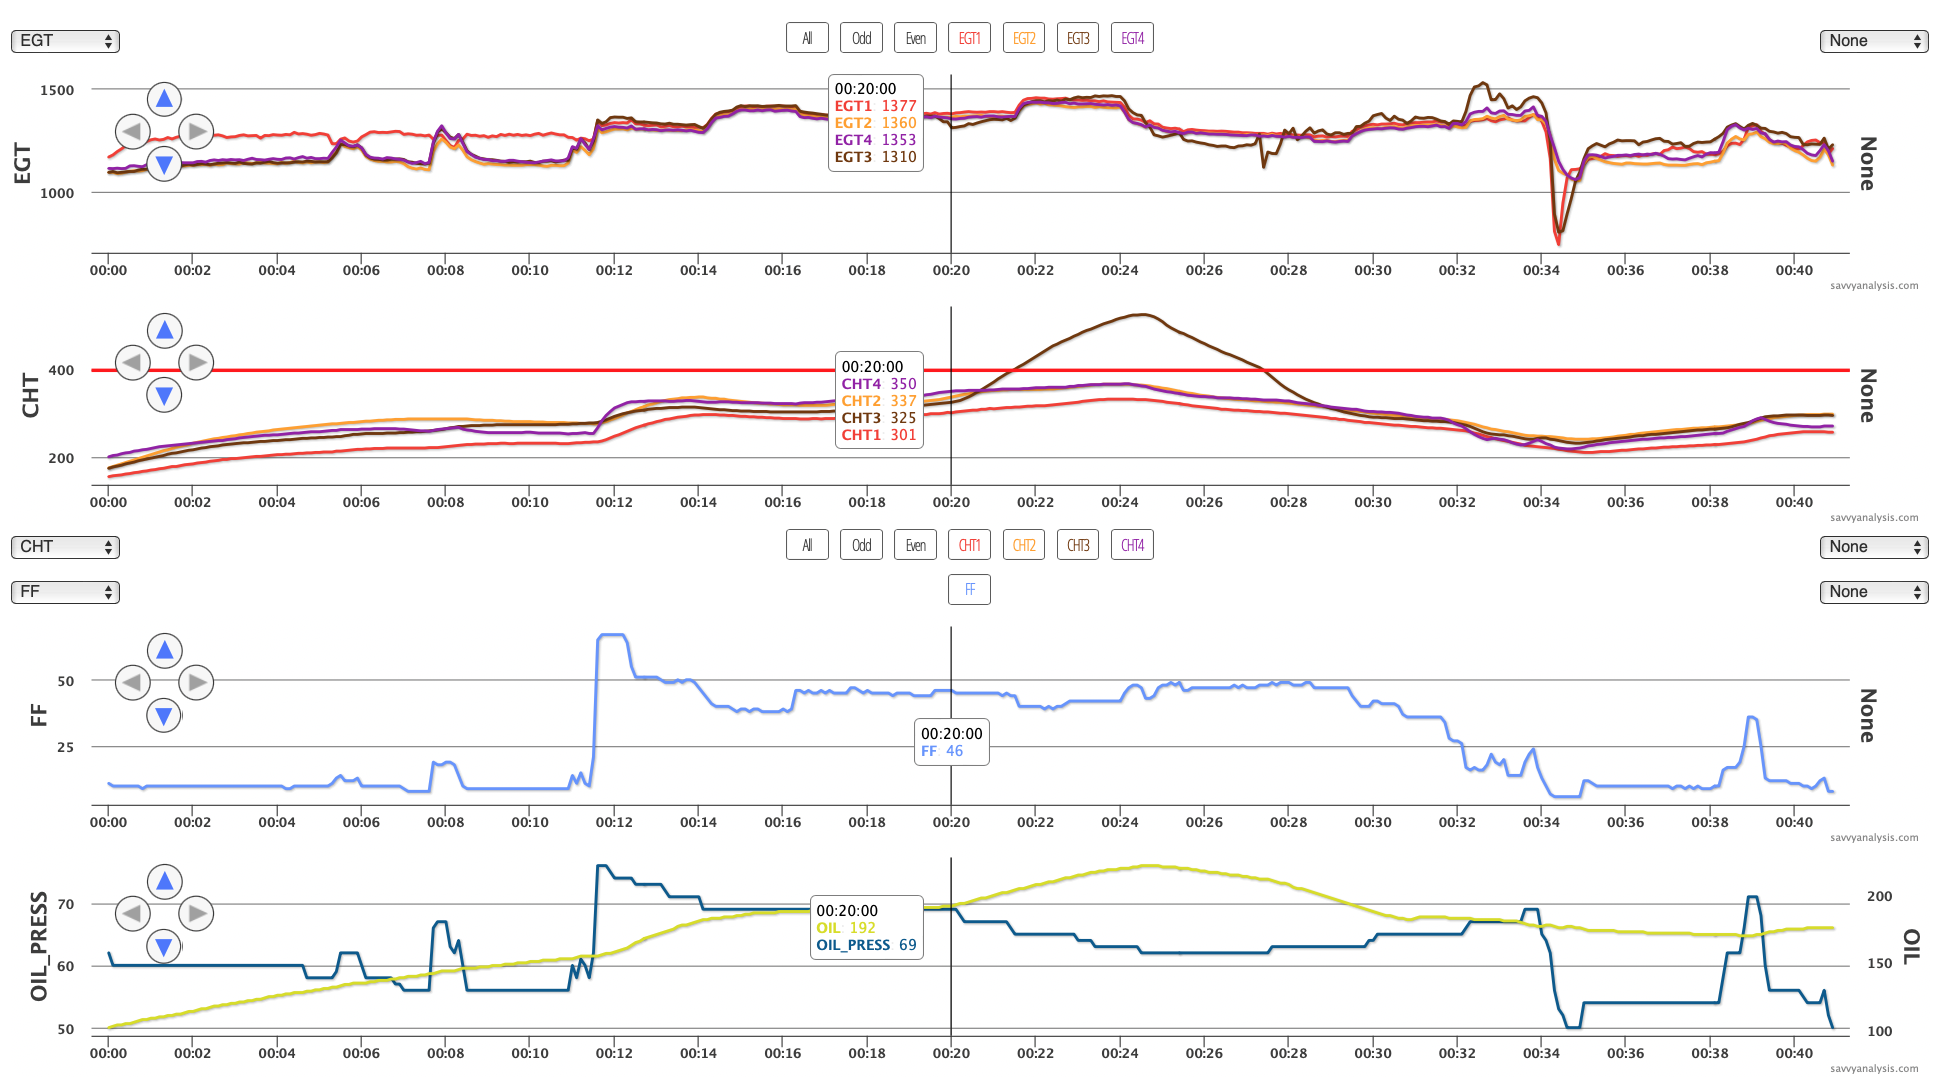
This is a textbook detonation event. Just before the cursor, EGT 3 drops a little. Then CHT starts to climb, eventually reaching 524º. Oil pressure drops as oil temp rises, and together they put an end to the hope that maybe it’s just a bad CHT probe. The erratic EGT 3 trace after the CHT peak confirms the detonation event.
The natural inclination for pilots and owners is to ask what caused this or could I have prevented it? More often than not, a cracked insulator on one of the plugs is the cause. In this case, inspection revealed that both plugs were heavily damaged, so we don’t know which one started it. EGT 1 is high from startup to takeoff, but normal in flight.
Zoomed out, EGT and CHT 3 appear normal up to the event. Let’s zoom in from the runup to the power pull, set EGT 3 for bold and add CHTs below. Cursor is on the takeoff roll.
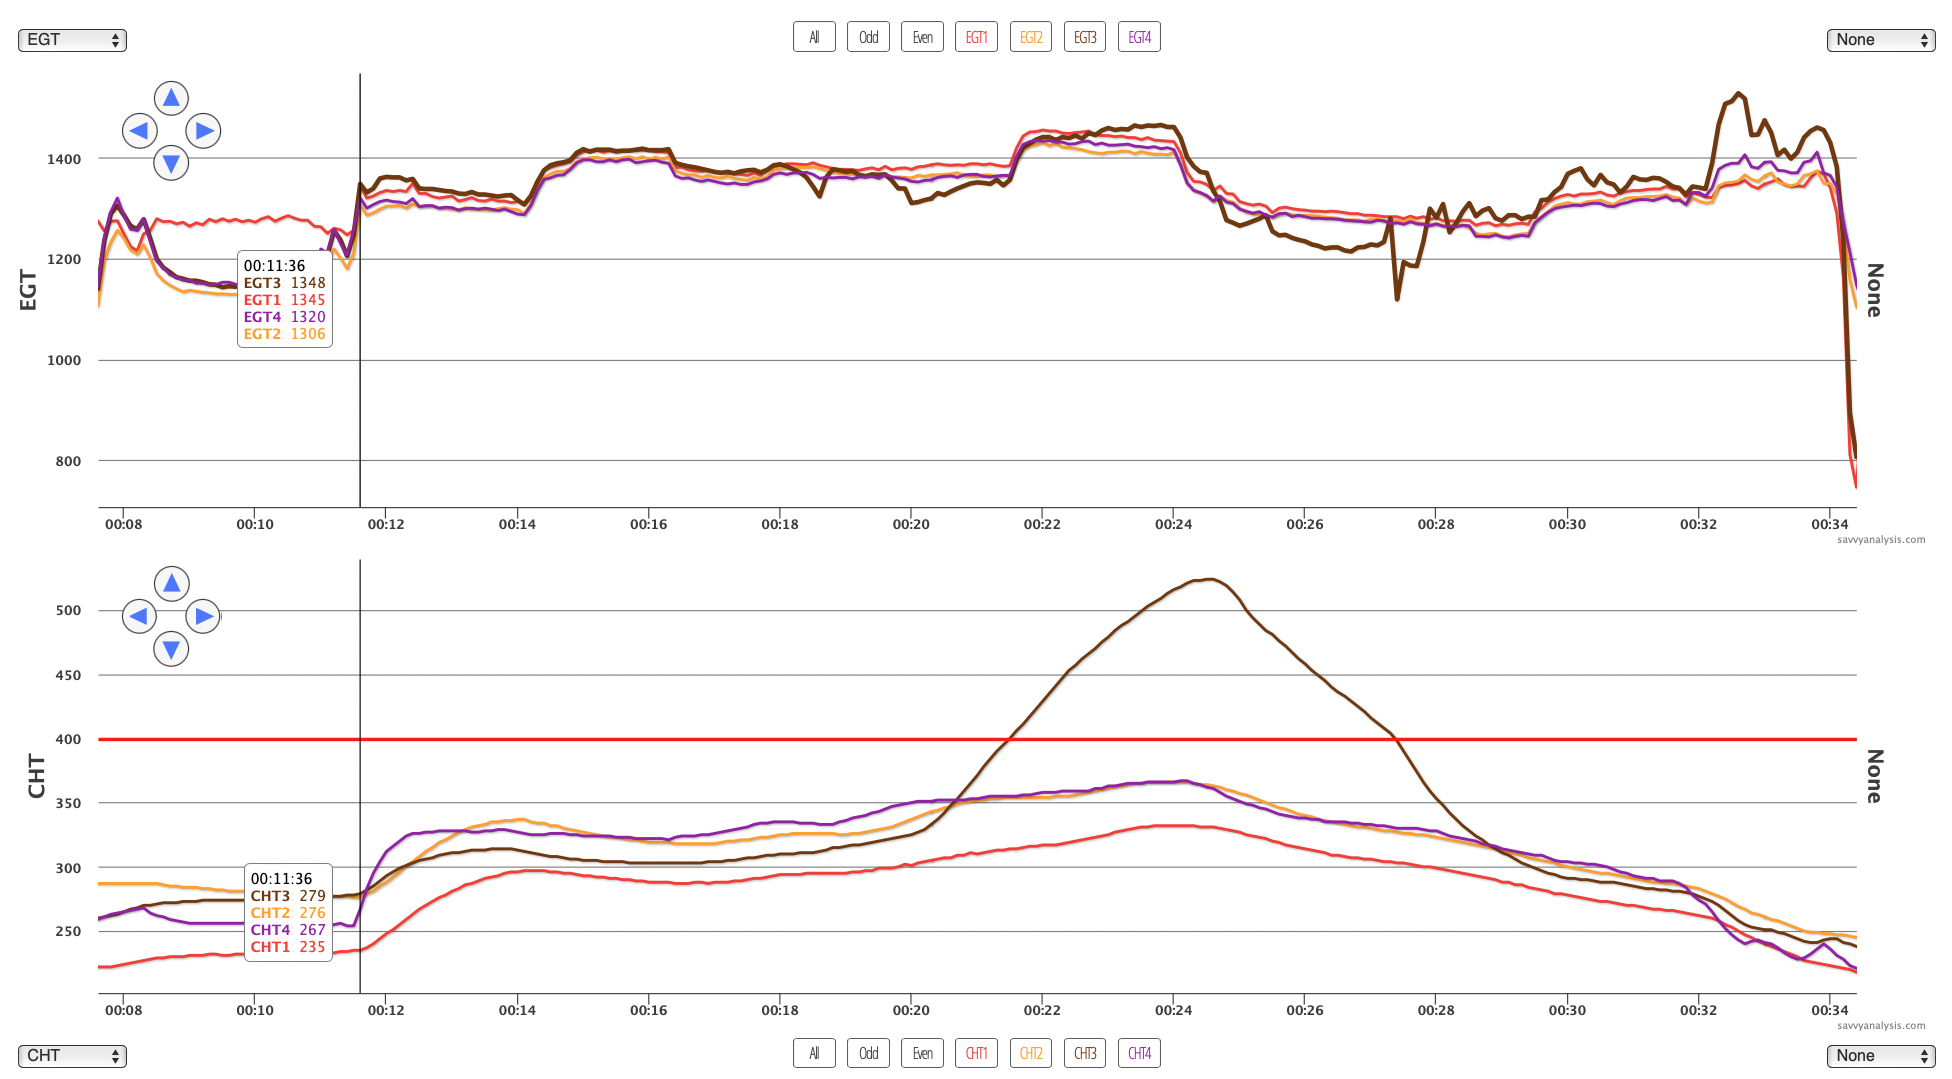
Again, looking for signs of impending doom, EGT 3 rises slightly more than the others in the takeoff roll. It’s really not enough to grab your attention, and if this were my data and I had made the decision to go even though EGT 1 was high throughout taxi out, I’d probably be happy that it now looks fine. EGT 3 is highest in initial climb, but not an outlier. Then at about the 19 min mark EGT 3 does a little drop, before its big drop a minute later timed with the CHT excursion.
Once the event has begun, could the pilot do something to end it sooner? Let’s look at one more chart. This is CHT and FF, with the cursor on the CHT peak.
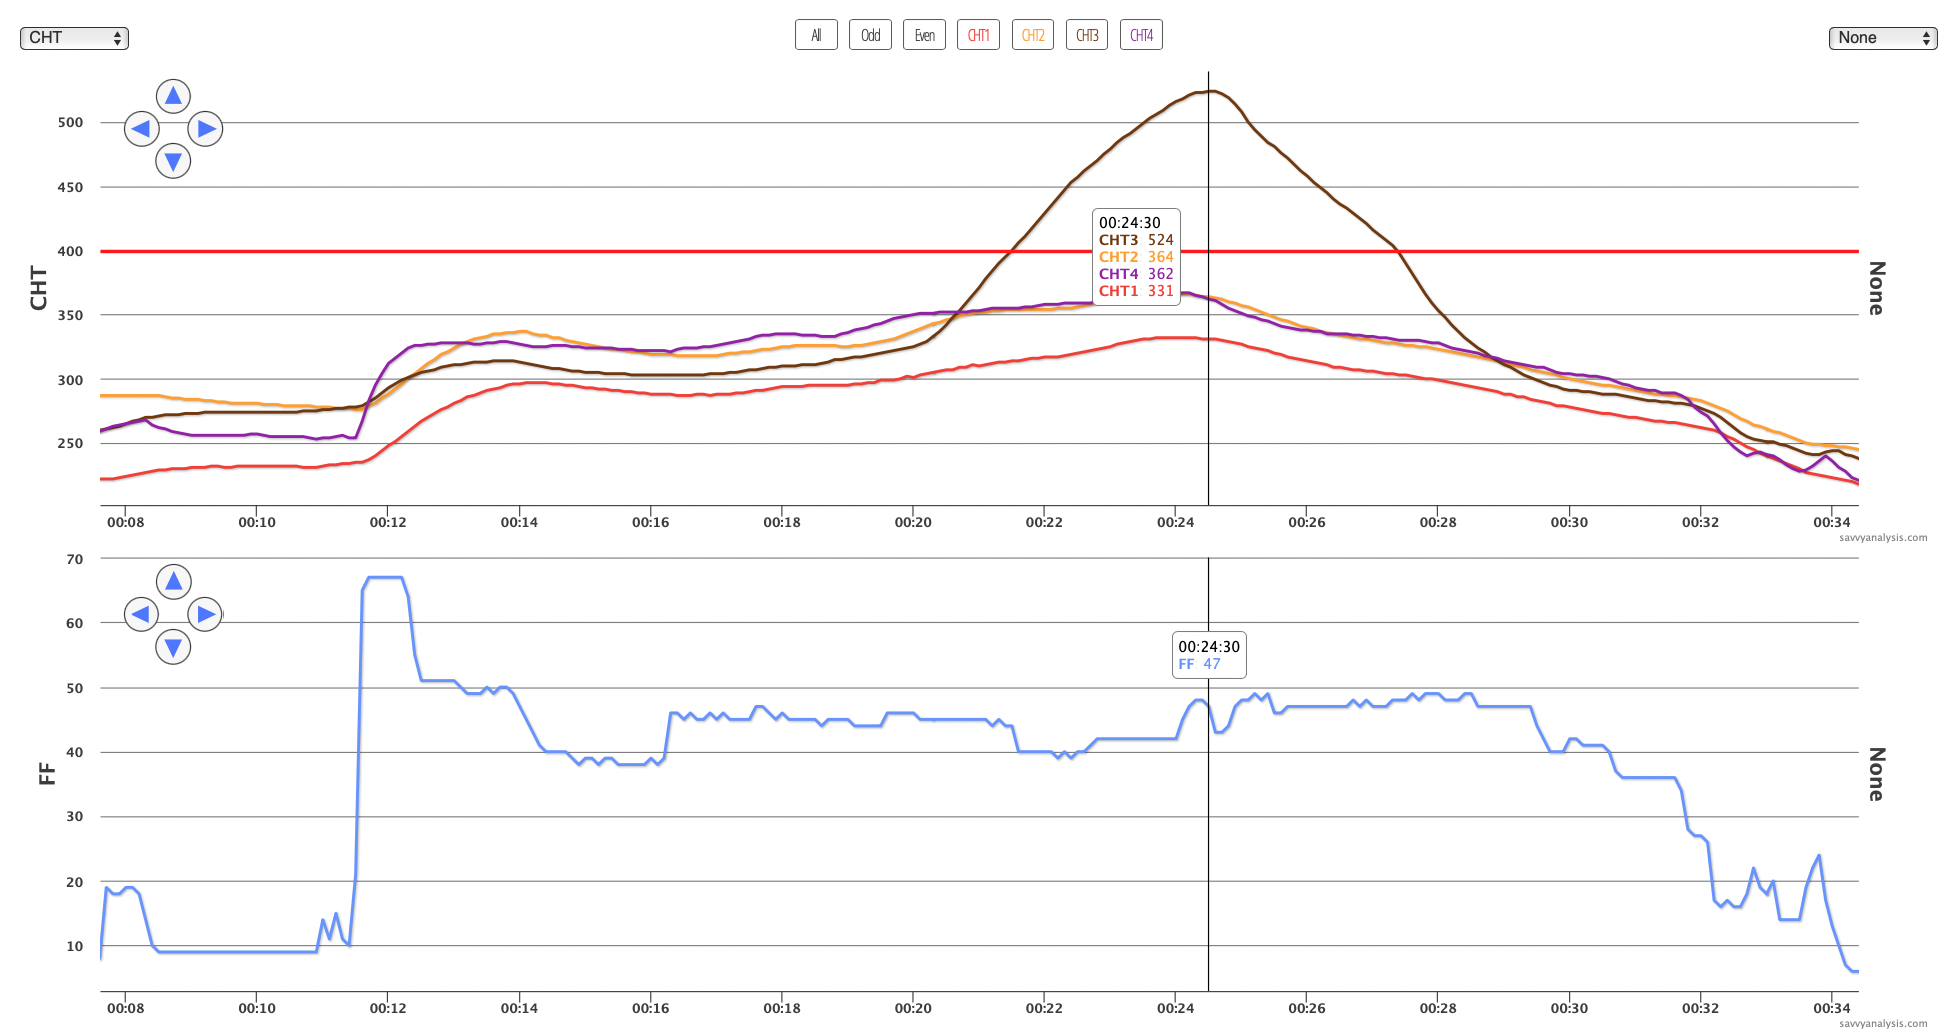
It looks like once the CHT excursion was spotted, there was a slight drop in FF – just before the 22 min mark. We think the smart move was to go full rich.
Here’s what Mike Busch says about detonation —
As pilots, we can usually avoid such damage by being alert for the excessive CHT and depressed EGT that is characteristic of detonation, and reacting promptly by reducing power and going to full-rich mixture.
