One of the first steps of engine data analysis is evaluating the reliability of the data. In recent Puzzlers we’ve seen probes that didn’t fail spectacularly, they just kept sending data that was almost believable, and could – if you saw it in real-time, cause you to adjust your flight plan, or – if you saw it depicted later, cause you to question whether maintenance was needed.
It’s a good mental challenge when we get one of those tricky sensors that appears to be telling little white lies, and we have to investigate other data for corroboration or contradiction. Just the same, we’re happy to see data where the sensor is trying to get us to believe a whopper we just can’t buy.
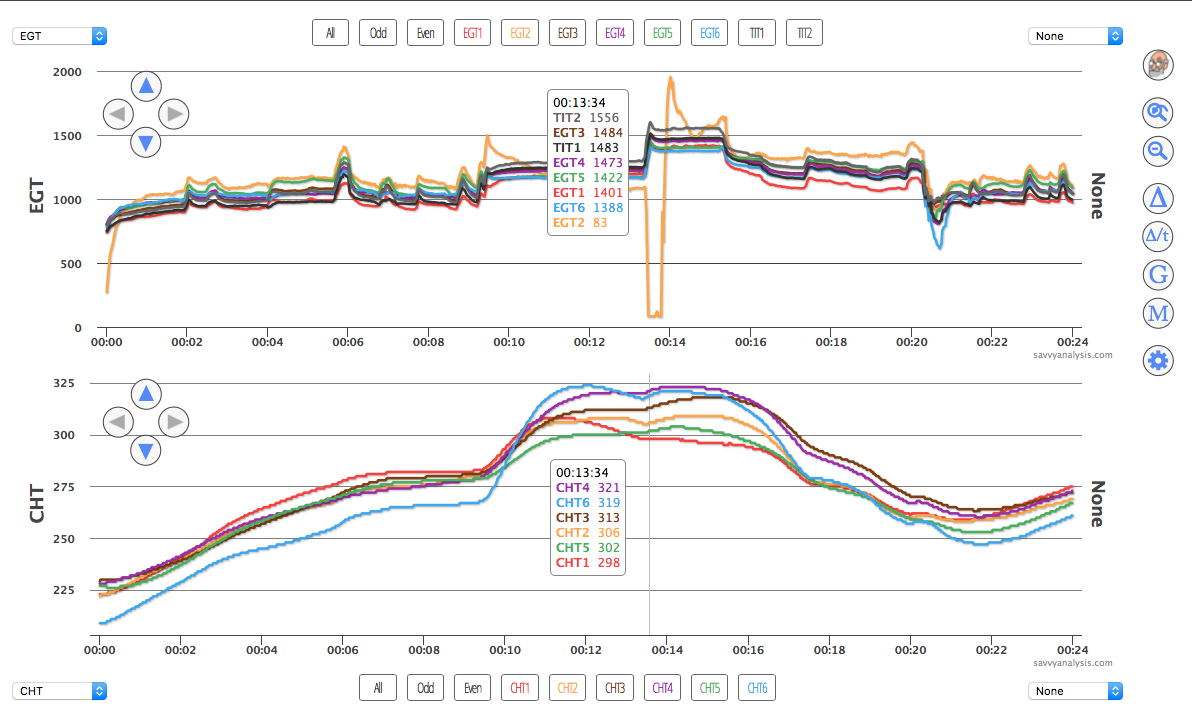
Let’s start this month with data from a Cirrus SR22 with a Tornado Alley IO-550-TN and data from a Garmin Perspective with a 1 sec sample rate.

EGTs are a little wobbly after engine start and through the taxi – that’s not unusual with a turbo. EGT 1 – the red trace – makes its first excursion to the downside just before power is applied and EGTs smooth out. Then it looks ok in the climb until about the 15 min mark, when it jumps from the 1250º range to about 1700º. If that got your attention, you’d be looking at TIT or CHT for corroboration – nothing.
A bad plug will usually cause EGT to rise 70-100º. This isn’t that. An injector clog should also have an effect on CHT. We’re not seeing that. About five minutes later, the pilot leans a little, causing most EGTs to rise, but the red trace dips a little, then jumps to 2000º and flatlines. On the next power change, the probe gives up and sends a series of descending readings until power is reduced for landing. Usually it’s a good idea to check the connection before replacing the probe, but this one looks like a good connection – for a failed probe.
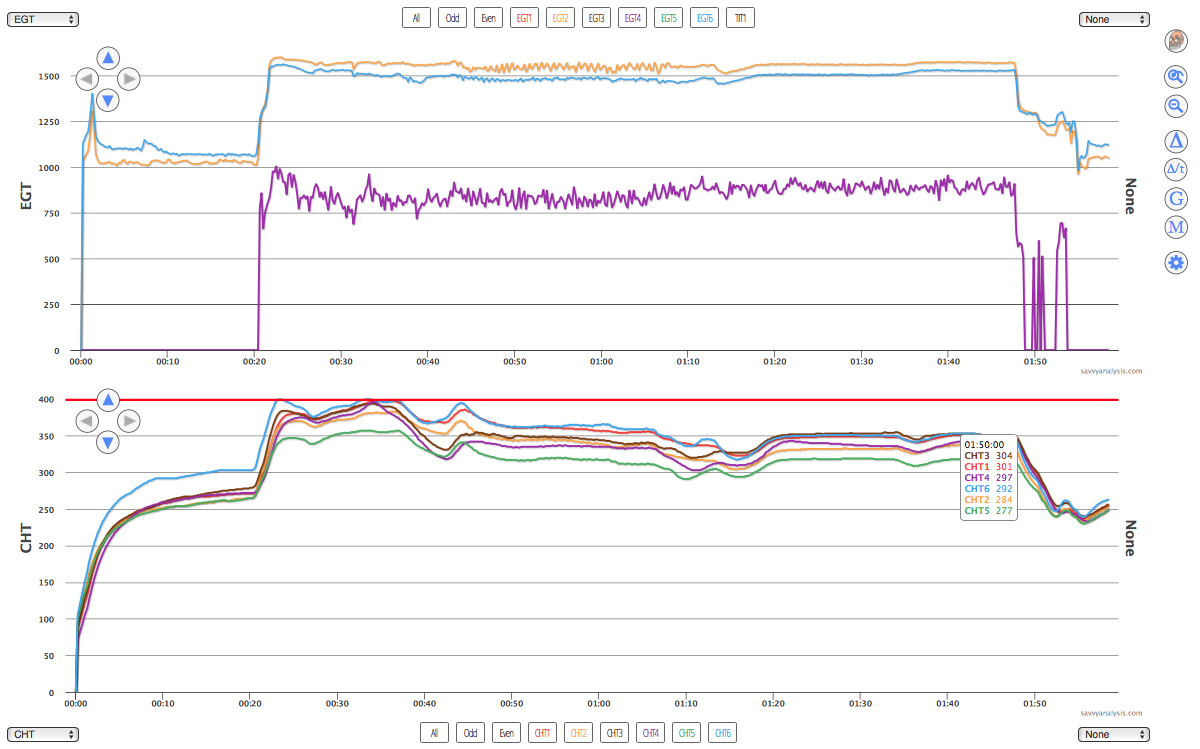
Next up is data from another Cirrus SR22 with a Tornado Alley IO-550-TN and data from an Avidyne with a 6 sec sample rate.
This time it’s EGT 2 – the orange trace. It starts out low, then looks normal, if a little on the high side, then spikes a little at takeoff, then does its whiplash move. Interesting that its low mark is 83º – not zero – and its high mark doesn’t quite get to 2000º. Maybe more interesting is that it settles down after all that and looks believable – but still a little high.
Most of the time a 6 sec sample rate is adequate – this is one of those times where it would be nice to see what it did between 1000º and 83º and almost 2000º. Looking just to the left of the cursor, CHT 2 does dip a little there, but CHTs 4 and 6 – the purple and blue traces – also dip there. This is one where we’d probably see what it did on the next flight before attacking it with tools. But we’d be ready to replace if it acted up again.
Here’s data from yet another Cirrus SR22 with a Tornado Alley IO-550-TN and data from an Avidyne with a 6 sec sample rate.
I have hidden the EGTs for the odd cylinders, but all CHTs are visible. This time the fat lady is still in the dressing room. For 20 mins, EGT 4 – the purple trace – flatlines at zero. Presumably the pilot noticed this, but noticed a normal CHT 4 and decided to ignore the EGT. Then as power is applied, EGT 4 comes alive, but – to me at least – seeing it bouncing around in the 700º range is more distracting than the flatline at zero. CHT 4 still looks normal.
Just about the time you would get used to the jumpy EGT 4 – at about the 45 min mark – EGT 2 develops a pattern. The waveform is a little too fast and shallow to suggest the FEVA pattern of a failing valve. EGT 6 – the blue trace – looks normal. The EGT 4 pattern changes a little there, too. Then, not quite a half-hour later, the EGT 2 pattern goes away and we’re left with EGT 4 jumpy below 1000º, until approach and landing. In the air it’s jumpy and inacurate, but alive, and it’s dead on the ground, so that makes a case for a loose connection vs a failing probe.
Next up is data from the R engine of a Piper Aztec with a Lycoming IO-540 engine and data from an EI CGR-30P with a 1 sec sample rate. Fuel Flow is depicted on the top along with EGTs.
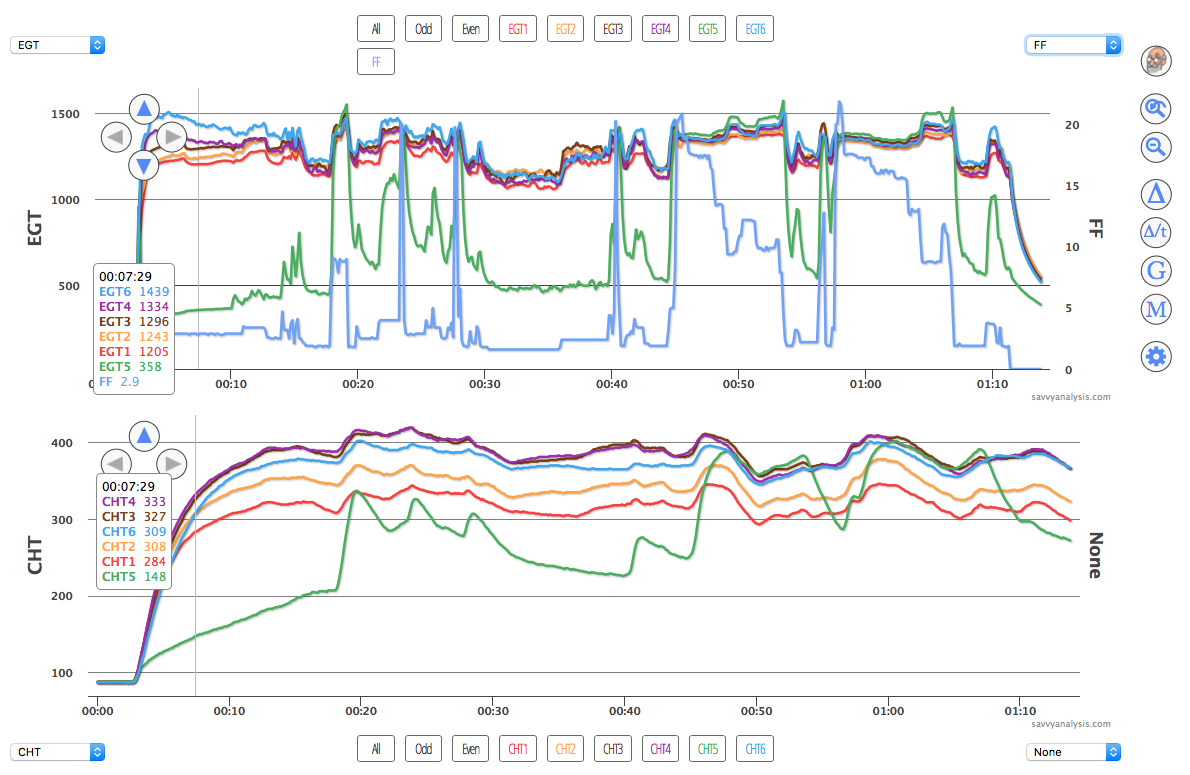
With the three previous odd EGT scenarios, we didn’t have corroboration from their CHT partners. Here we do. The green traces move together, and in the same direction, which is a characteristic of a clogged injector. The first increase in fuel flow – before the 20 min mark – looks like the runup. Then it looks like a series of five takeoffs with immediate power reductions. Remember, it’s a twin, so they’re probably practicing engine-failure emergencies. By the fourth takeoff – around the 45 min mark – it looks like the cylinder is almost normal with fuel flow at 10 GPH or above, then it struggles when power comes to idle.
Just to be clear, this is not a failed-probe fat lady. This is an injector clog fat lady. But it’s in this Puzzler because we rarely see such dramatic depictions from injectors.
It has been a while since we did something electrical so let’s finish this month with that. Before I spill the beans about why, here’s data from yet another Cirrus SR22 with a Tornado Alley IO-550-TN and data from an Avidyne with a 6 sec sample rate. Master Bus and Essential Bus are the green traces, AMP 1 and AMP 2 are the red traces.
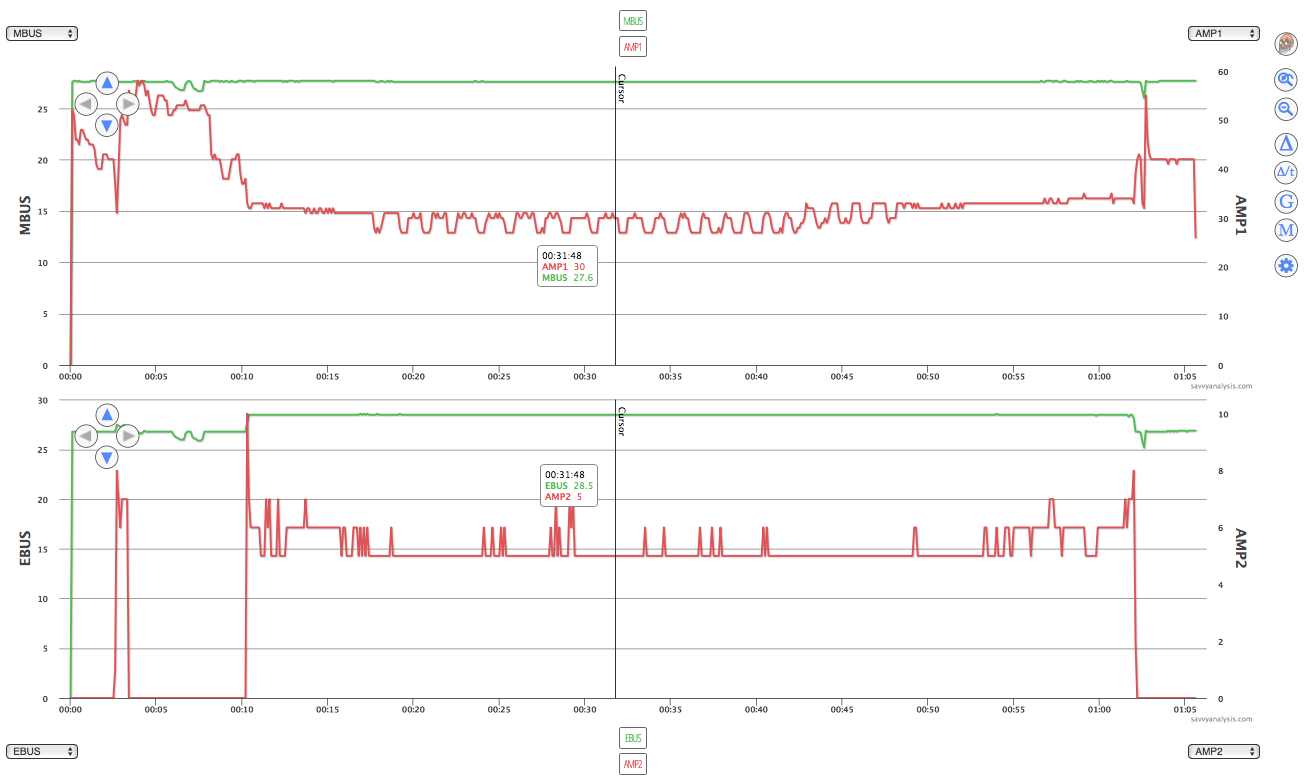
The symptom was a dead battery. Alternator output was checked and found to be ok, so the owner installed a new battery. He flew for a few hours, landed at his destination, had a meeting and came back to another dead battery. So we took a look at the data.
Both bus voltages look normal. It’s normal for EBus to be a little low until RPMs spin up at takeoff. Let’s concentrate on the MBus and AMP 1 data. As power comes on, it’s pulling about 50 amps. It jumps to 60 – that’s probably engine start – then back to 50, then down to about 30 when takeoff power is applied. And it stays in that range, then adds a cyclic pattern for a while. This rung a faint bell for me.
At this point I should offer my thanks to the legendary aviation writer Richard Collins. Many years ago, as a new airplane owner, well before the internet and digital engine monitors, I read everything I could get my ink-stained hands on to become a more educated owner and pilot. In one of his articles, Collins mentioned that you could spot a hung starter because it would continue drawing about 30 amps even once the engine was running. So to this day I glance at my legacy ammeter after engine start – and I haven’t seen +30 yet.
So when I saw it here, I thought “Finally…”. That explains the dead battery – the alternator’s output was being gobbled up and couldn’t charge the battery in flight. We think that series of cycles in the middle of the data was a relay trying to turn the starter off, failing, and eventually wearing out. The airplane was already headed to the shop for its annual, so we suggested checking the starter, and sure enough it was not disengaging after engine start.
