I was channel surfing recently and landed on a Perry Mason rerun. First of all, it’s one of the great TV themes of all time. Hats off to Fred Steiner. Private Detective Paul Drake just oozes cool with his wild sport coats and convertible sports cars. Della Street was smart with just the right amount of allure. Poor DA Hamilton Burger – like Wile E. Coyote and the Washington Generals – he was destined to be outplayed. Over the course of the hour, Perry would often get foiled – sometimes by Lt. Tragg and sometimes just by events – but would eventually solve the case and get the murderer to admit guilt on the witness stand.
When we’re analyzing engine data, most of the time we can spot the guilty party, and confidently make a recommendation for the appropriate maintenance. We know your time is valuable, and we know operating and maintaining an airplane isn’t cheap, so the goal is to only make recommendations that we are confident will solve the issue. Sometimes the analysis team will consult each other, or one or more Savvy account managers to try and get the Perry Mason moment. When we’re all stumped, our response is to step through the probabilities and the thinking behind them. Sometimes the Puzzler follows that pattern. If there isn’t a PMM I still think it’s instructive and valuable to step through what could be happening and to rule out what we can rule out.
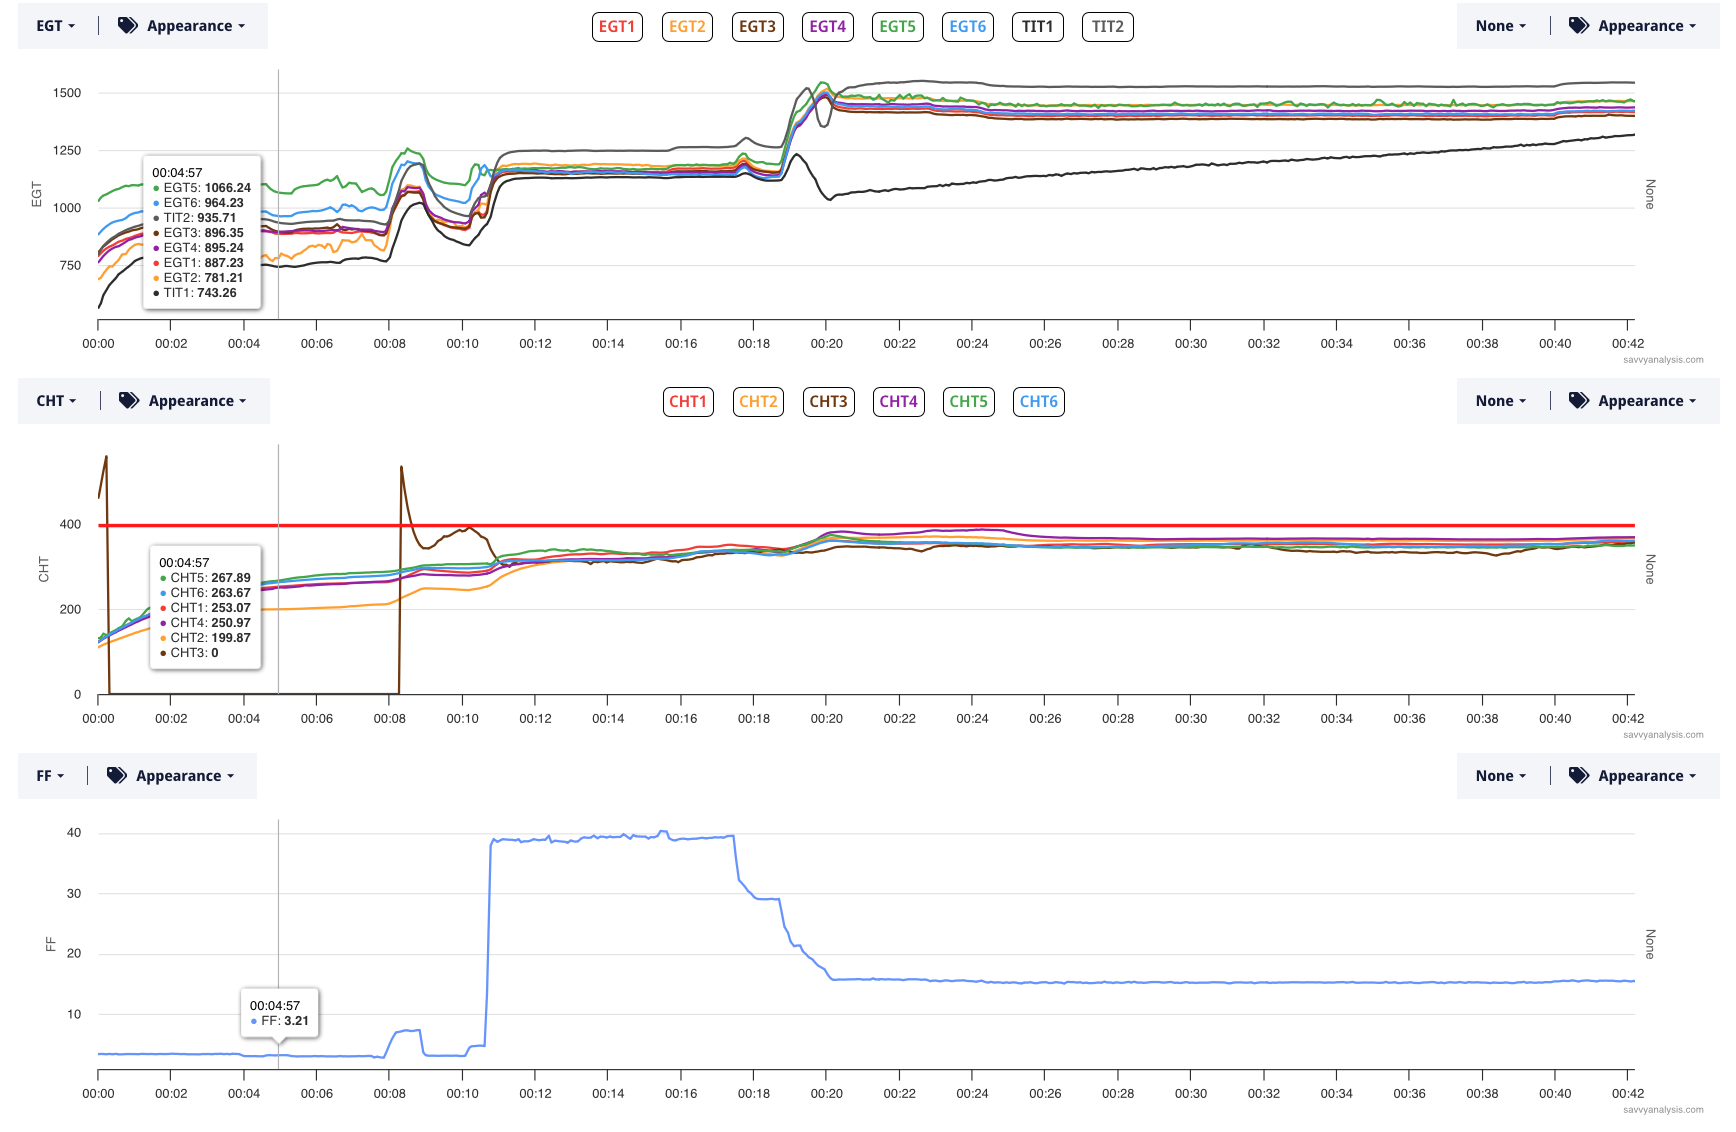
Let’s start this month with a Cirrus SR22 powered by a Continental IO-550 and data from an Avidyne with a 6 sec sample rate. Here’s a recent hour-long flight. EGTs, CHTs and FF. The cursor is off to the right to keep it out of the way.
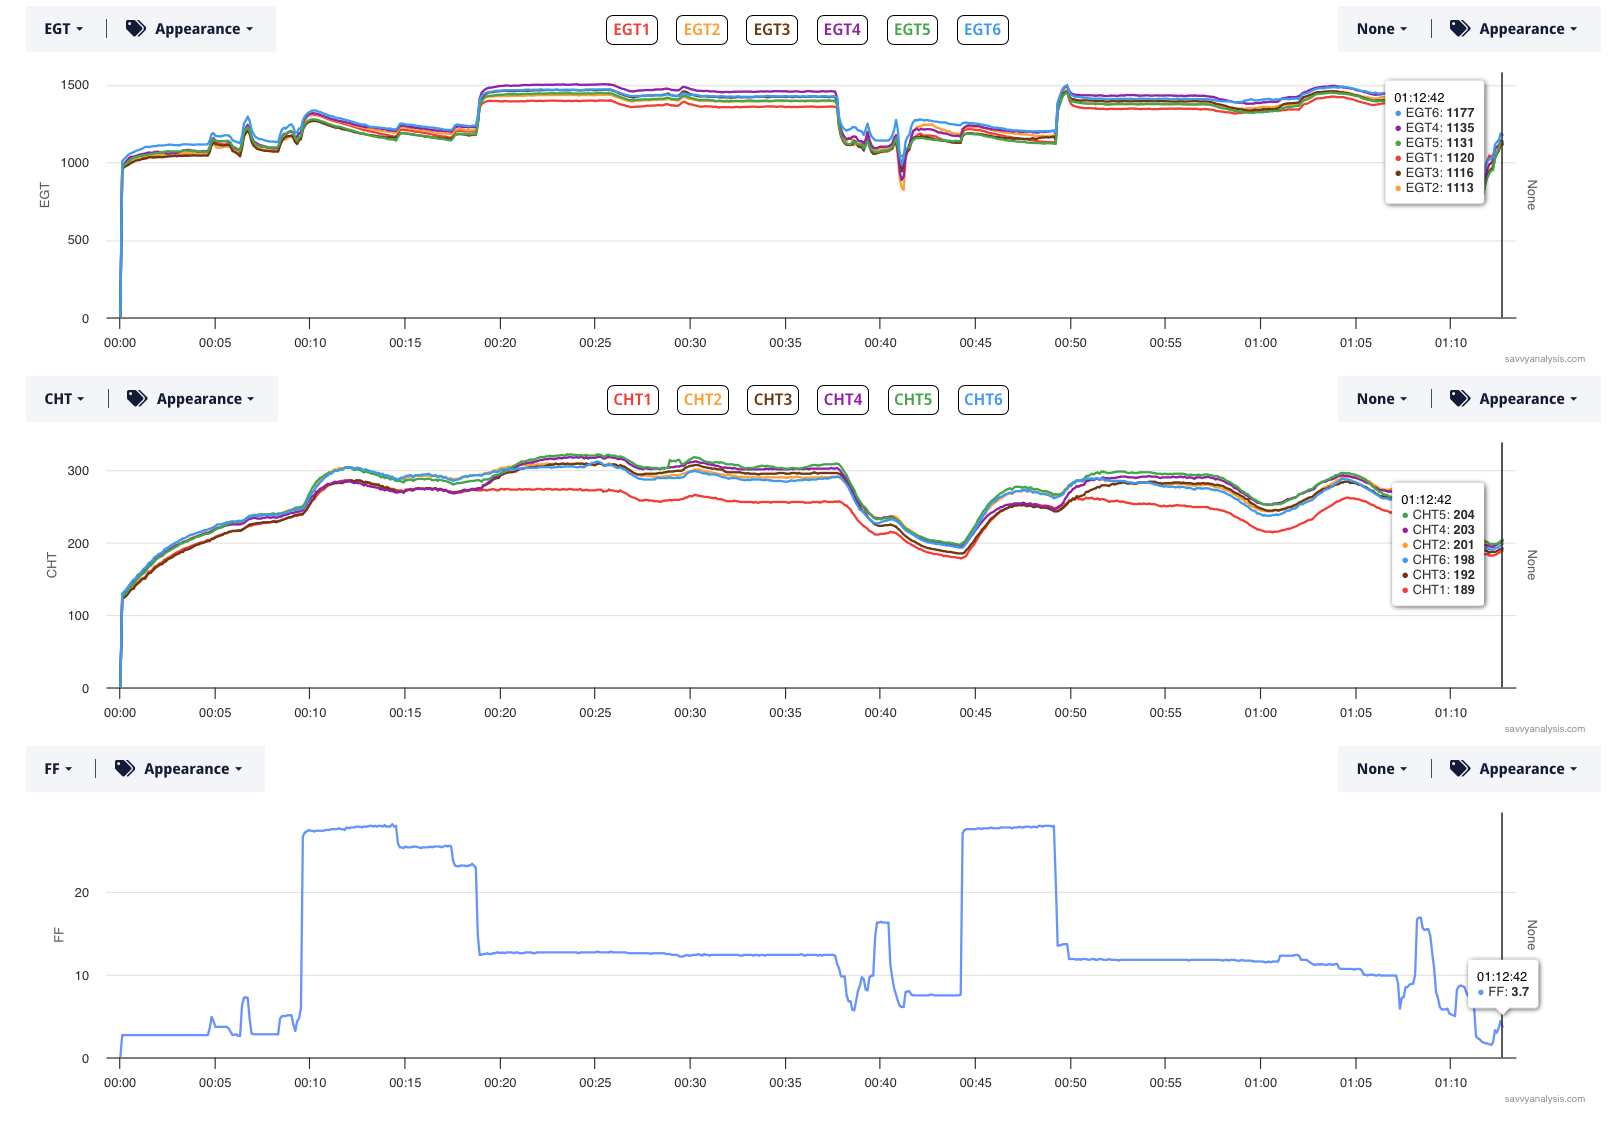
CHT 1 is low throughout. EGT 1 is in the pack during takeoff and initial climb, then moves to lowest in cruise – both times at 20 and 50 mins in the timeline). So it’s not acting like a clogged injector, and not acting like weak spark. There might be a problem with the rings which is best diagnosed with a borescope inspection. But the issue that generated the ticket was spikes in the RPM data. Let’s take a look at that. Here’s RPM in green and MAP in red for two recent flights. Redline is 2700.
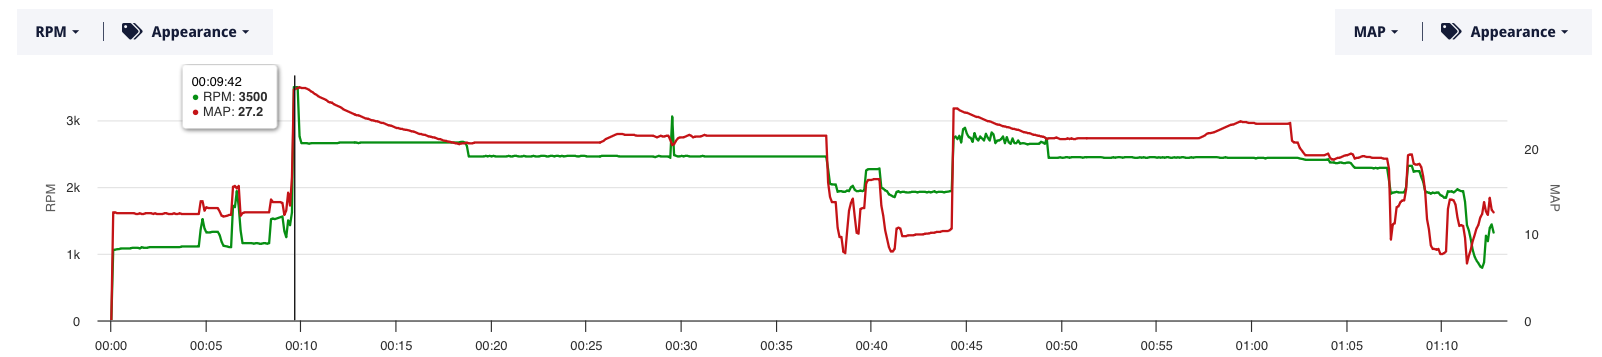
RPMs peak at 3500 on the first takeoff and are wobbly on the second takeoff.
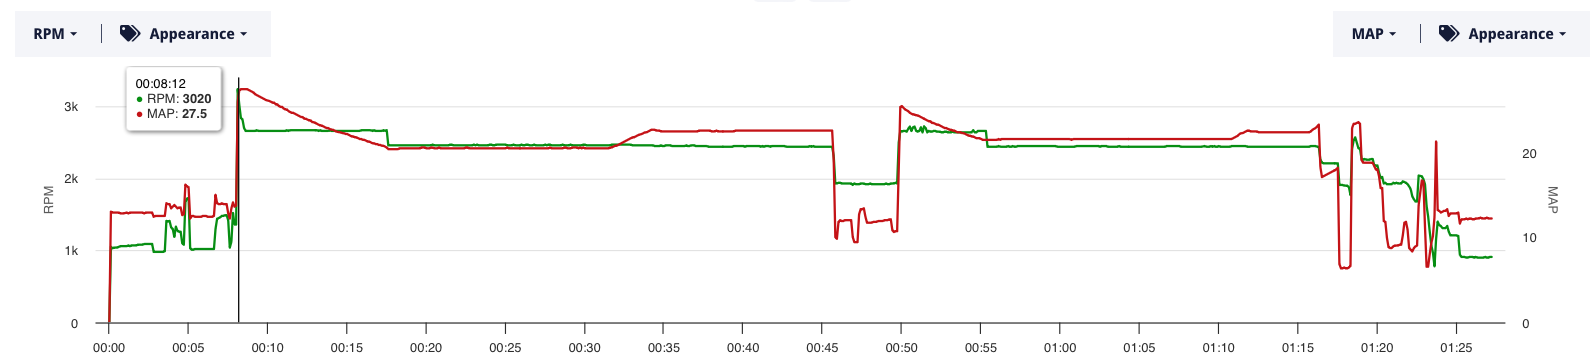
RPMs peak at 3020 on the first takeoff and are wobbly on the second takeoff. Are these numbers real or is this a sensor error? If they’re real they probably indicate a catastrophic failure of the counterweights and would require an engine teardown. Plus, the mags send the RPM data so they’re probably fried, too. To answer the real or not question you might wonder what oil temp and pressure are like during these excursions. Here are oil pressure and temp, with RPMs below. This is the flight with the peak at 3500.
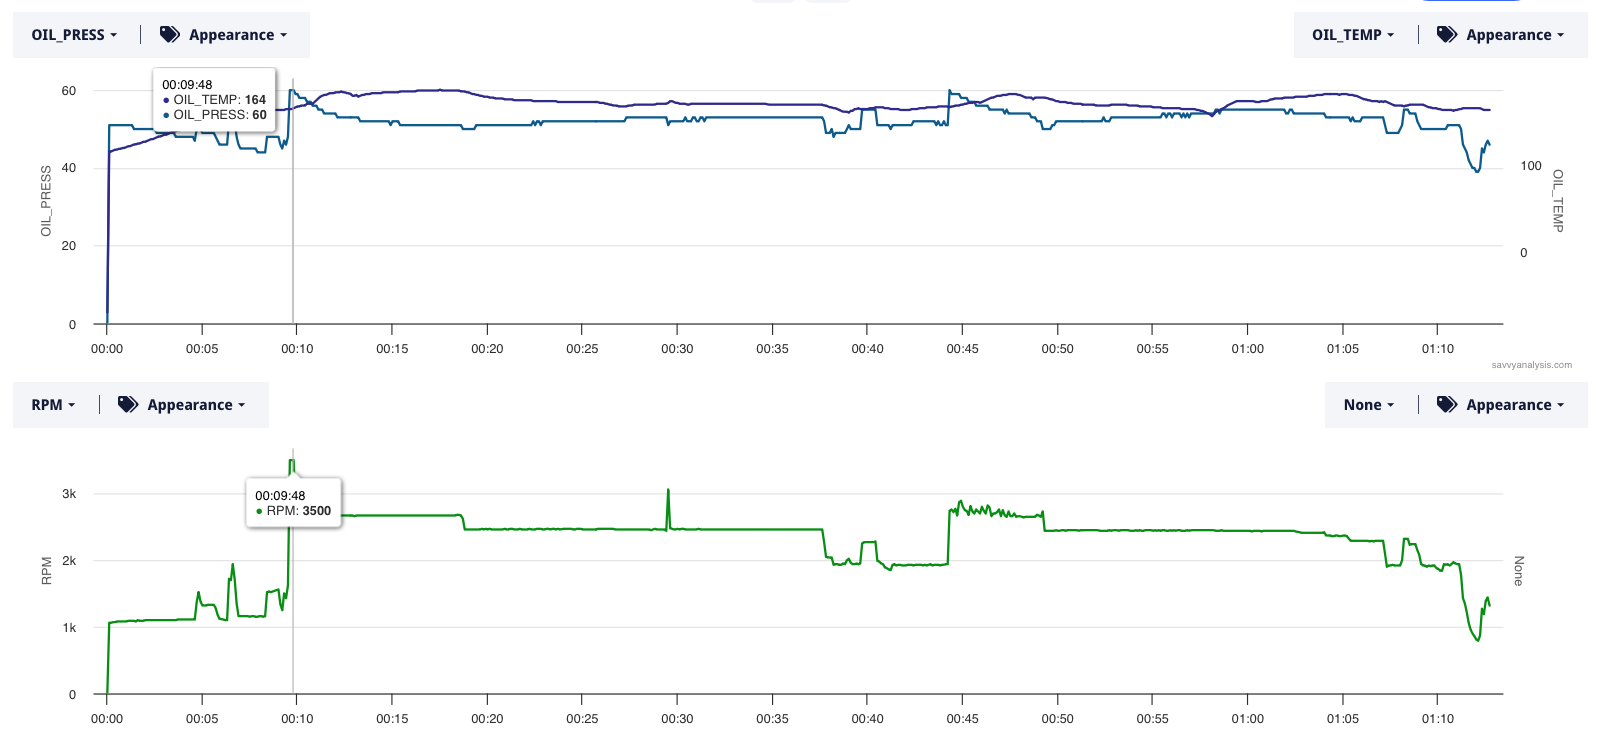
So nothing out of the ordinary here. Oil pressure is a little high. Here’s a fact not yet in evidence. There are also recent flights without RPM spikes – and oil pressure is in this range on those. One question we had is why is there a spike followed by normal readings on the first takeoff but there’s no spike the second takeoff – just wobbly readings. And there’s a spike at the 30 min mark in mid-cruise in this flight, but only one flight. And is it corroborated in oil pressure and temp? There are slight movements in each at that point. But – there are other slight movements in each elsewhere in the flight but no corresponding spike in RPMs. One more factor to consider – the Avidyne’s 6 sec sample rate means that the spike to 3500 was more than momentary. The three samples mean it was at least 18 secs long.
Our conclusion – check the RPM sensor. It always makes sense to check the connection first, but with a loose connection we’d expect to see normal readings mixed with abnormal or erratic readings. So some 2700’s and maybe some zeros with a lot of movement in-between. We’re not seeing that. This looks more like the failure of the RPM sensor. But that’s good news compared to the time and expense of a tear-down.
Next up is data from a Cessna 182 powered by a Lycoming 0-470 and data from a JPI 700 with a 2 sec sample rate. EGTs, CHTs and FF. The cursor is on peak CHT of 672º.
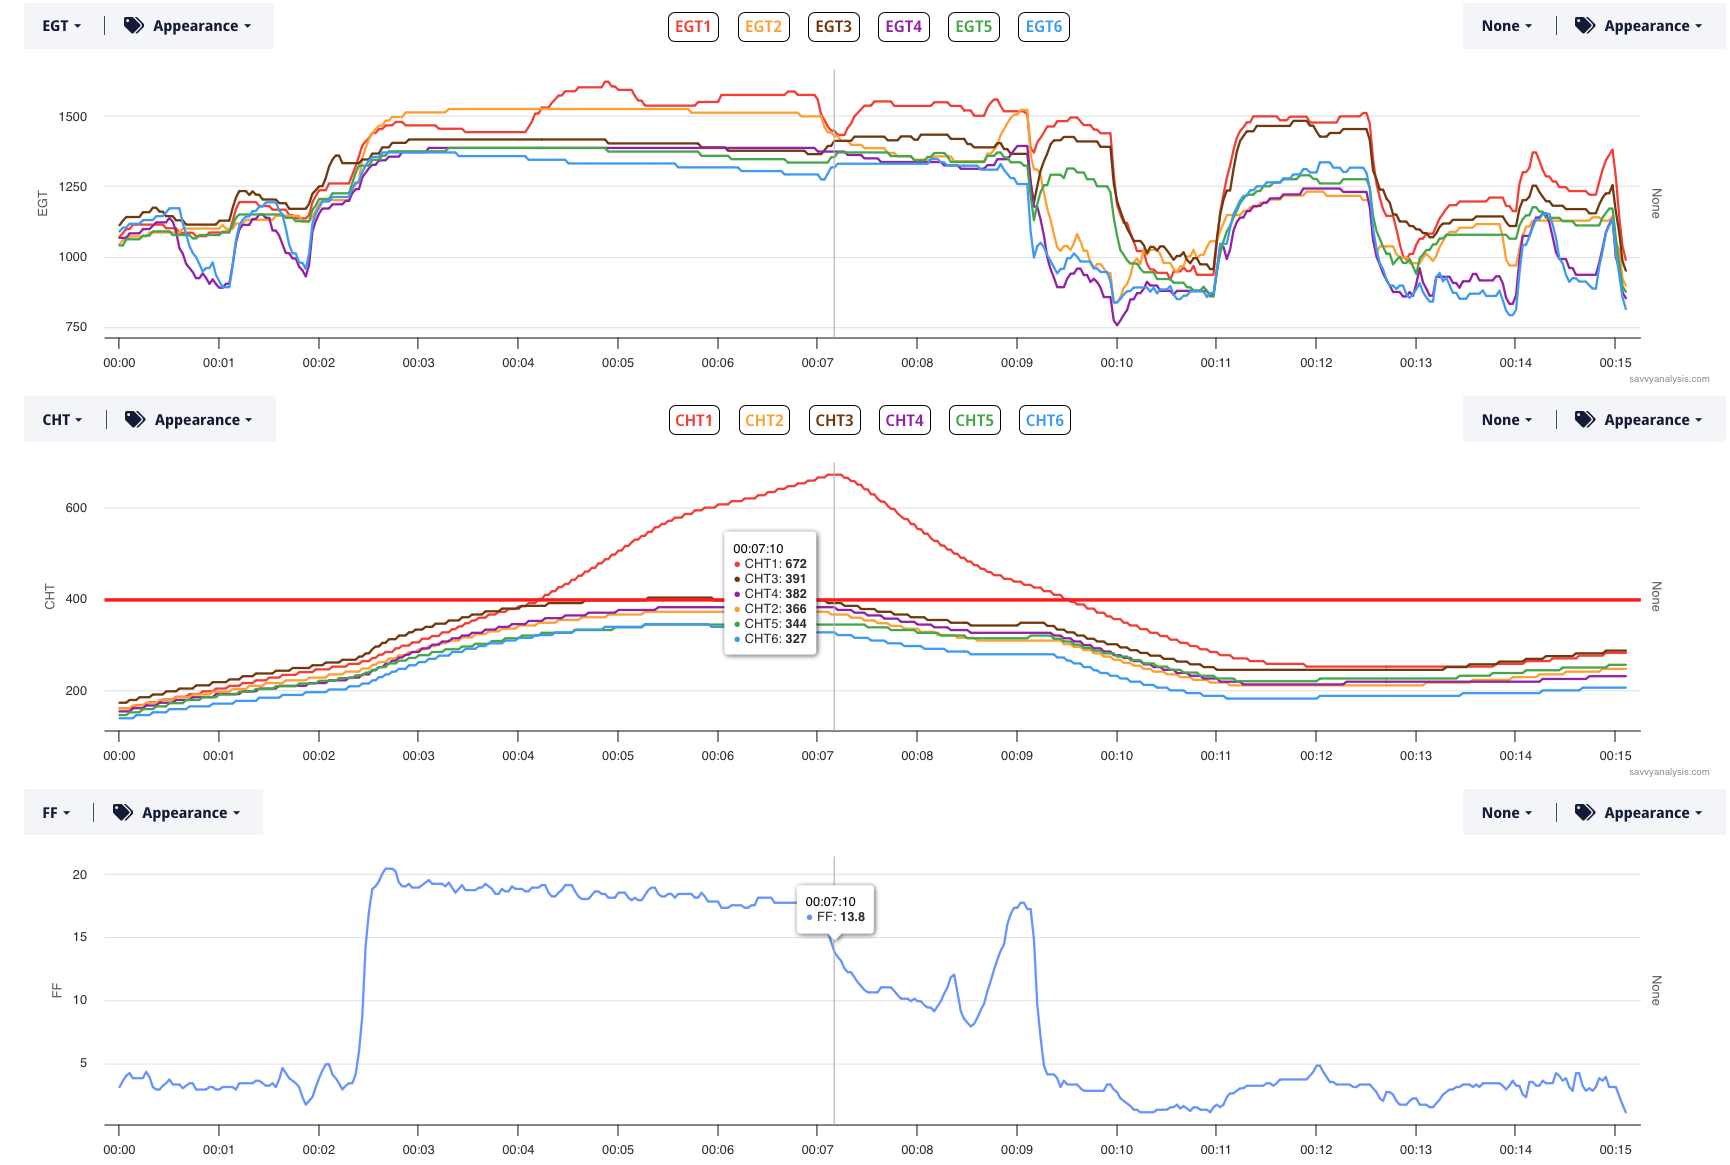

Our ∆/t tool calculates that CHT 1 rises at about 90º/min starting at the 4 min mark. This is as good a Perry Mason moment as you’re likely to see. The ceramic failed in one of the plugs of cyl 1 resulting in this pre-ignition event.
Those horseshoe-shaped pieces are what’s left of the piston rings.
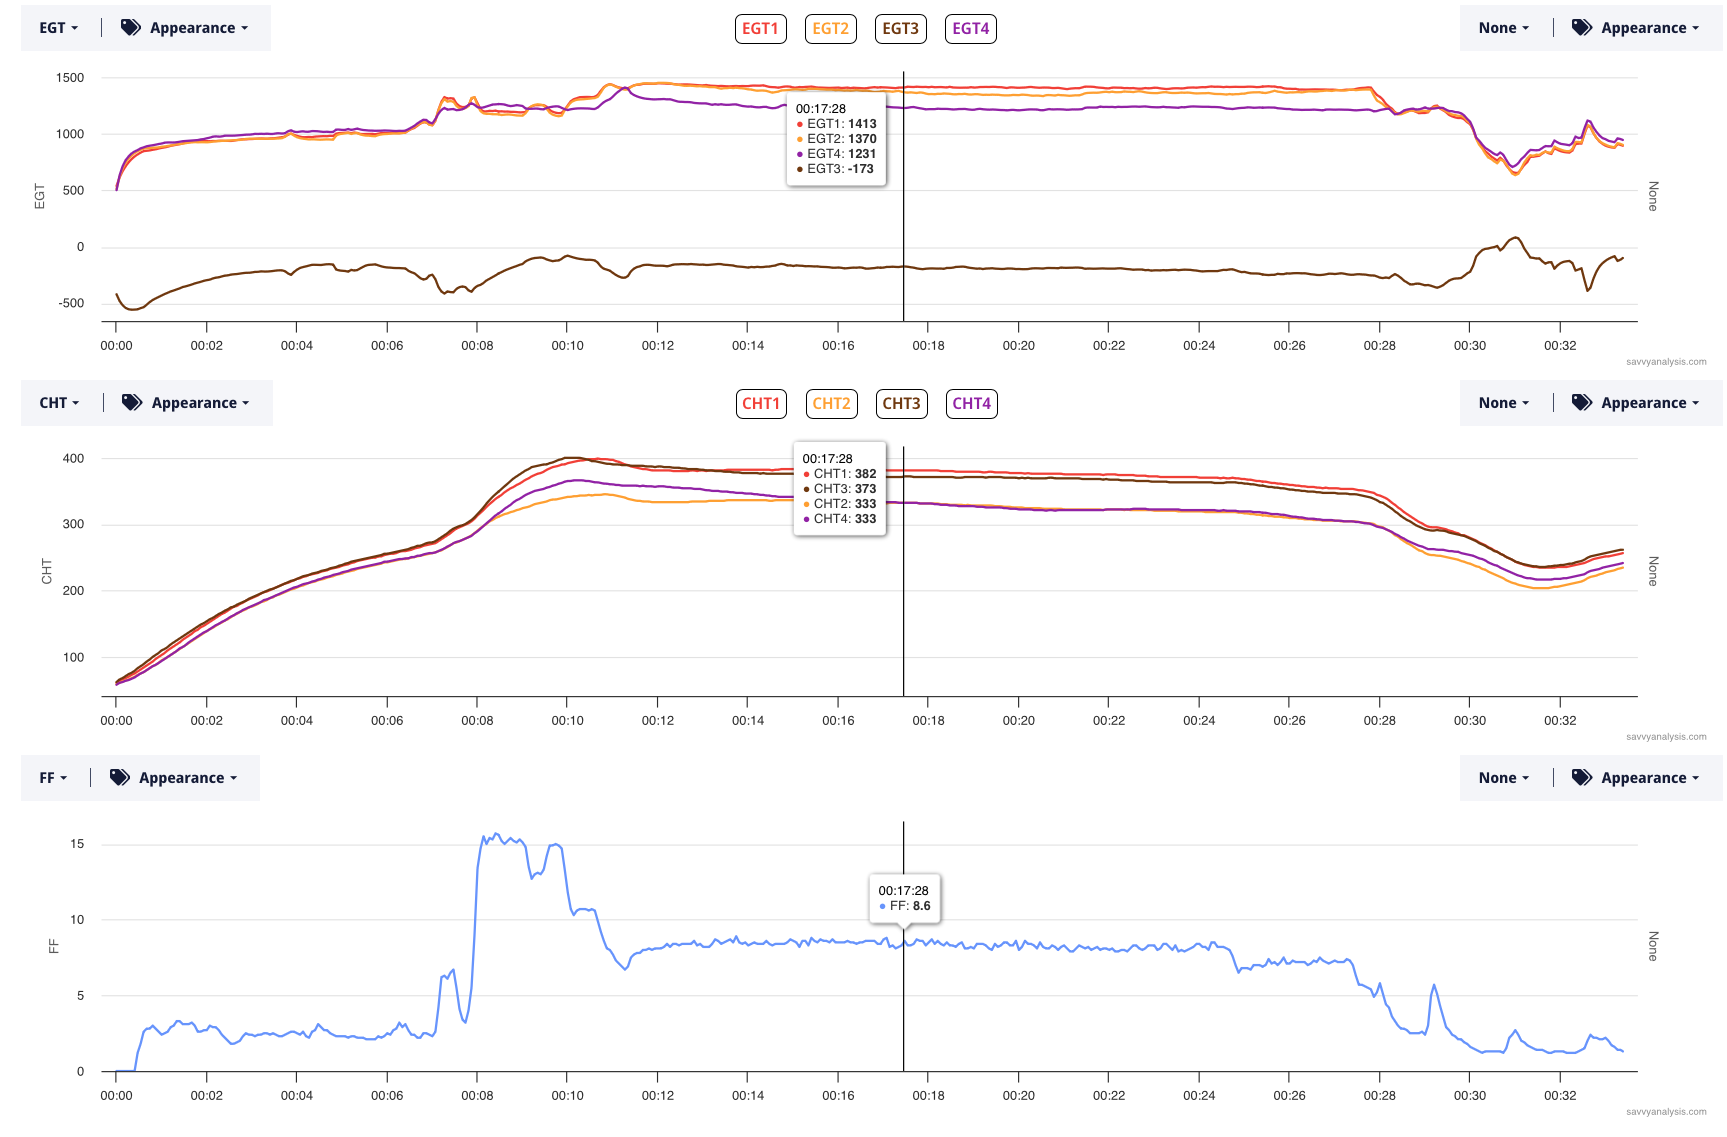
Here’s one of the stranger ones we’ve seen lately. This is from a Cessna 172 powered by a Lycoming O-360 and data from a newly-installed Insight G4. EGTs, CHTs and FF.
Interesting how EGT 3 is a mirror image of the other EGTs. Could it be as simple as the newly-installed probe was hooked up backwards – so all the EGT numbers are sub-zero? Sure looks like it.
We’ll end 2023 with an homage to all the football games we’ll be seeing between now and January 1st. Here’s a set of goalposts made by the failing CHT 3 probe on a Columbia 400.