I grew up in a river town – Cincinnati – then moved to a lake town – Chicago – and then to an ocean town – Encinitas, CA just north of San Diego. I just started listening to David McCullough’s new book The Pioneers and was happy to hear it begin on the banks of the Ohio. My primary flight instruction was out of KLUK and we often flew up and down the river. Later, living in Chicago, I would rent Cessnas for flight lessons and stay-current trips from KMDW to the Mississippi. I also remember staying low over the Illinois Fox to stay under the Class B at KORD, and – while on vacation in Alaska – landing a 172XP on the Chena and the Tanana for my seaplane rating out of KFAI.
So maybe I was predisposed when I opened up data from an RV-10 and zoomed into the mag check. I have friends in and from Texas so I know I’m taking a risk being from the upper midwest and talking about the Lone Star state. But I’ll be danged if that EGT 3 trace doesn’t look like the Rio Grande. Ok, so there’s no panhandle and the Big Bend isn’t to scale, but I’ll still put it up against any other river depiction by an EGT during a mag check.
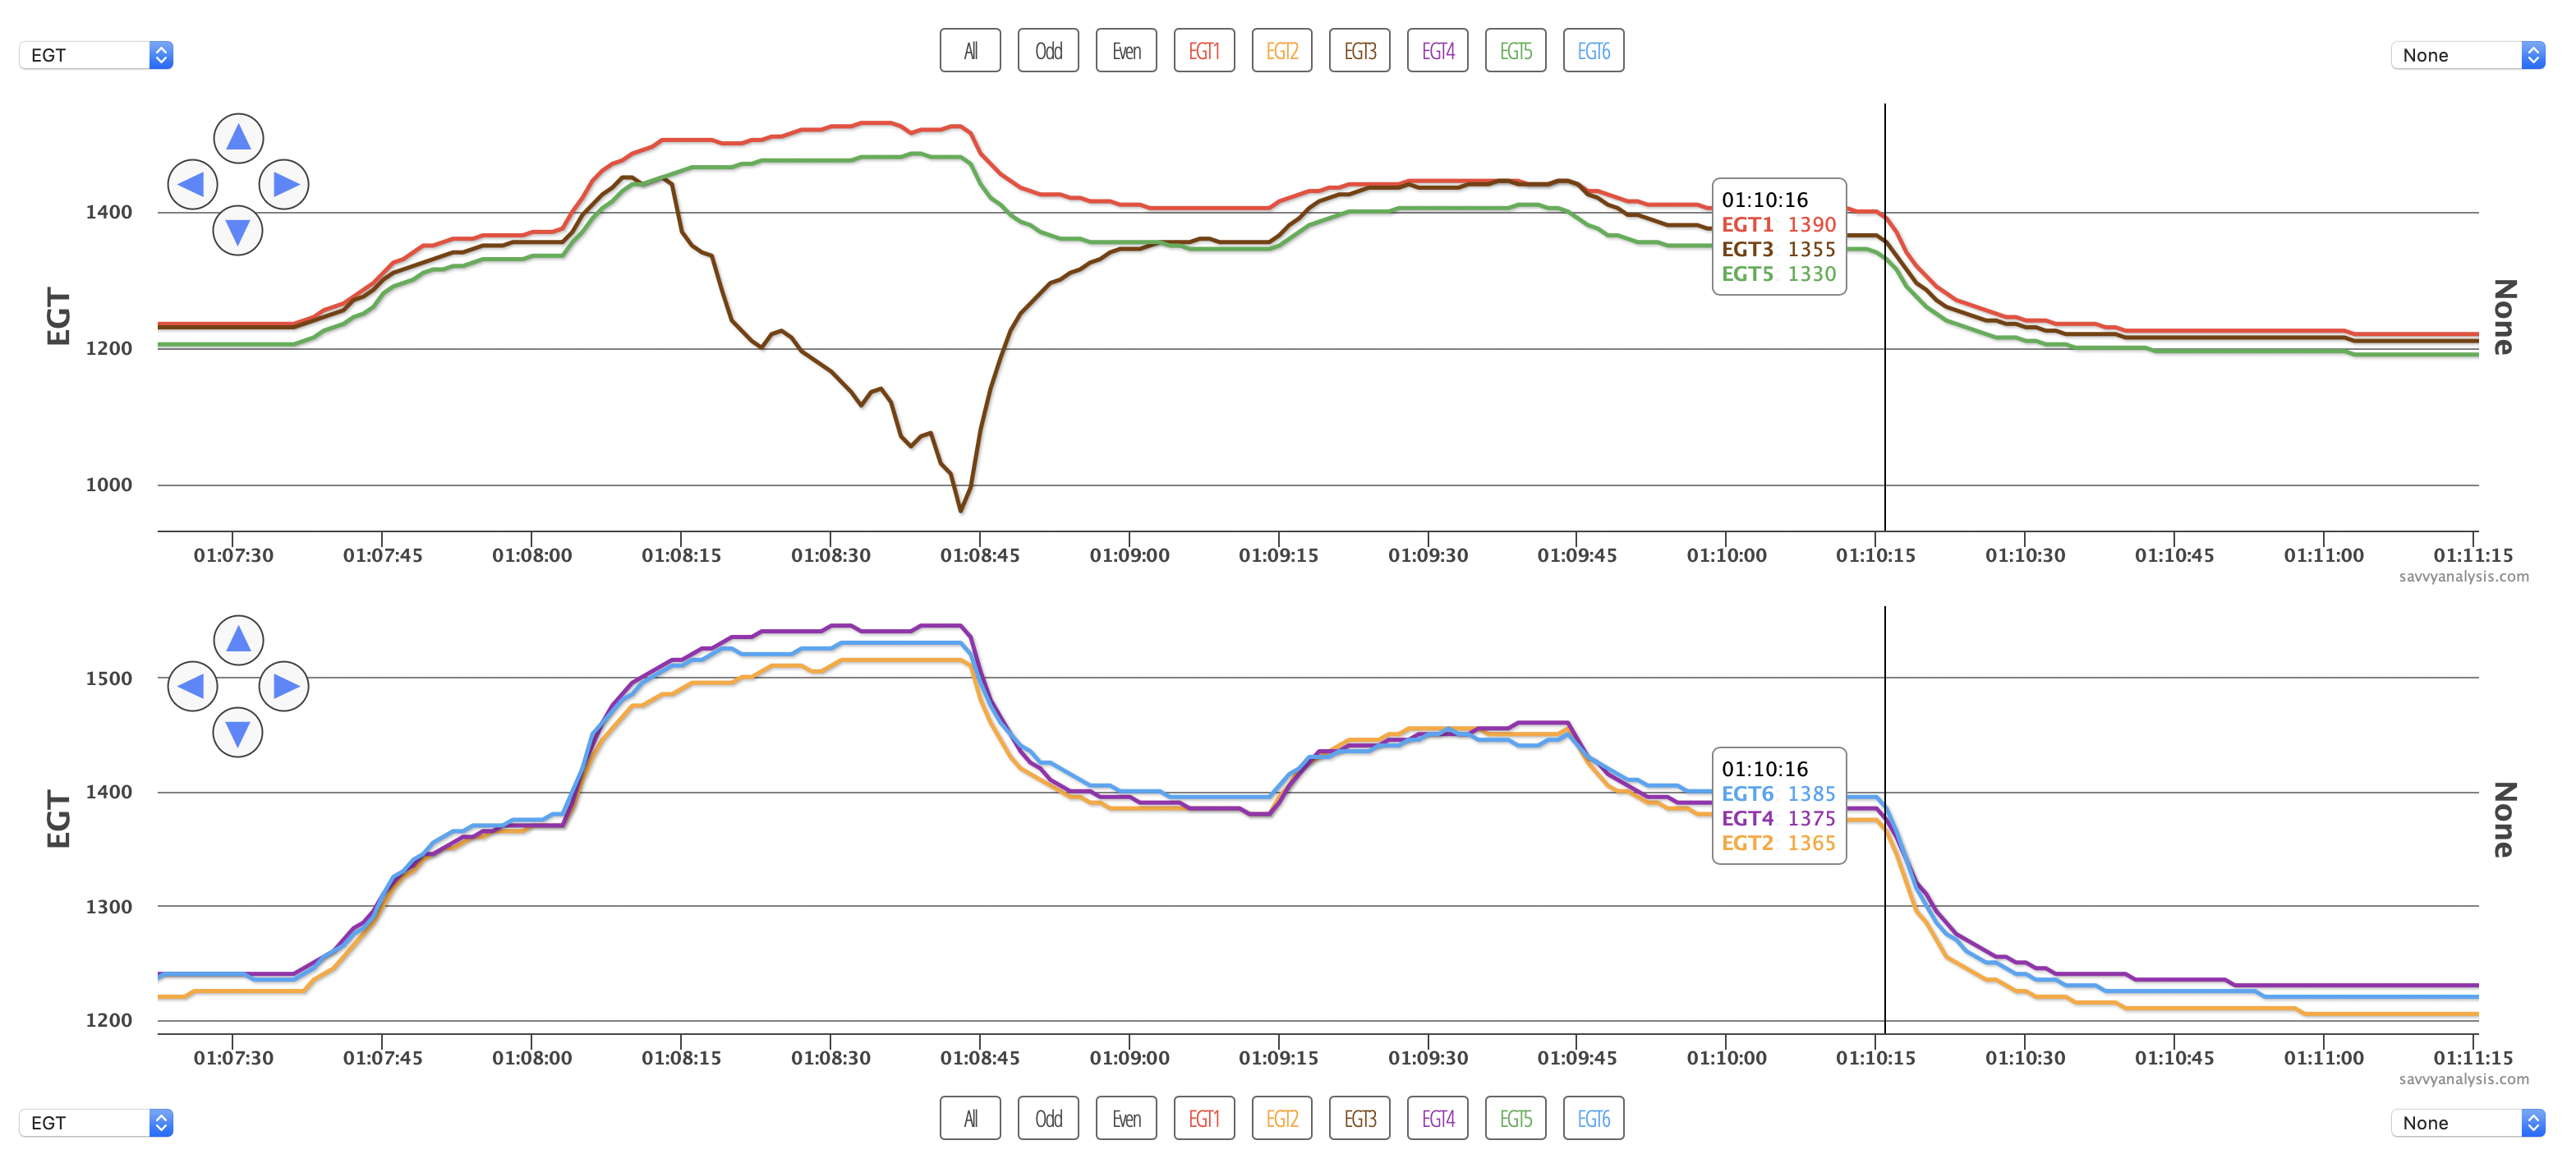
What about the data? I set up the display to show EGTs for odd cylinders on top and even cylinders below. This RV-10 has a Lycoming IO-540 with one Slick mag and one ElectroAir electronic ignition. When we look at a mag check for the standard two-mag configuration we expect the bottom plugs to post higher EGTs than the top plugs, so we’ll get two humps with similar highs. With this one plus one configuration – and depending on how they’re wired – we’ll probably get one hump and a little mesa. On this engine the mag fires the bottoms, so the bottom plug of cyl 3 looks like it’s ready to be tossed into the river.
It’s interesting that the spark got worse as the test went on for almost 40 secs.
Next up is data from a Cessna 172 with a Continental IO-360 and data from a JPI 700 with a 2 sec sample rate. EGTs on top and CHTs below. I’m zoomed into a 16 min segment of a 2+ hour flight.
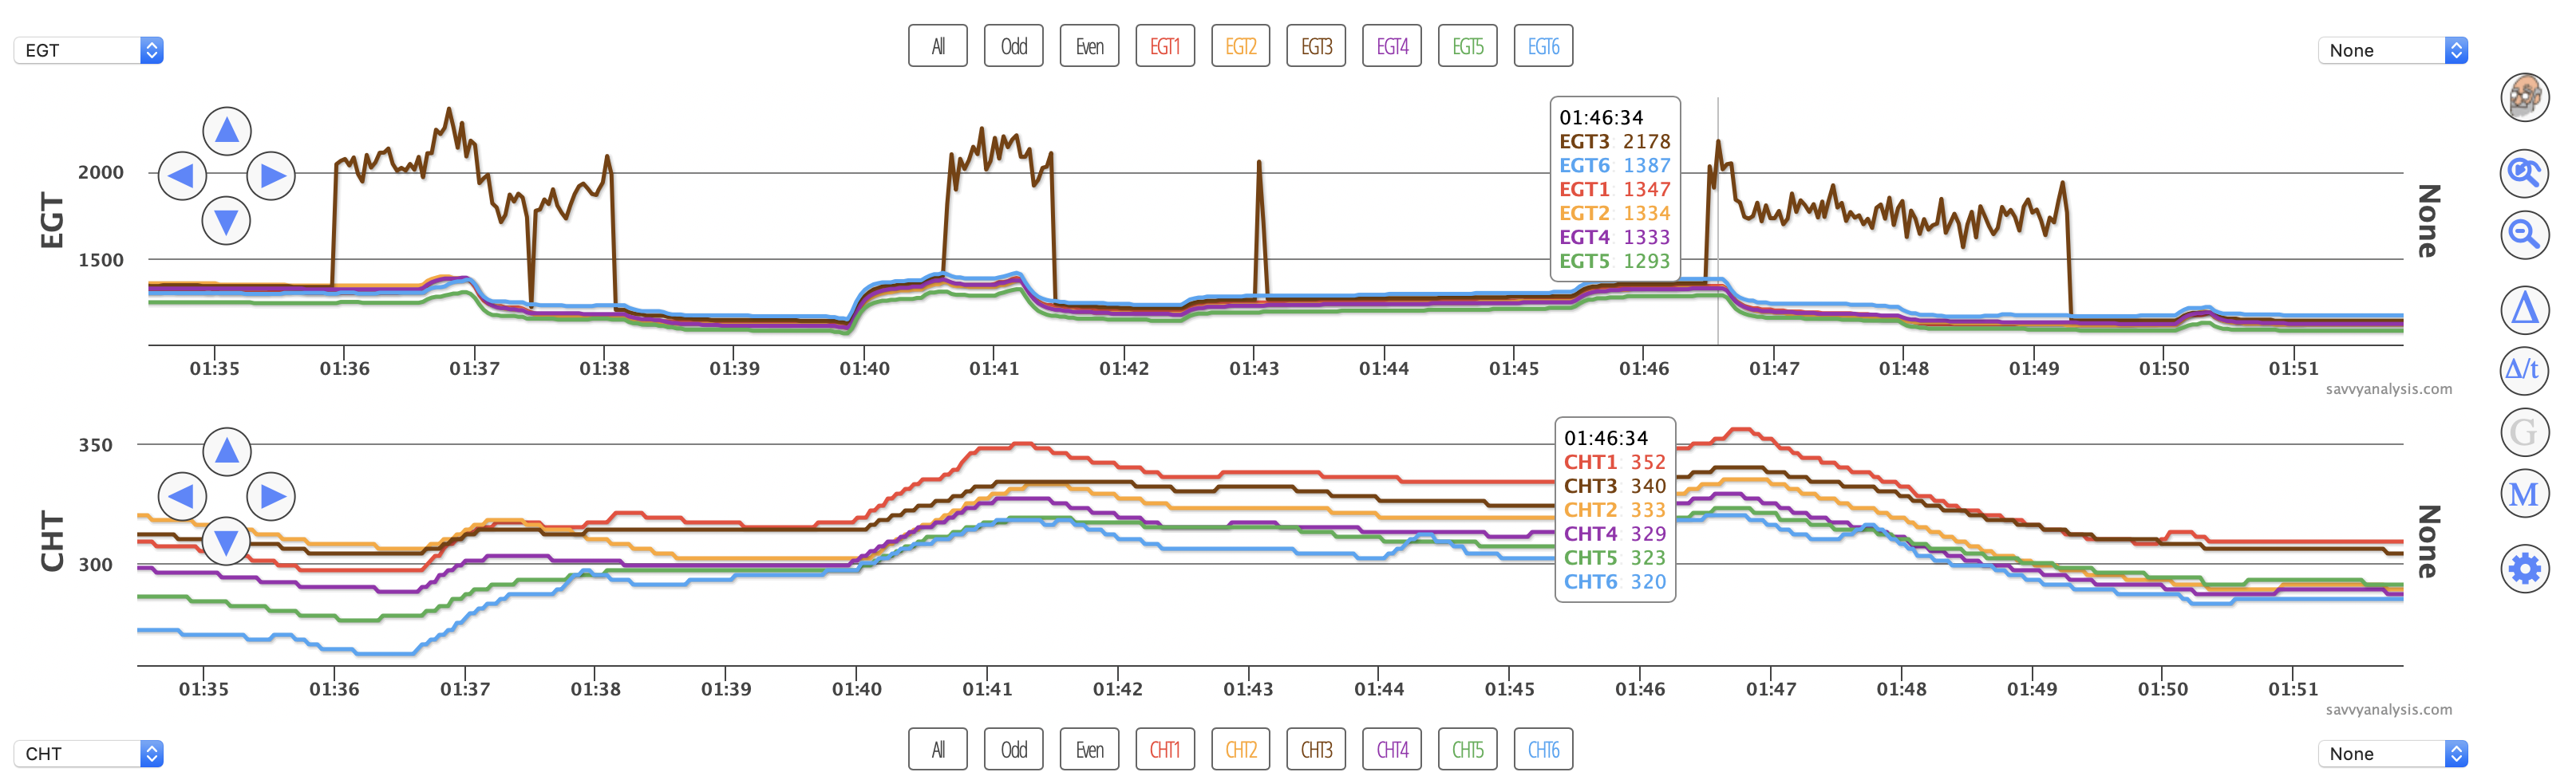
Typically we’d have no doubt pronouncing these as EGT probe failure indications. But the client said he had “fixed them” with changes to MAP and FF. (FF is not logged or I would have included it.) The instantaneous nature of the jump up and the jump back down — each about 600-700º — doesn’t seem like it could be anything but bad data. CHT 3 does rise a little along with each EGT 3 excursion, but all the other CHTs rise, too, responding to the power adjustment.
Since CHT 1 rises a little when these events occur, it did occur to us that the EGT probe could be severed and loosely filling its hole, and occasionally peeling away and sending hot exhaust gas in the direction of cyl 1. But if the EGT probe is getting less hot exhaust blown on it, EGT should drop – not rise 600-700º. Plus on the last event EGT is still high when CHT 1 has already dropped. So that theory belongs at the bottom of the river in cement shoes.
If EGT jumped up and stayed up we’d consider a cracked insulator on one of the #3 plugs, but that wouldn’t fix itself with a power adjustment. One other remote possibility we asked about — was there recently cylinder work done on #3 and is there any chance this is a Helicoil tang heating up ? Negative. So this looks like a probe failing spectacularly, but it’s noteworthy that the probe appears to work perfectly until a certain threshold is reached – then it goes nuts.
Next up is a Cirrus SR22 with a Continental IO-550-TN – the Tornado Alley conversion. Data is from an Avidyne with a 6 sec sample rate. EGTs on top, CHTs below and FF below that.
Veteran Puzzler readers will probably scope this out easily. If you’re newer, give it a try before you read below. Cyl 2 are the gold traces. What’s the issue with cyl 2?
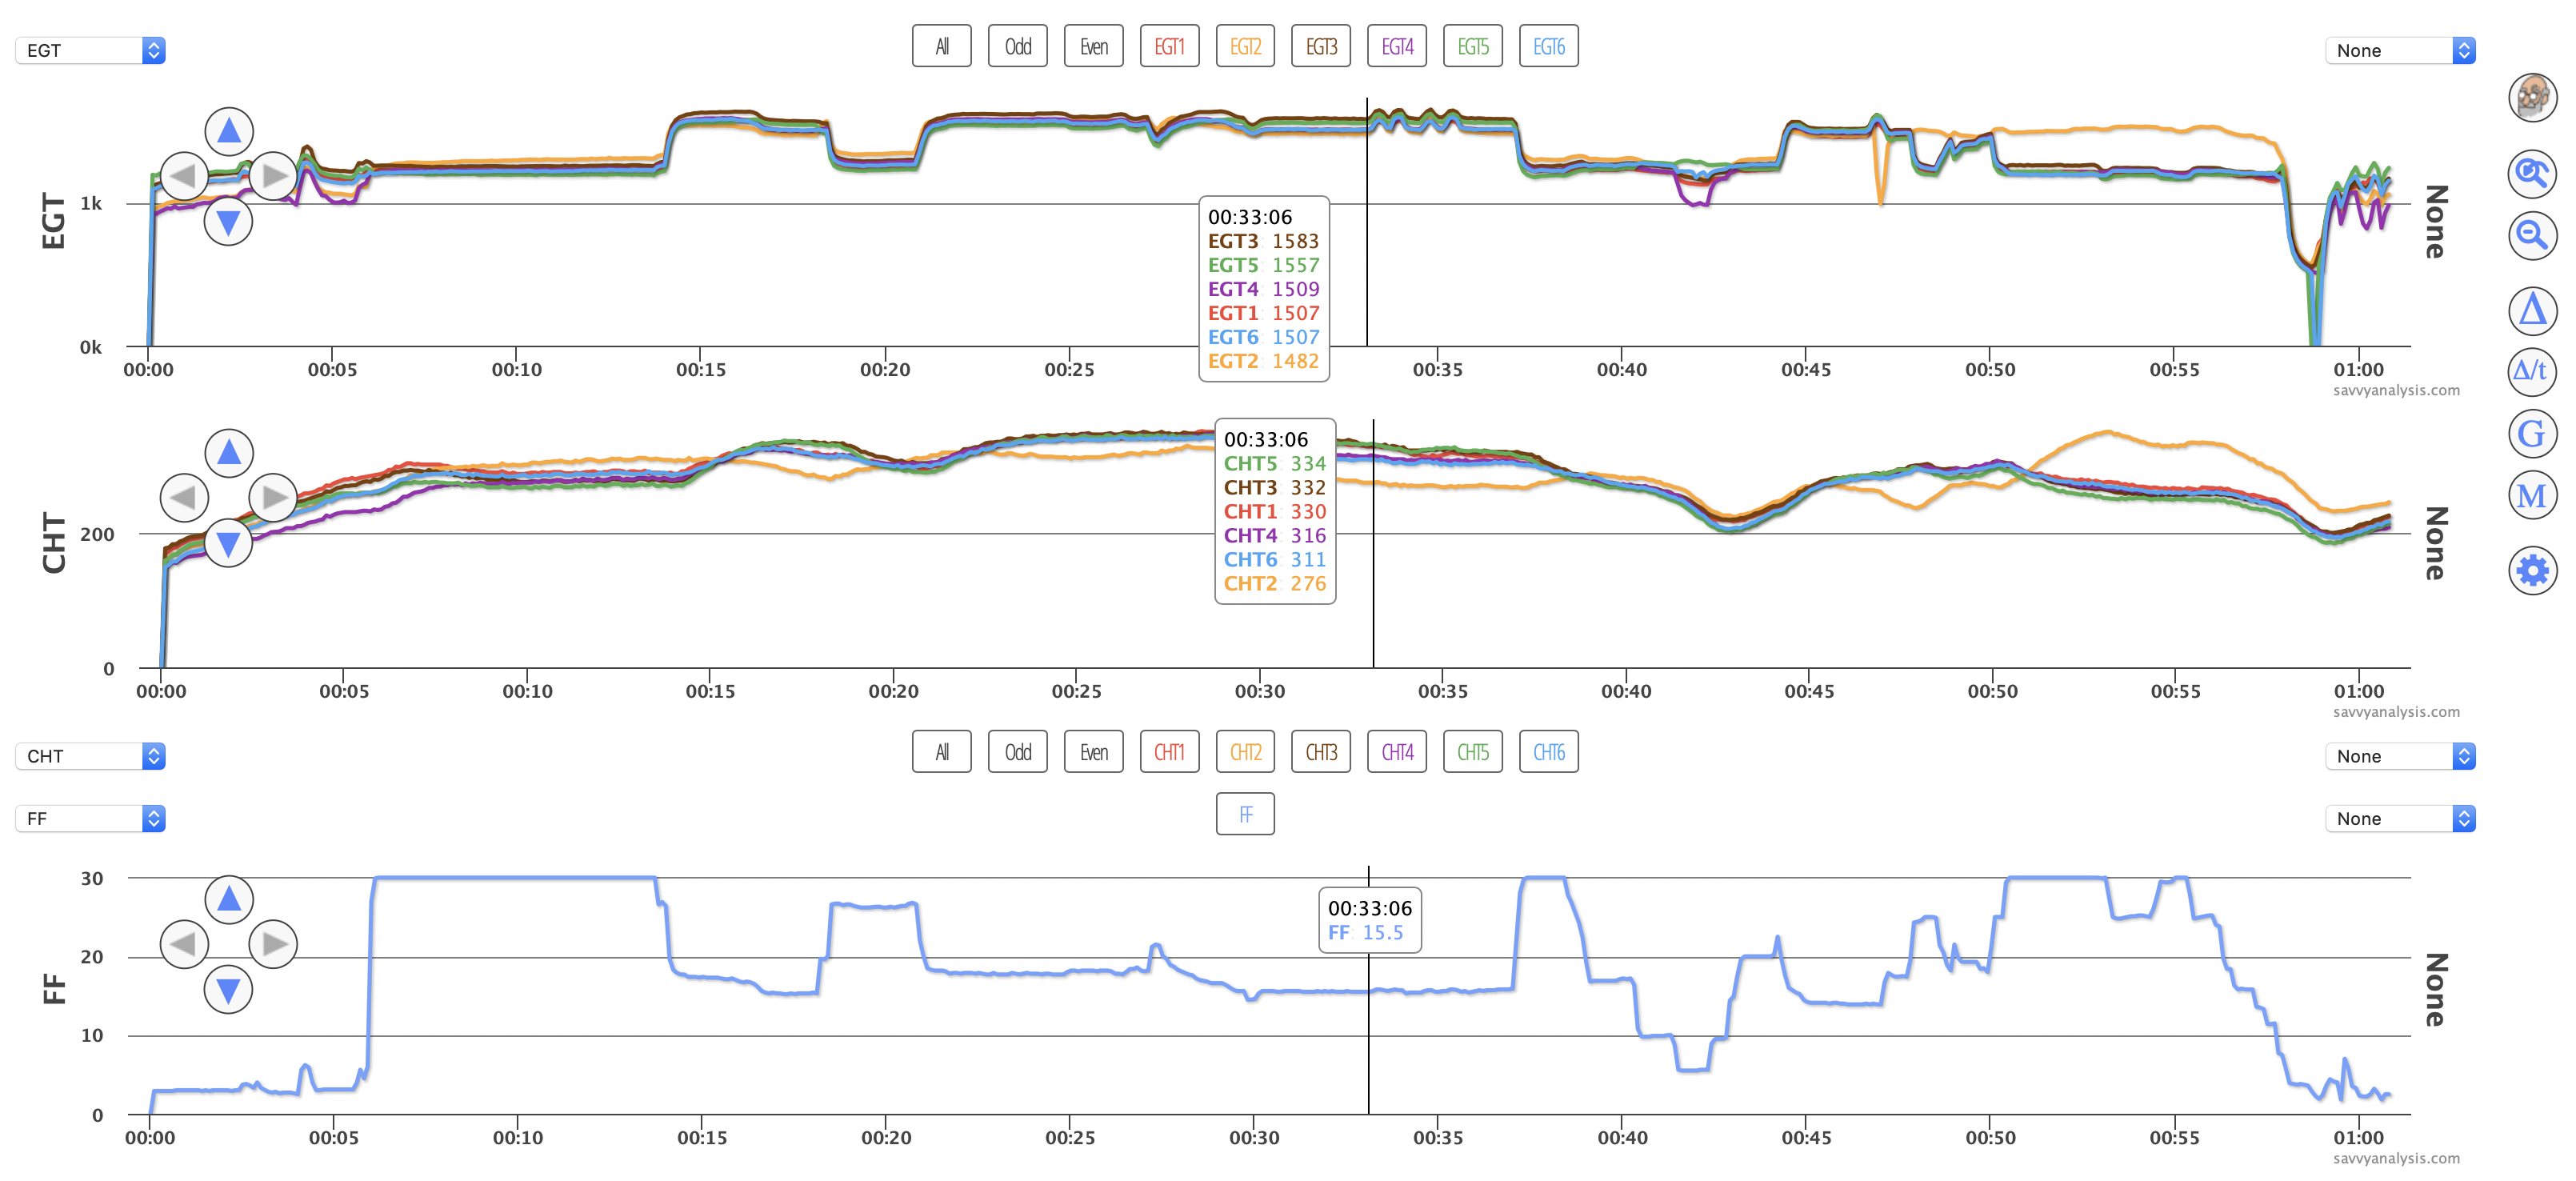
Hint: EGT and CHT 2 move together as FF changes.
Let’s go through it. At max FF EGT and CHT 2 are high. When FF drops at around 18 mins, both EGT and CHT 2 drop. At the 2nd takeoff around 27 mins, both are high again, then both drop, and finally rise again at 50 mins when FF is max again. It’s a textbook injector clog. Cyl 2 runs hot as the clog takes away the extra cooling fuel, then when FF is leaned it struggles to make power on reduced fuel. Typically you’d just get one occurrence of each in the data – I included this one because you get to see it go back and forth.
Next up is a Cessna 182 with a Texas Skyways O-520 F/TS – that’s an IO-520 with 7.5:1 pistons and a carburetor replacing the stock fuel injection. Data is from a JPI 700 with a 2 sec sample rate. EGTs on top, CHTs below and FF below that.
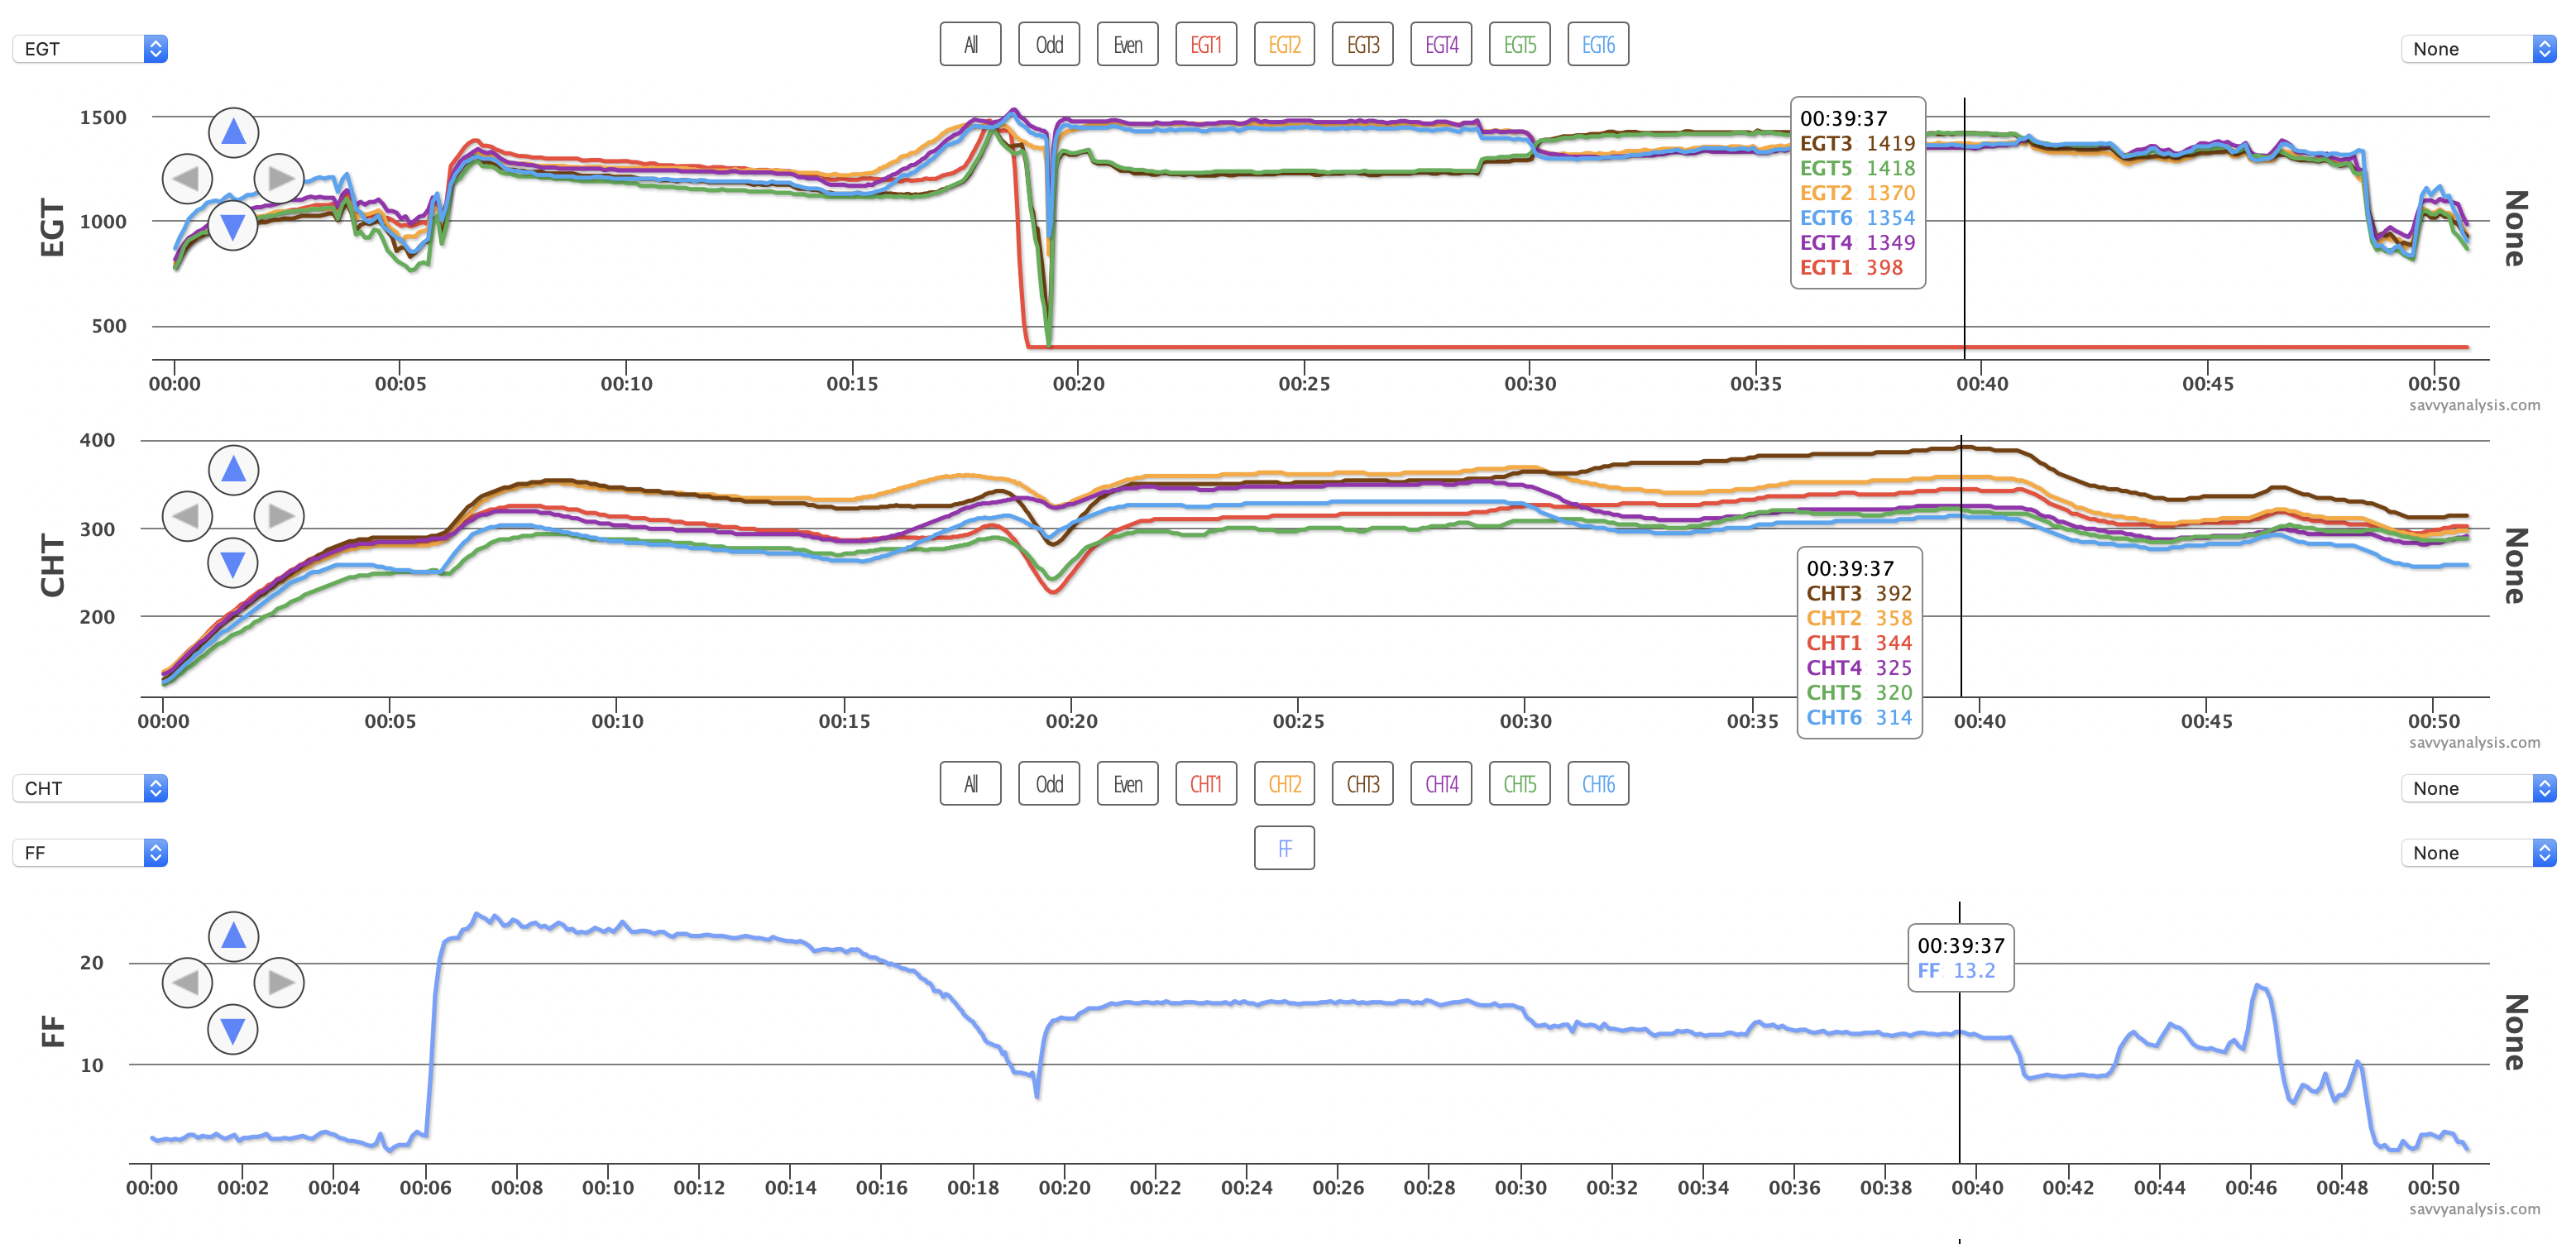
As FF is reduced for a mixture sweep, EGTs 2-4-6 rise first, along with CHTs 2-4-6, then EGTs 1-3-5 rise quickly then drop dramatically. Using the scale on the Y axis of the FF display, FF is around 10 GPH when the trouble starts – which isn’t “idle cut off” territory. Let’s settle one thing now – although EGT 1 drops to 398º and stays there until shutdown, the requester reported normal running after FF was increased. CHT 1 is in the middle of the pack from the event to the end, so despite what EGT 1 indicates, cyl 1 was still making power. But what caused these cylinders to flame out?
Maybe we should display more information. Remember this is a carbureted engine now, so maybe we can look at carb heat? Here’s the same data zoomed in to the event, with carb heat and OAT in Cº replacing CHTs in the second rank.
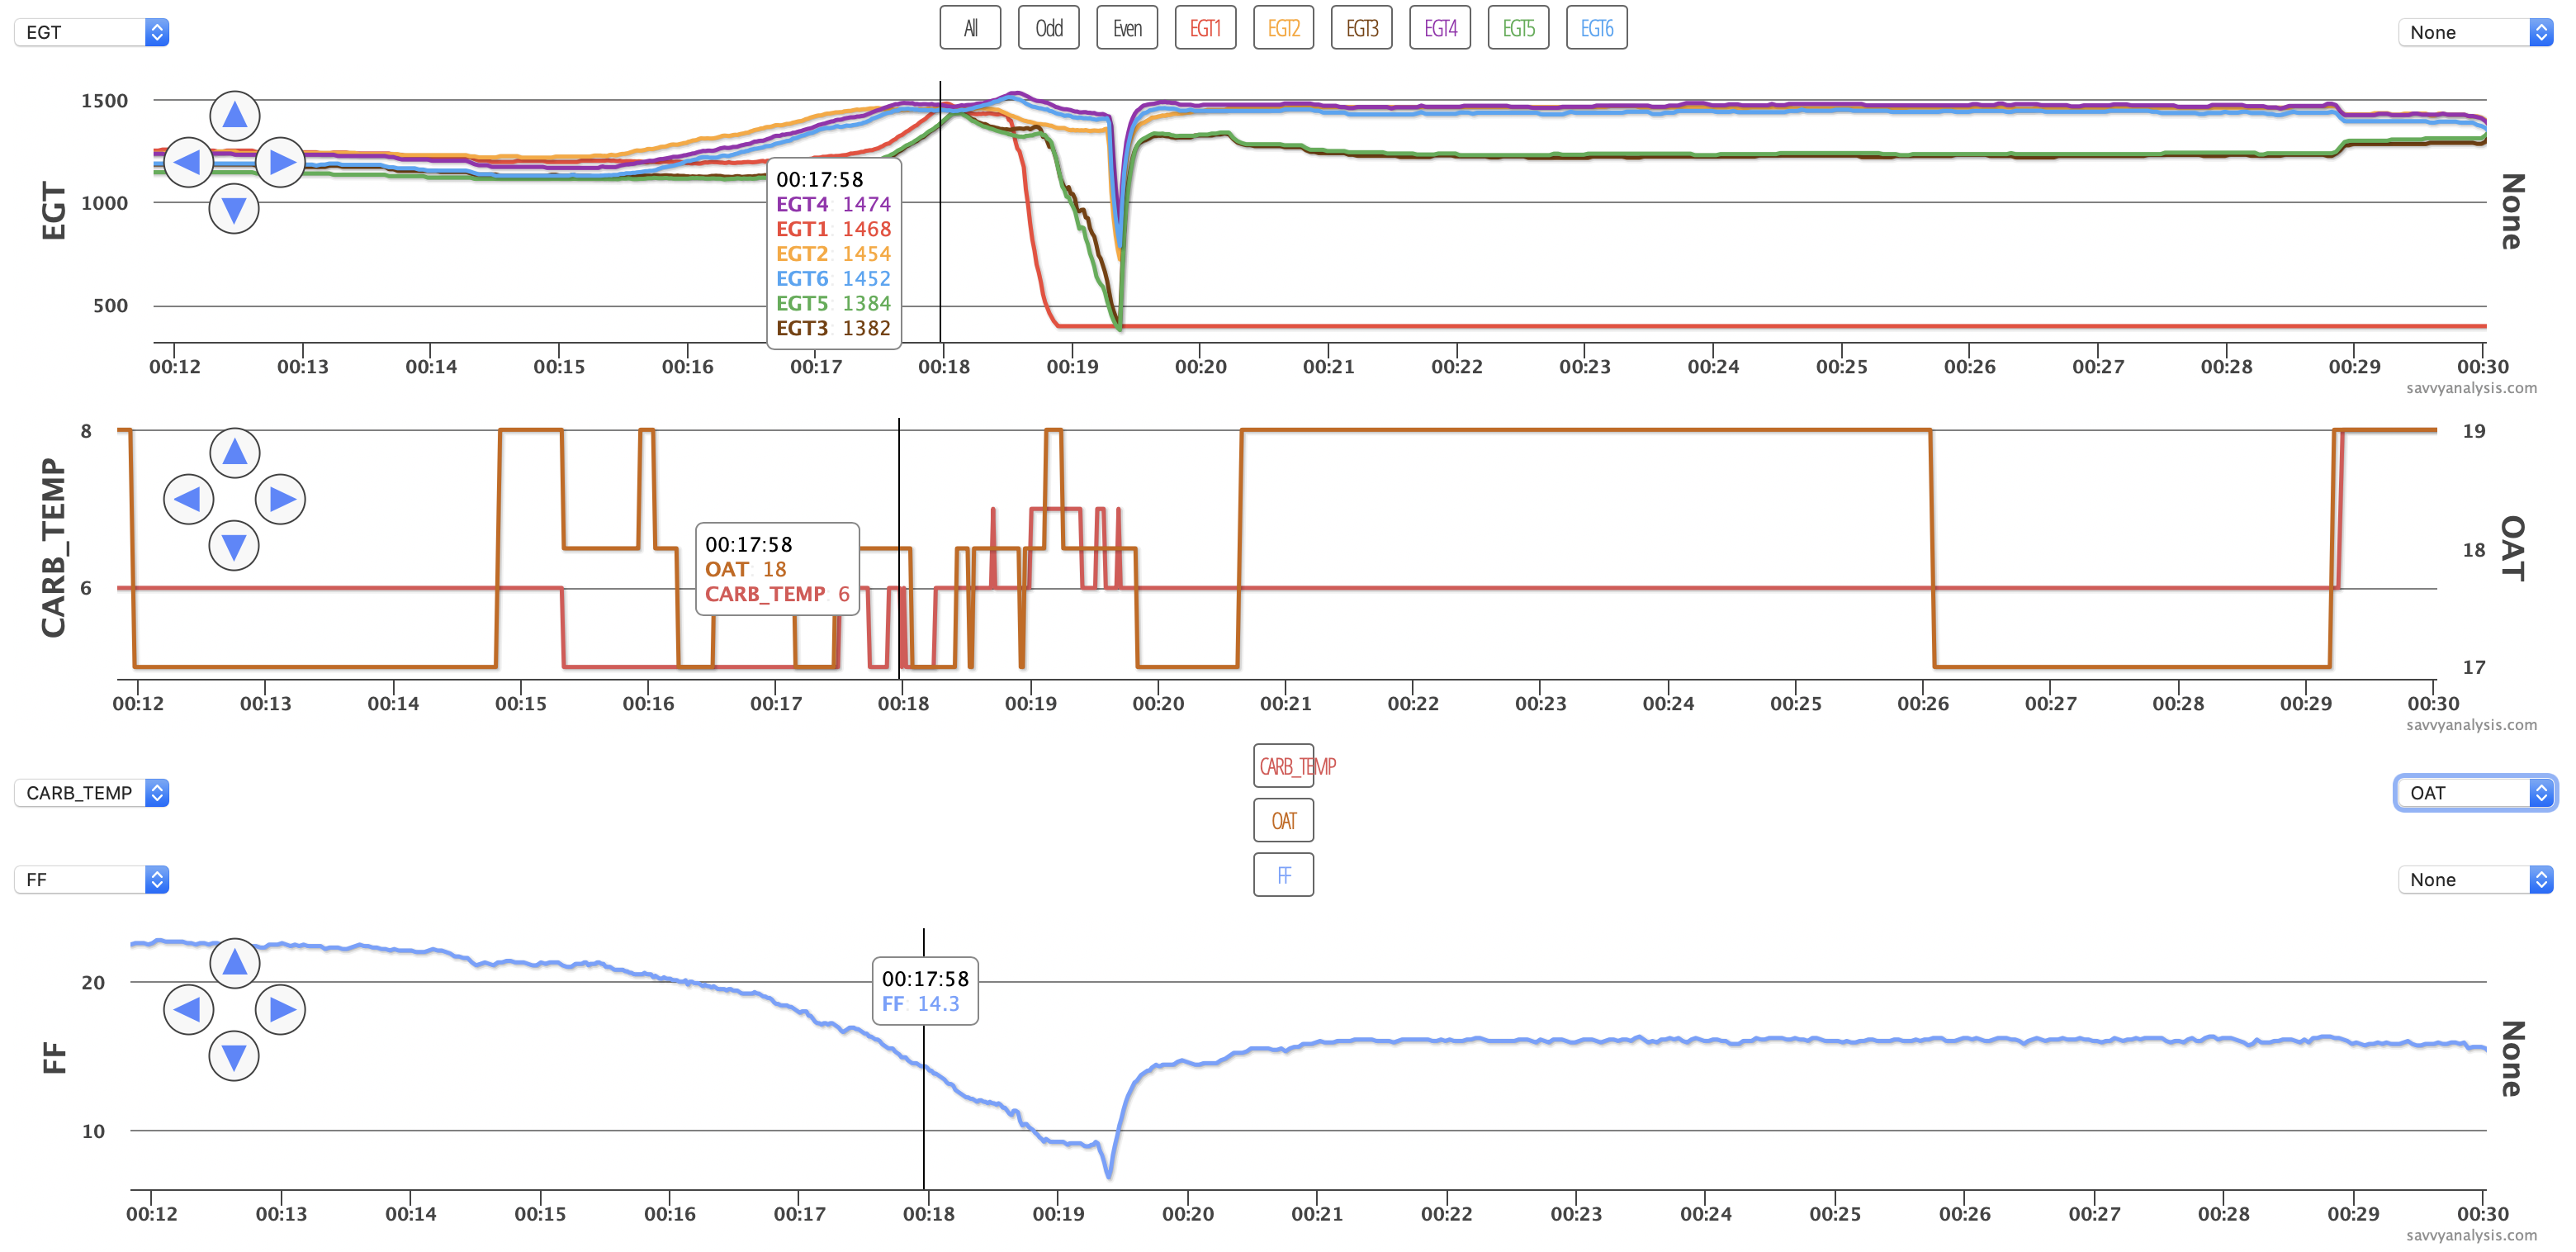
Carb temp of 6º C gave us our best theory – that the decreasing FF allowed the remaining fuel to ice up and cause trouble. And more gas, and the application of carb heat, fixed it.
