The Estonian physicist Thomas Johann Seebeck died a couple of generations before the Wright Brothers demonstrated powered flight. Each December I remember to thank the brothers from Dayton for their courage and persistence that eventually led to the gift of aviation to mankind, and from now on I’ll be including Herr Seebeck. Because it’s his work with thermocouples that eventually led to SavvyAnalysis. Seebeck studied medicine, but preferred physics, and his work led to the modern thermocouple.
Had Seebeck preferred medicine, perhaps someone else would have discovered the connection between heat and electricity, but you can say that about any endeavor. Medicine’s loss is our gain and now we have a (mostly) reliable way to measure important engine parameters. On the ground the information helps us satisfy FAR 91.103 requiring us to gather all available information about our upcoming flight. In the air it can help distinguish a life-threatening in-flight emergency from the nuisance of a bad connection or a failed sensor.
First up this month is data from a Cessna Cardinal with a Lycoming O-360 and data from a JPI 830 with a 6 sec sample rate. Four ranks this time – since altitude isn’t logged I included OAT as a proxy for altitude.
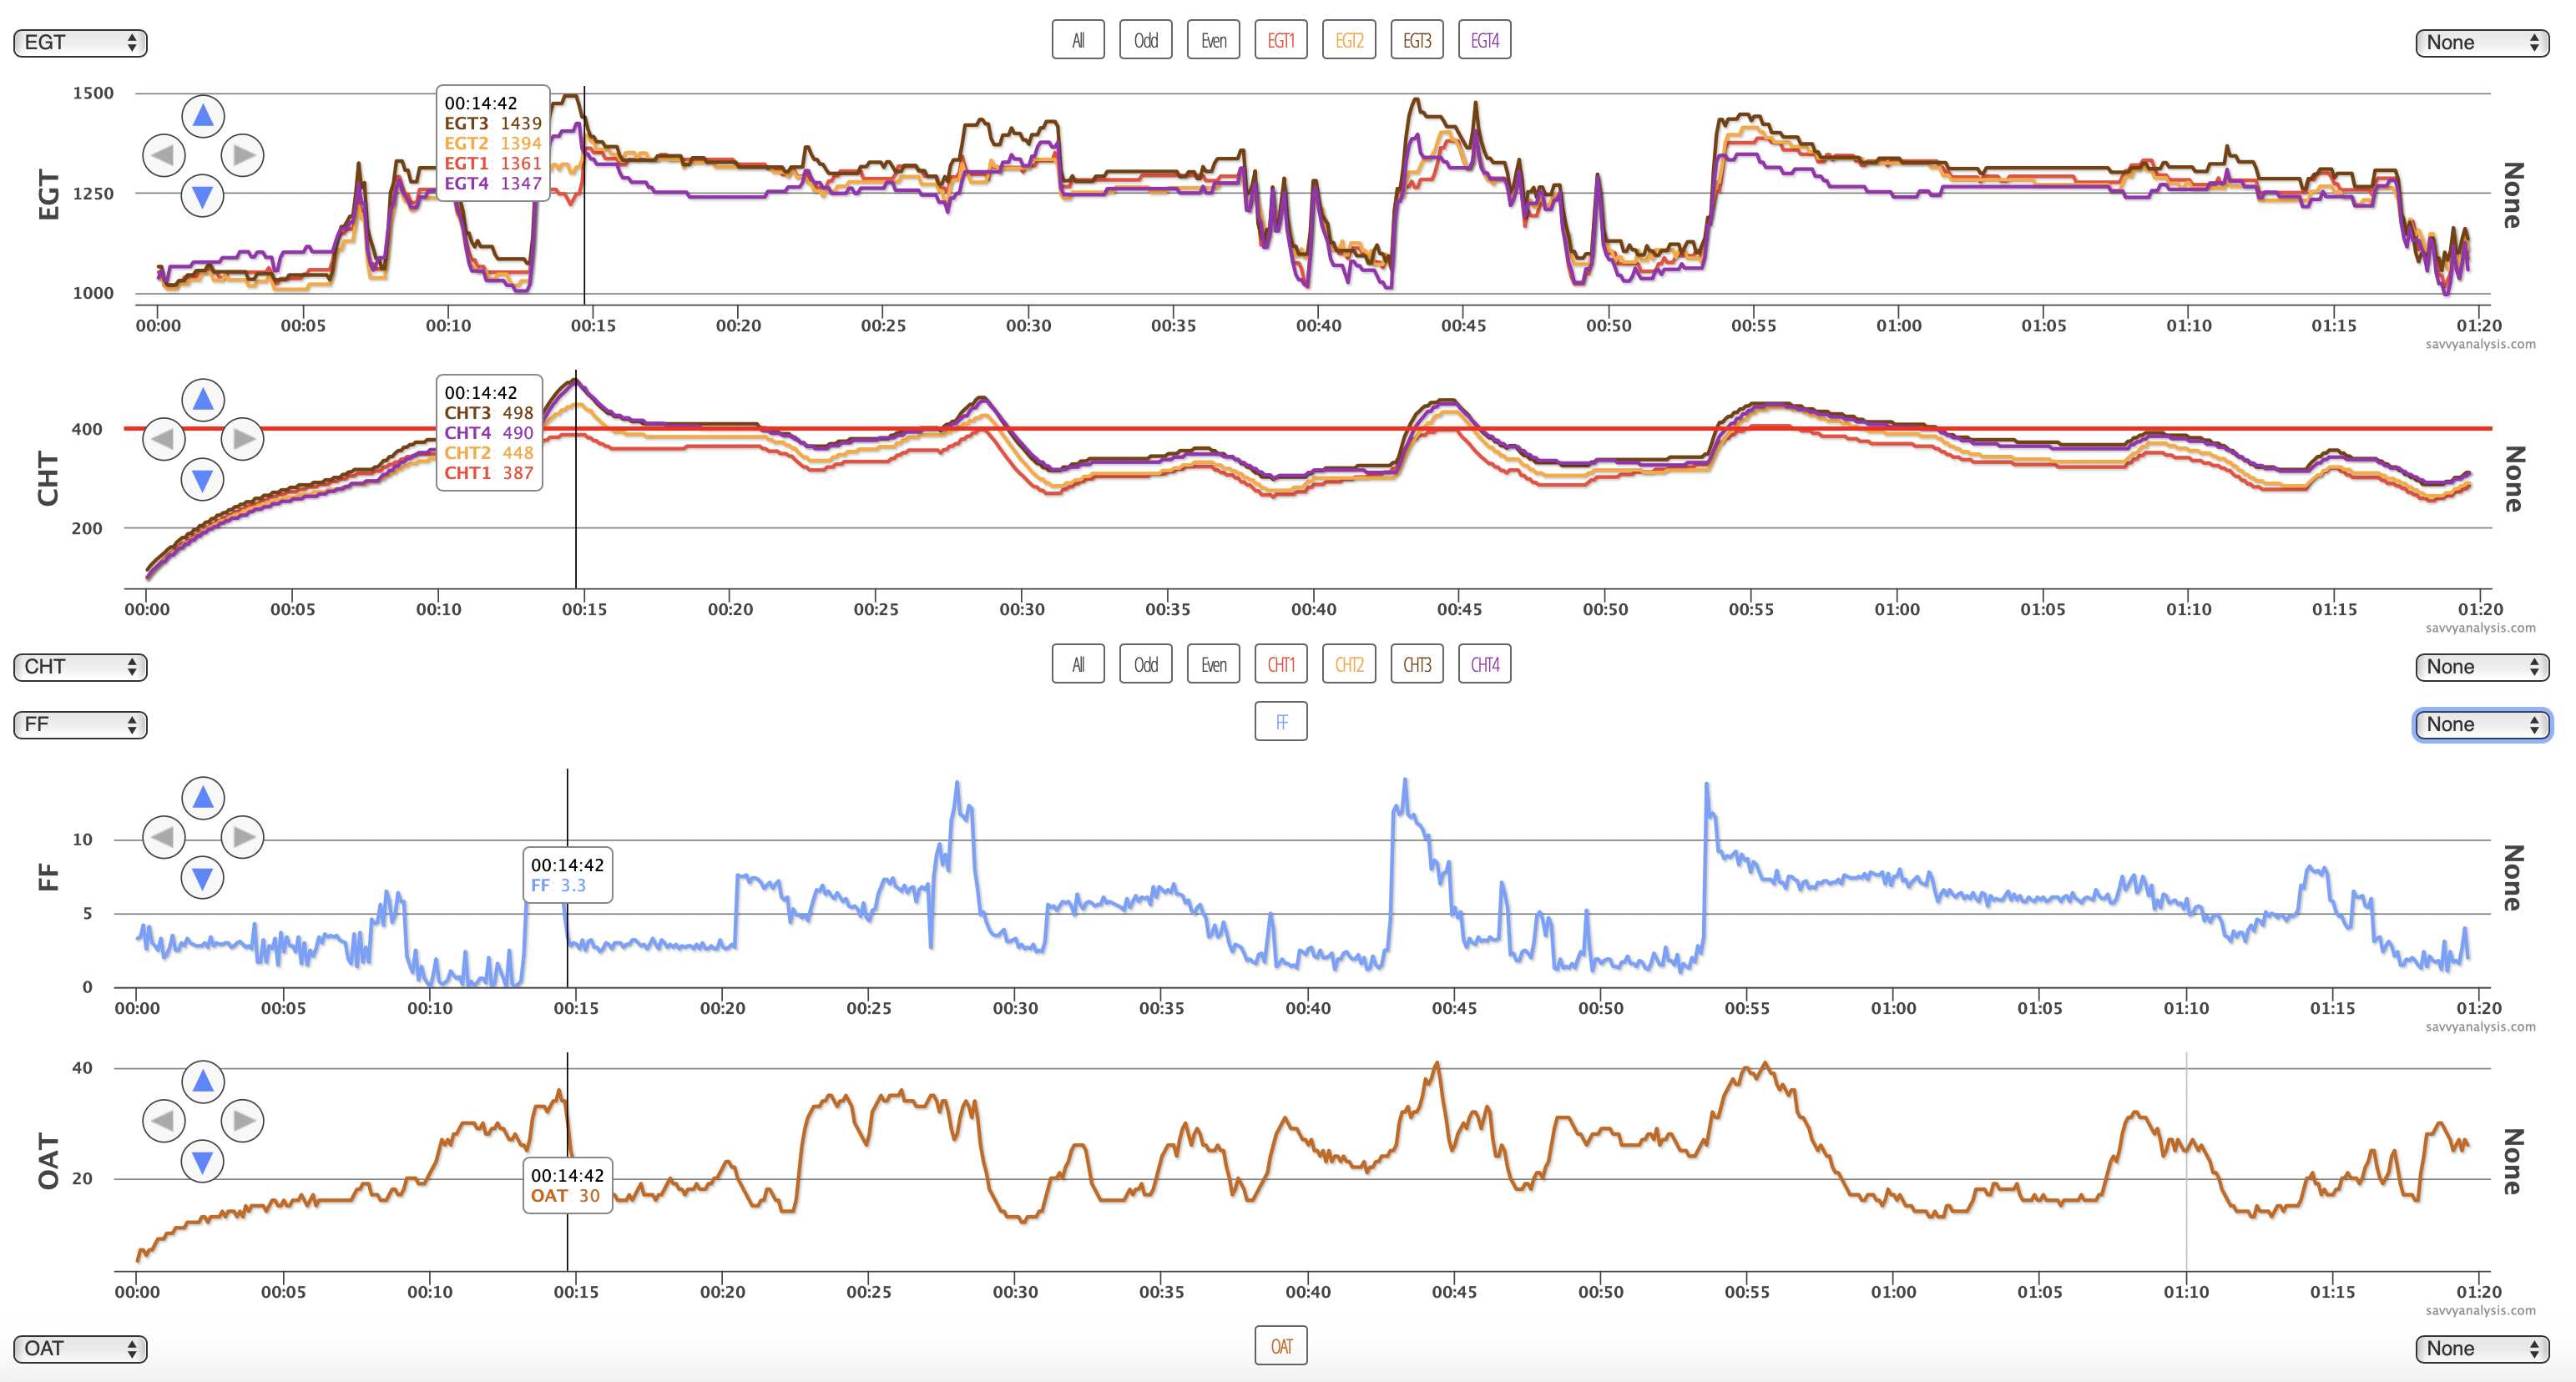
The HI CHT alert is set for 400º and you can see it’s not helping much, since it alerts pretty much every flight. It’s probably time to include a sidebar on CHT alerts in our software. The most useful setting for an alert is just above the typical highest CHT for your engine. If that’s 380, great – set the alert for 390º. If that’s 400, not as great, but set the alert for 405º or 410º – so you know if something atypical happened. Conversely, setting the HI CHT alert for 460 or 500 is only going to catch flights with catastrophic-type temperatures – perhaps the result of detonation or pre-ignition. Sure it’s important to flag those, but equally important to flag less-extreme excursions from normal temps for that engine, which might prevent the catastrophic event in the first place. You can modify the HI CHT alert by choosing ACCOUNT > My Aircraft > then choose EDIT from the three-blue-stripes button in the ACTIONS column.
OK, back to the Cardinal. There are four power-ups in this data – roughly 15, 23, 43 and 53 mins in the timeline. The last three have a short peak where FF hits the mid-teens. The first one doesn’t show that peak. Because the sample rate is 6 secs we’ll give the benefit of the doubt and say it probably happened between samples. Another quick sidebar on sample rates. 2 secs is our preference – it seems like a good compromise between data with useful granularity and filling up the card quickly. If you can manage the extra data you’ll generate with a 1 sec rate, that’s ideal. It helps with momentary events like engine stutters.
The second power-up doesn’t line up with the rise in OAT, which happens a couple of minutes earlier. Again, it would be nice to have an altitude trace, but using OAT it looks like the flight began at about 5º then never gets cooler than about 13º in flight, and shows about 25º at landing. So either it landed somewhere else, or it got very hot very fast. 20º C in 80 mins.
So these may have been power-on stalls or glide practice or some other flight maneuver. And again we’ll give the benefit of the doubt. When I made the note on this data I tagged it “starving for fuel”. It still seems that way to me.
Next up is data from a Piper Arrow III with a Lycoming IO-360 and data from a JPI 730 with a 6 sec sample rate. Four ranks again, with oil temp on the bottom.

Nothing noteworthy for EGTs, CHTs – which are uniform and stable – or FF. It’s oil temp that gets your attention. The JPI dutifully tracks each move as it bounces around up there in the 900-1400º range, and our software dutifully displays it. I suspect the analog gauge in the panel spent most of its time pegged at its high number – probably in the 500º range.
That first excursion in initial climb to the 500-600º range looks tame in comparison to what comes later. FF indicates the pilot landed before the 1 hr mark, just after the cursor mark. Maybe he was flustered by what he had been seeing, maybe once he saw that the temp steadied as he taxied he felt it was safe to continue. He takes off again and gets another dose of implausible readings. The pilot had the benefit of monitoring oil pressure which I didn’t depict here because it’s as unremarkable as EGT, CHT and FF. It always makes sense to check the connection first and in this case it acts more like a connection issue than a failed probe.
Here’s a question for the comments area below. Would you rather have a sensor or connection fail to high, or fail to low? I have my opinion- I’d like to hear yours.
Here’s data from a Cessna P210 with a Continental TSIO-520 and data from an AuRACLE CRM2100 with a 2 sec sample rate. Back to my standard layout of EGT, CHT and FF.
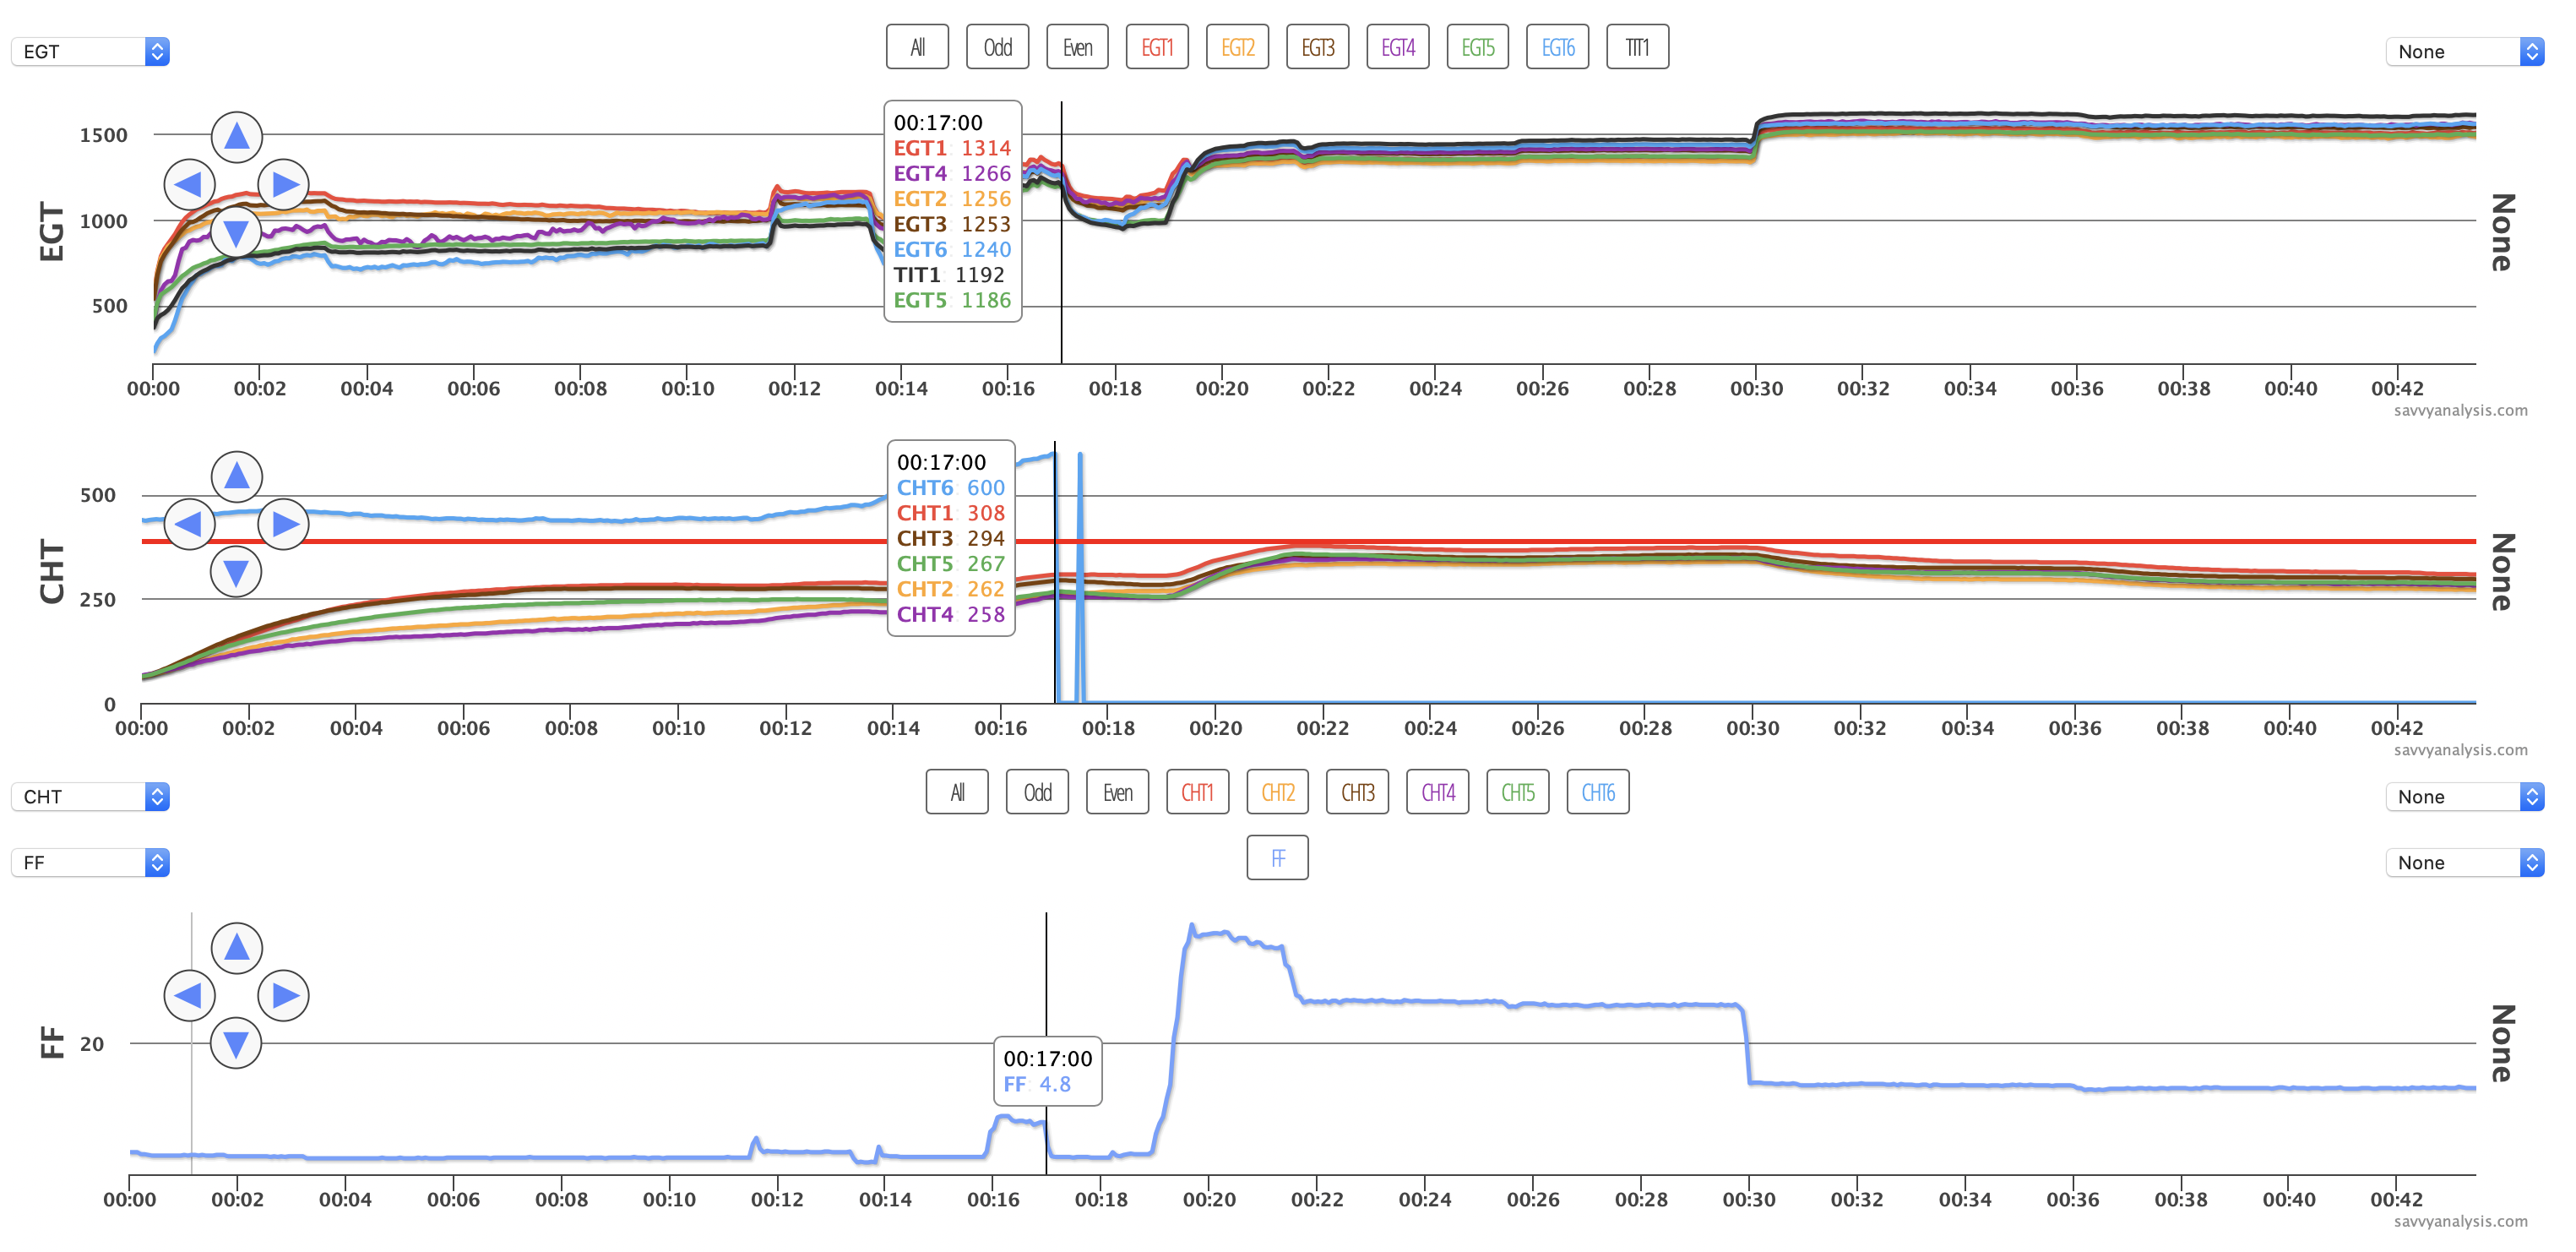
The cursor is parked on the runup with FF at 8.6 GPH, which is where the CHT 6 probe checks out after posting an even 600º. The higher rez version is zoomed into the runup, but I wanted you to see that it’s a 5 hr 30 min flight. CHT 6’s first reading at engine start is 440º, compared to about 65º for the others. So it’s already bonkers before he releases the brakes.
We could again give the benefit of the doubt that the pilot knew this was a failing probe so he wasn’t bothered by it. Is that better or is that worse – to take off with equipment you know is unreliable? In any case, after singing a brief swan song, CHT 6 drops to zero and stays there, and this flight goes off without a hitch.
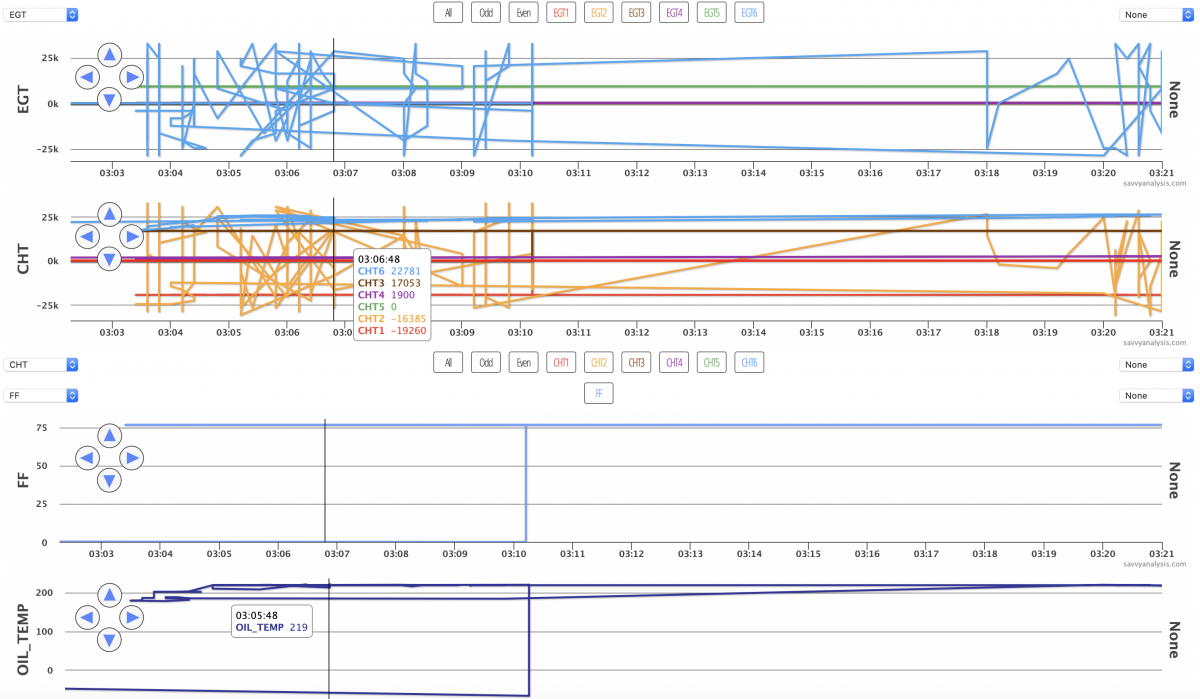
Let’s wrap up this decade with some seriously flawed data. It’s from a Cirrus SR22 with an Avidyne and a 6 sec sample rate, as if it matters. This has no diagnostic value and is presented – as the reality TV people say – for entertainment purposes only. Except this came from an airplane.
I suspect Herr Seebeck encountered strange data in his experiments. Fortunately he stuck with it and we have (mostly) reliable data.
See you in January with more examples of interesting engine data. Happy Holidays.
