The US stock market volatility index is sometimes called the fear index. Usually when the VIX is spiking to new highs, investors are bailing out and other indexes are tumbling. We had one of these events last last year – after a jittery October and November, December saw a “blow-off” top, and when the last seller sold, buying resumed and the VIX settled down again. The VIX was created in 1993 by the Chicago Board Options Exchange, which is roughly when digital engine monitors with the ability to store flight data started replacing legacy needle gauges – or monitors without the ability to store data – in our panels.
When I look at a stock chart I find it helpful to overlay the VIX, so I get a sense of what the broader market sentiment was as the stock price moved. When I look at engine data, I like to overlay fuel flow, oil temperature and sometimes altitude, to help put the data in context of the flight. There are lots of parameters in stock charts that don’t correlate to engine data – volume, for instance – but a big spike followed by a big drop gets your attention on either one. So let’s start there.
First up is data from a Diamond DA40 with a Continental IO-360 engine and data from a Garmin G 1000 using a 1 sec sample rate. EGTs on top, then CHTs, FF and oil temp. This Diamond has one standard Bendix mag and one ElectroAir e-mag.
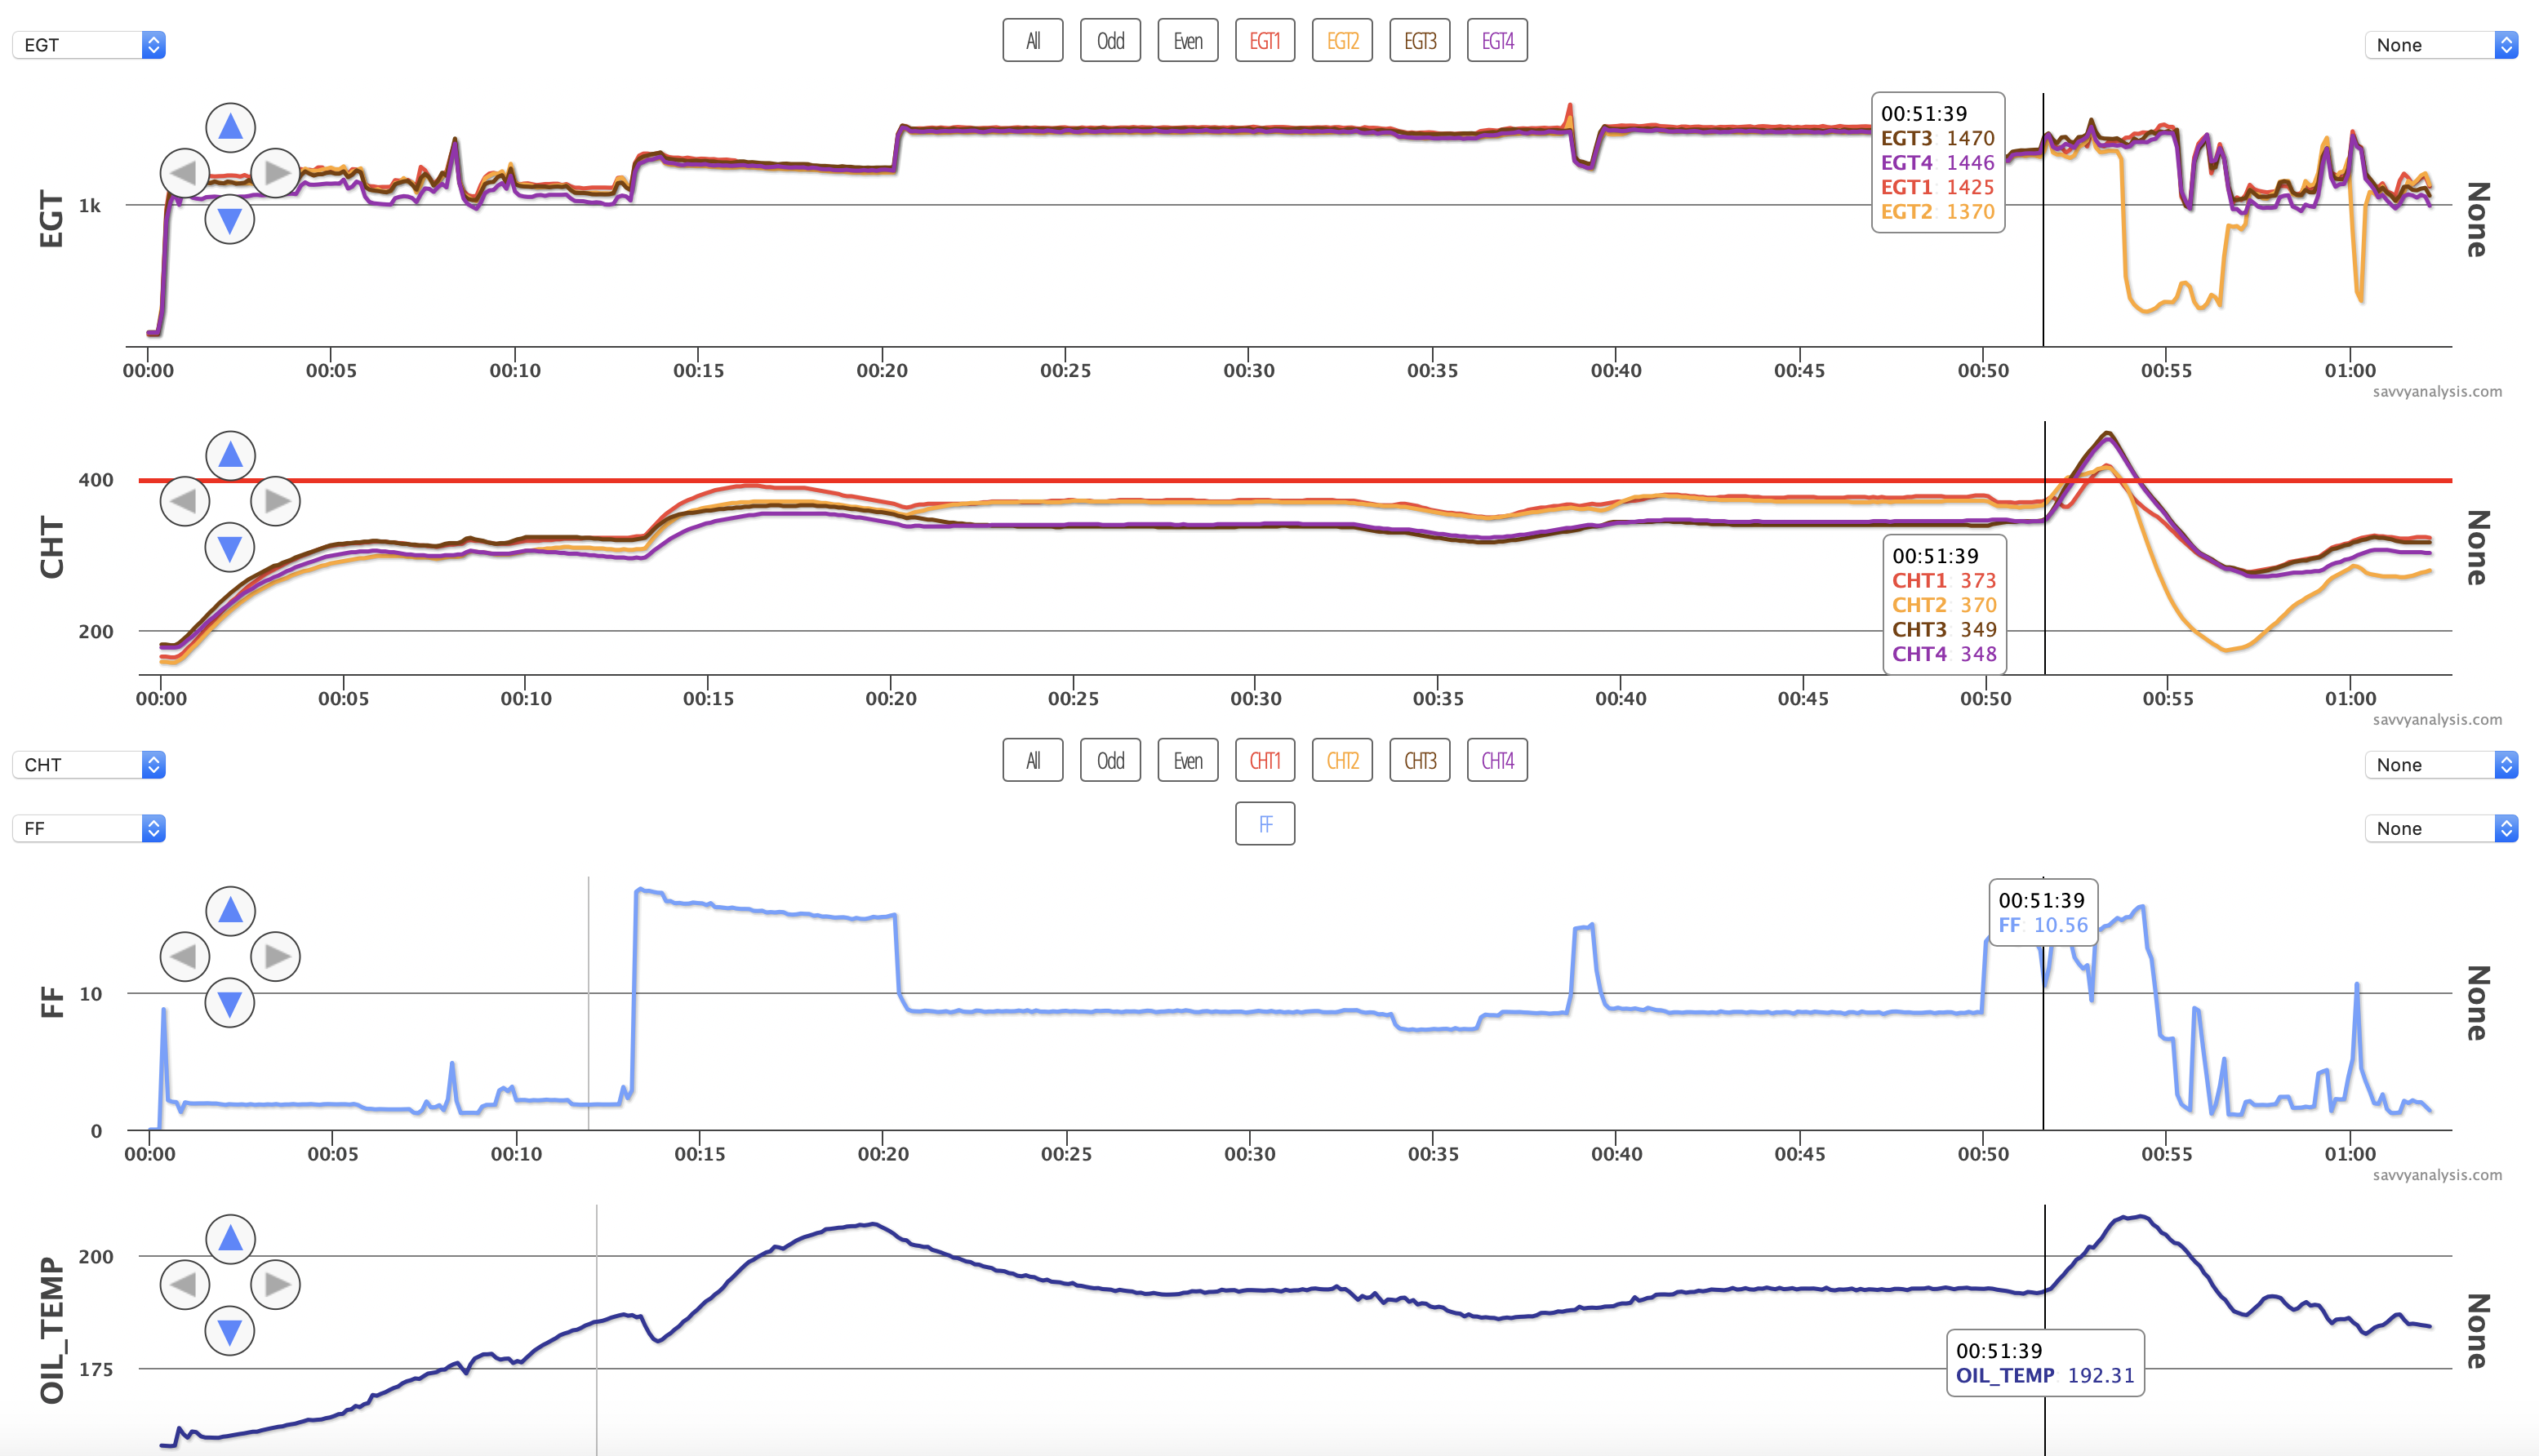
All looks ok during ground ops. In climb, CHT 1 gets hotter than the others, but EGT 1 is right in the pack, so it looks more like a cooling issue than running lean. In cruise, 2 rises up a bit to meet 1 and they stay hotter than 3 and 4 – but EGTs are very stable and uniform so this still looks like a cooling issue. So why was 1 high in climb by itself, then 2 got hotter after the climb? Our theory when we see this pattern is that a cooling baffle around cyl 1 is loose, and the extra incoming air during climb – compared to ground ops – moves that baffle enough to matter. When climb is complete and the airplane noses over for cruise, there’s more incoming air, and that causes the baffle round cyl 2 to move enough to matter.
You also have to consider that the cooling patterns are different in climb and in cruise. More volume of air can mean currents and swirls that didn’t happen with less air. Even though 1-2 are higher than 3-4, they’re in a good range – but we like to see uniform cooling if that can be achieved. Then we get to 51:39 where the cursor is. Descent out of 4500 MSL began at about the 50 min mark, with the pilot reporting engine roughness. He tried changing MAP, RPMs and FF and the roughness continued.
Here’s the same data zoomed in to show peak CHTs and with MAP overlaid in the FF rank.
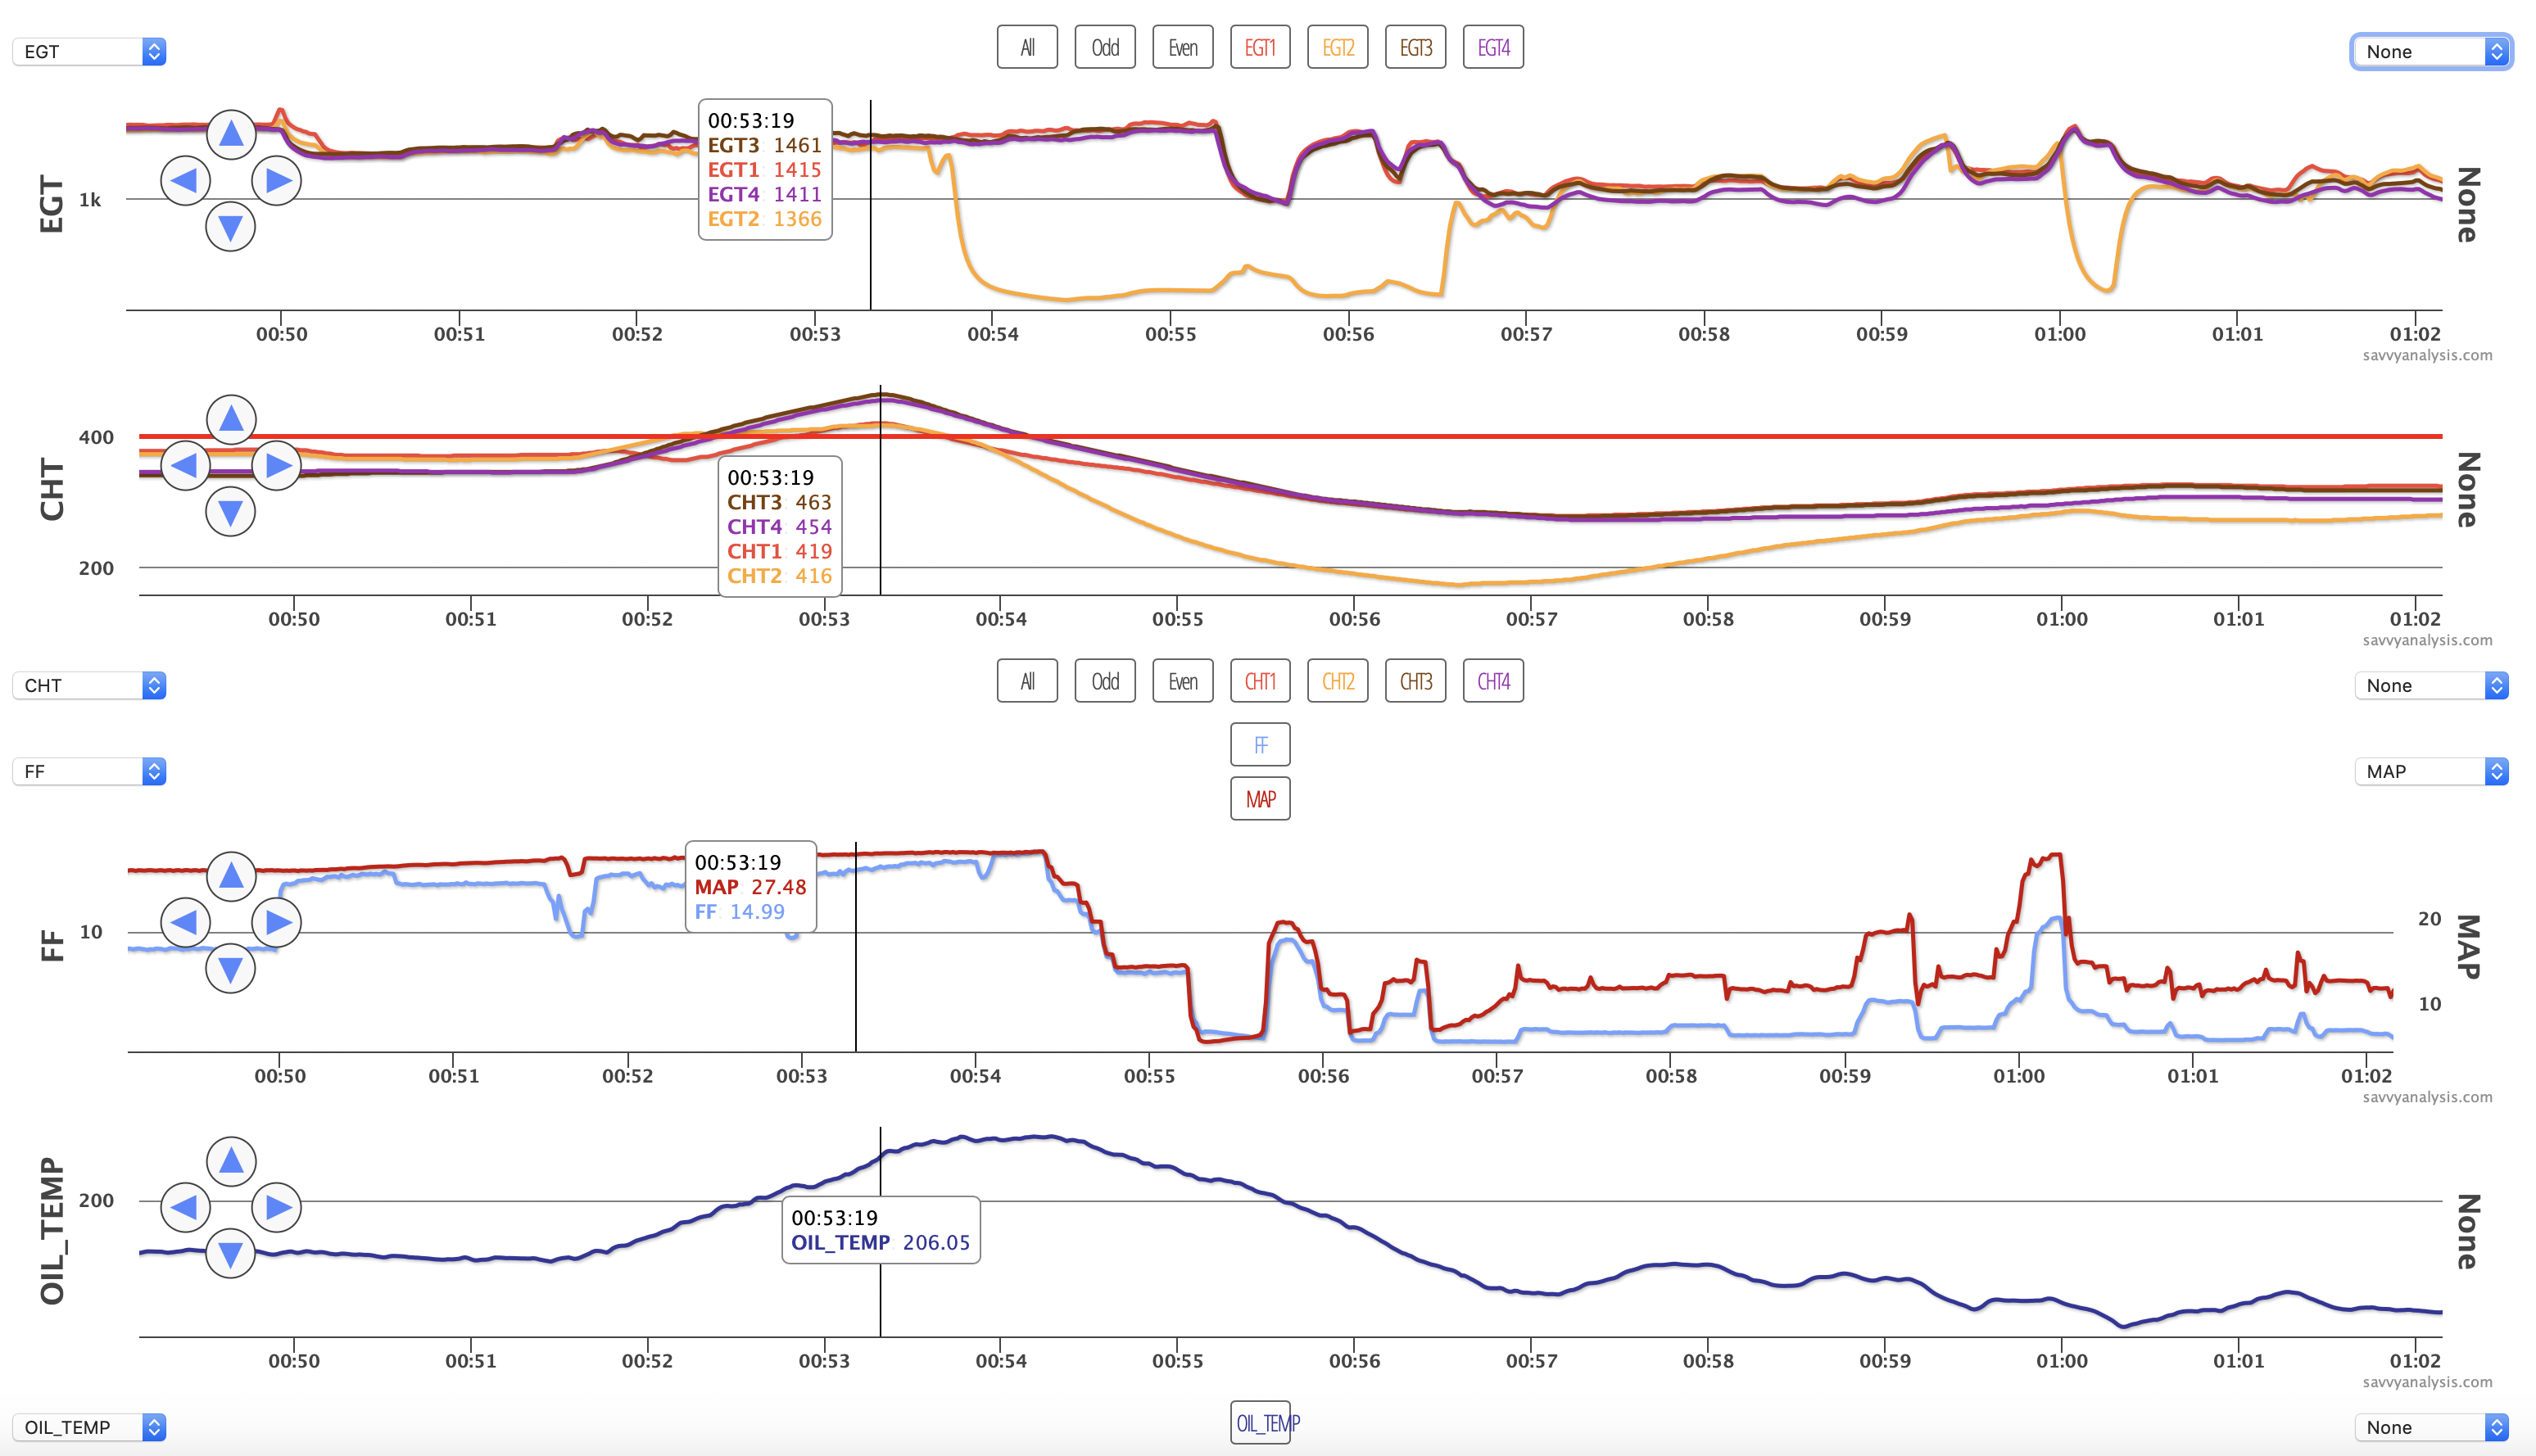
So in the descent MAP is climbing – it’s around 27.5″ where the cursor is – FF is changing between 10 and 15 GPH while CHTs and oil temp continue to rise.
At some point he switched from both mags – one standard and one e-mag – to the e-mag. Engine data doesn’t track that – yet – so we can’t tell to the second where that happens, but odds are it’s around 51:39 which is where CHTs start their climb. CHT 3 gets a lot hotter than CHT 2, but it’s the pattern for EGT and CHT 2 that’s of concern. The big drops indicate a detonation event. This is a case where you’d want to borescope cyl2 based on the data, and probably borescope the others just in case.
Next we’ll look at a series of flights from a Cirrus SR22 with a Continental IO-550 engine and data from an Avidyne with a 6 sec sample rate.
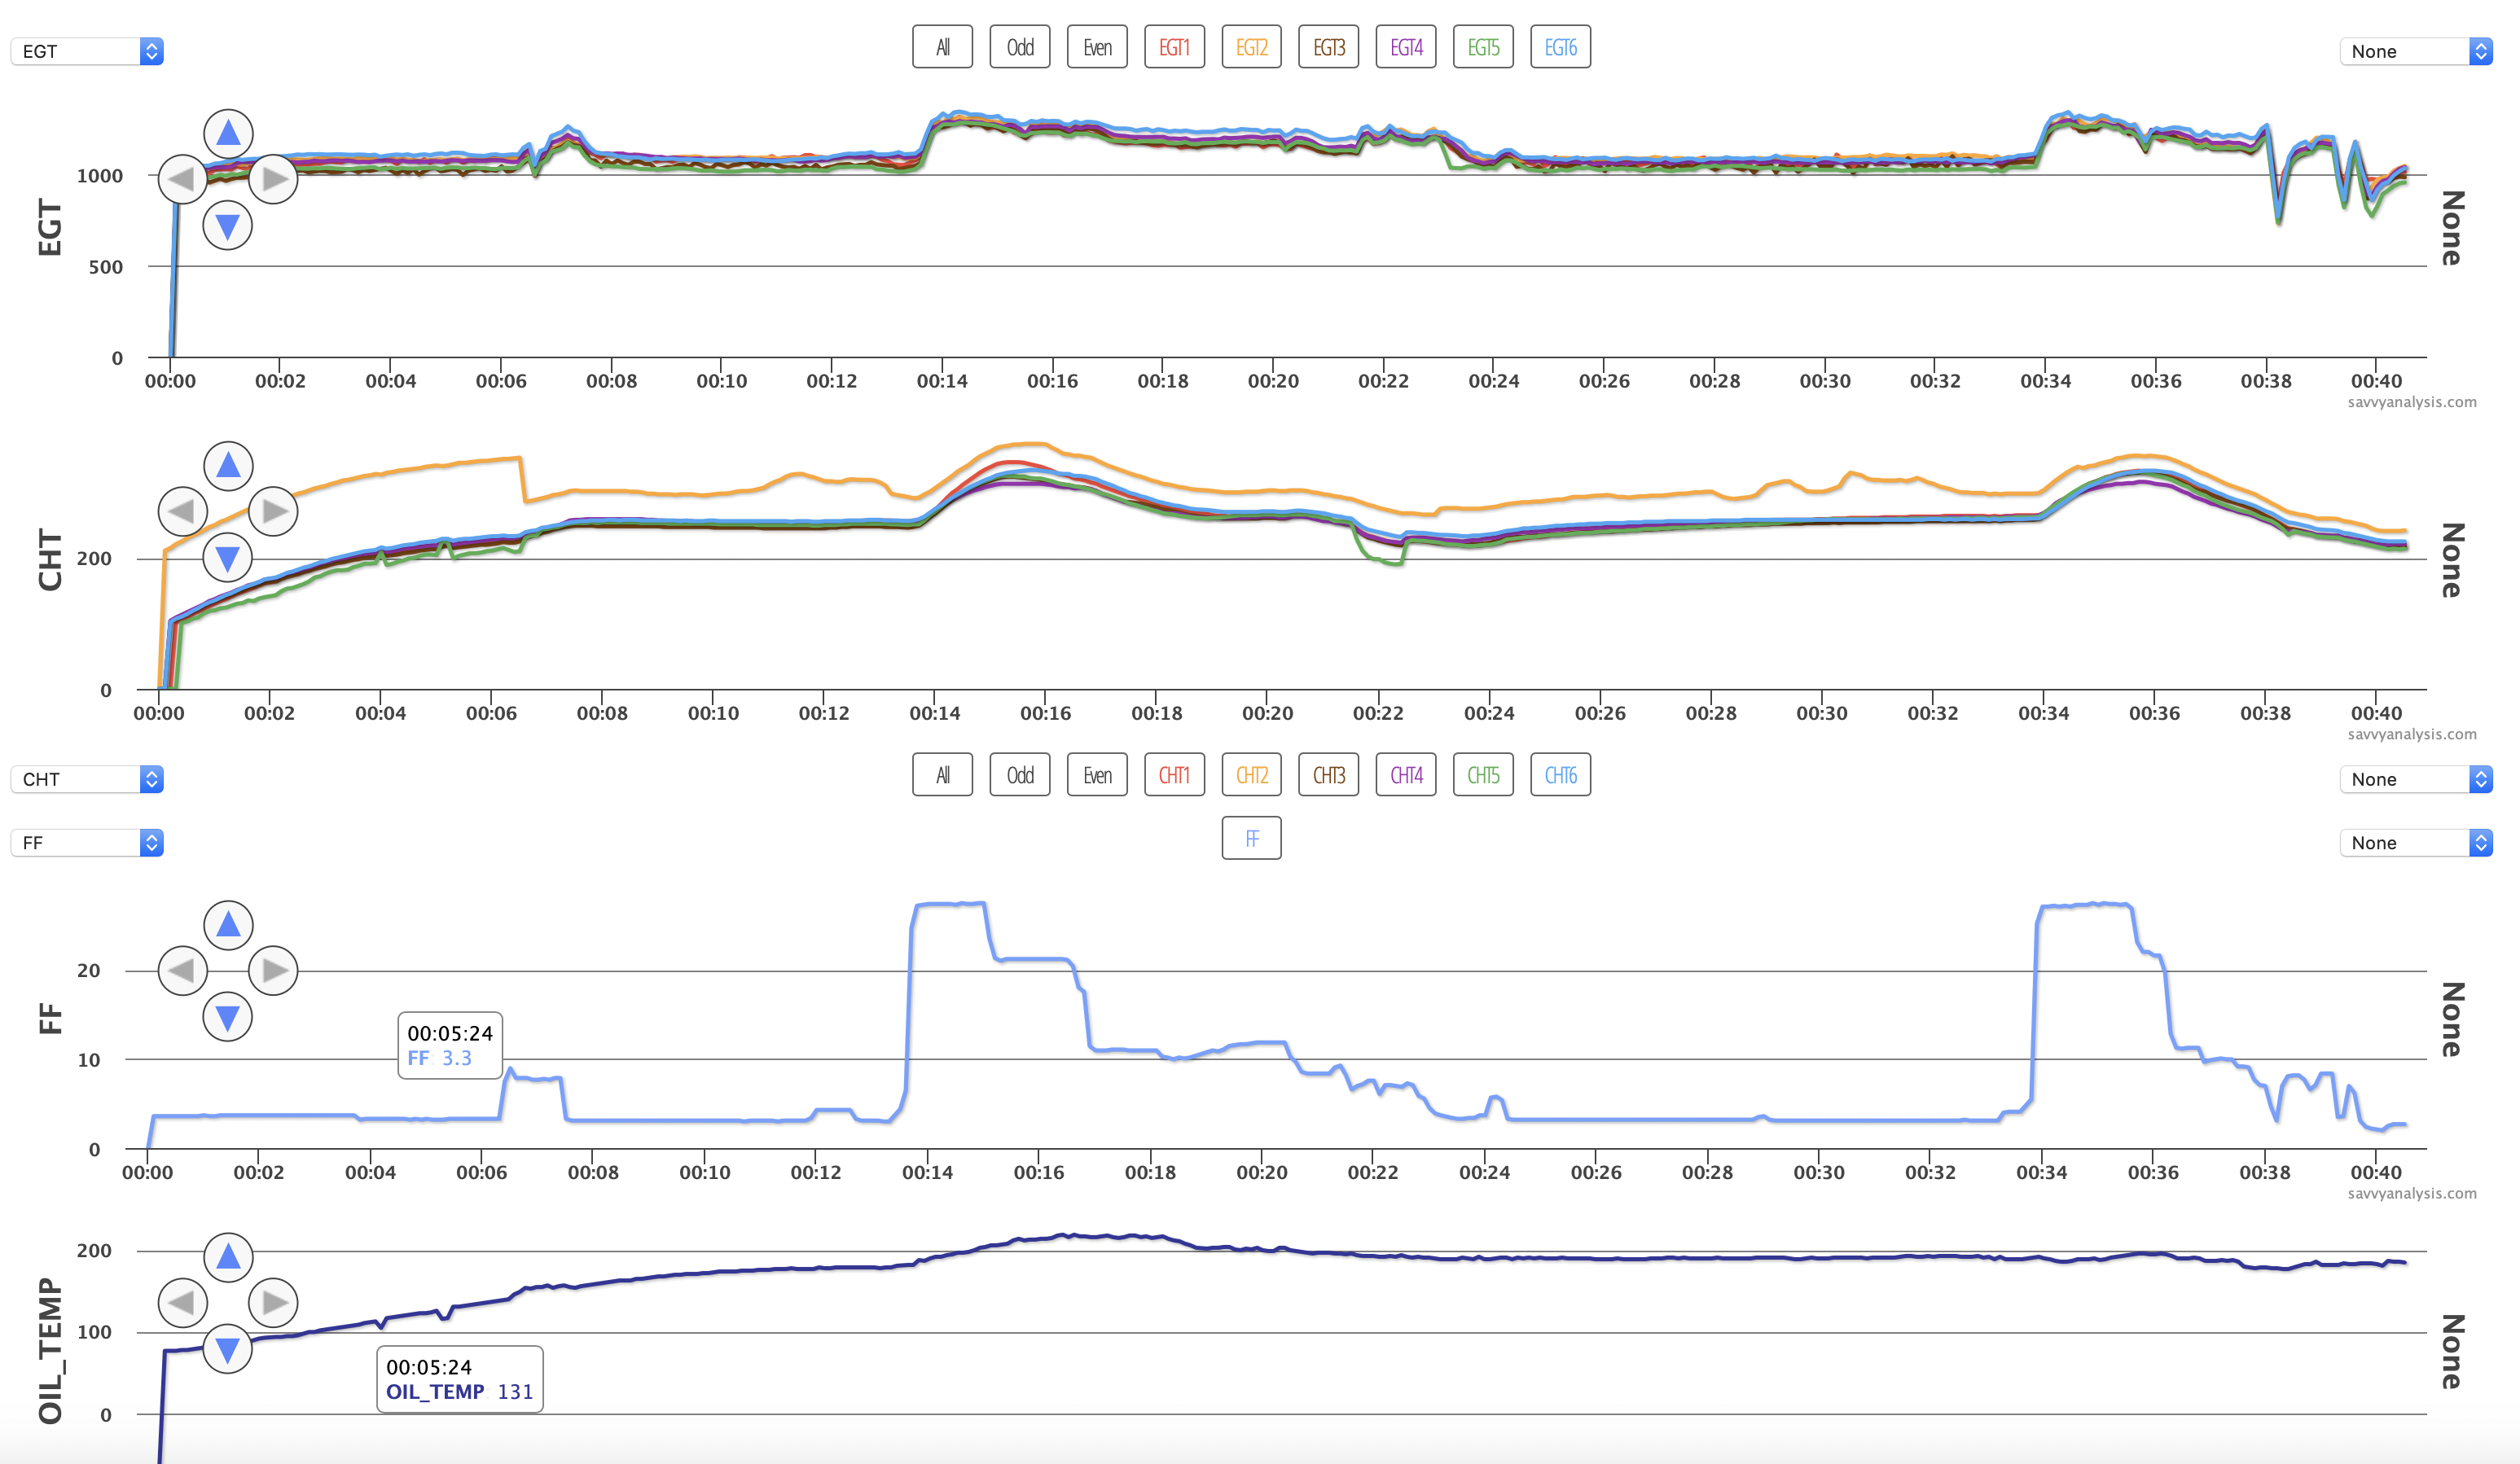
Here’s the first one – same layout as before with EGTs, CHTs, FF and oil temp.
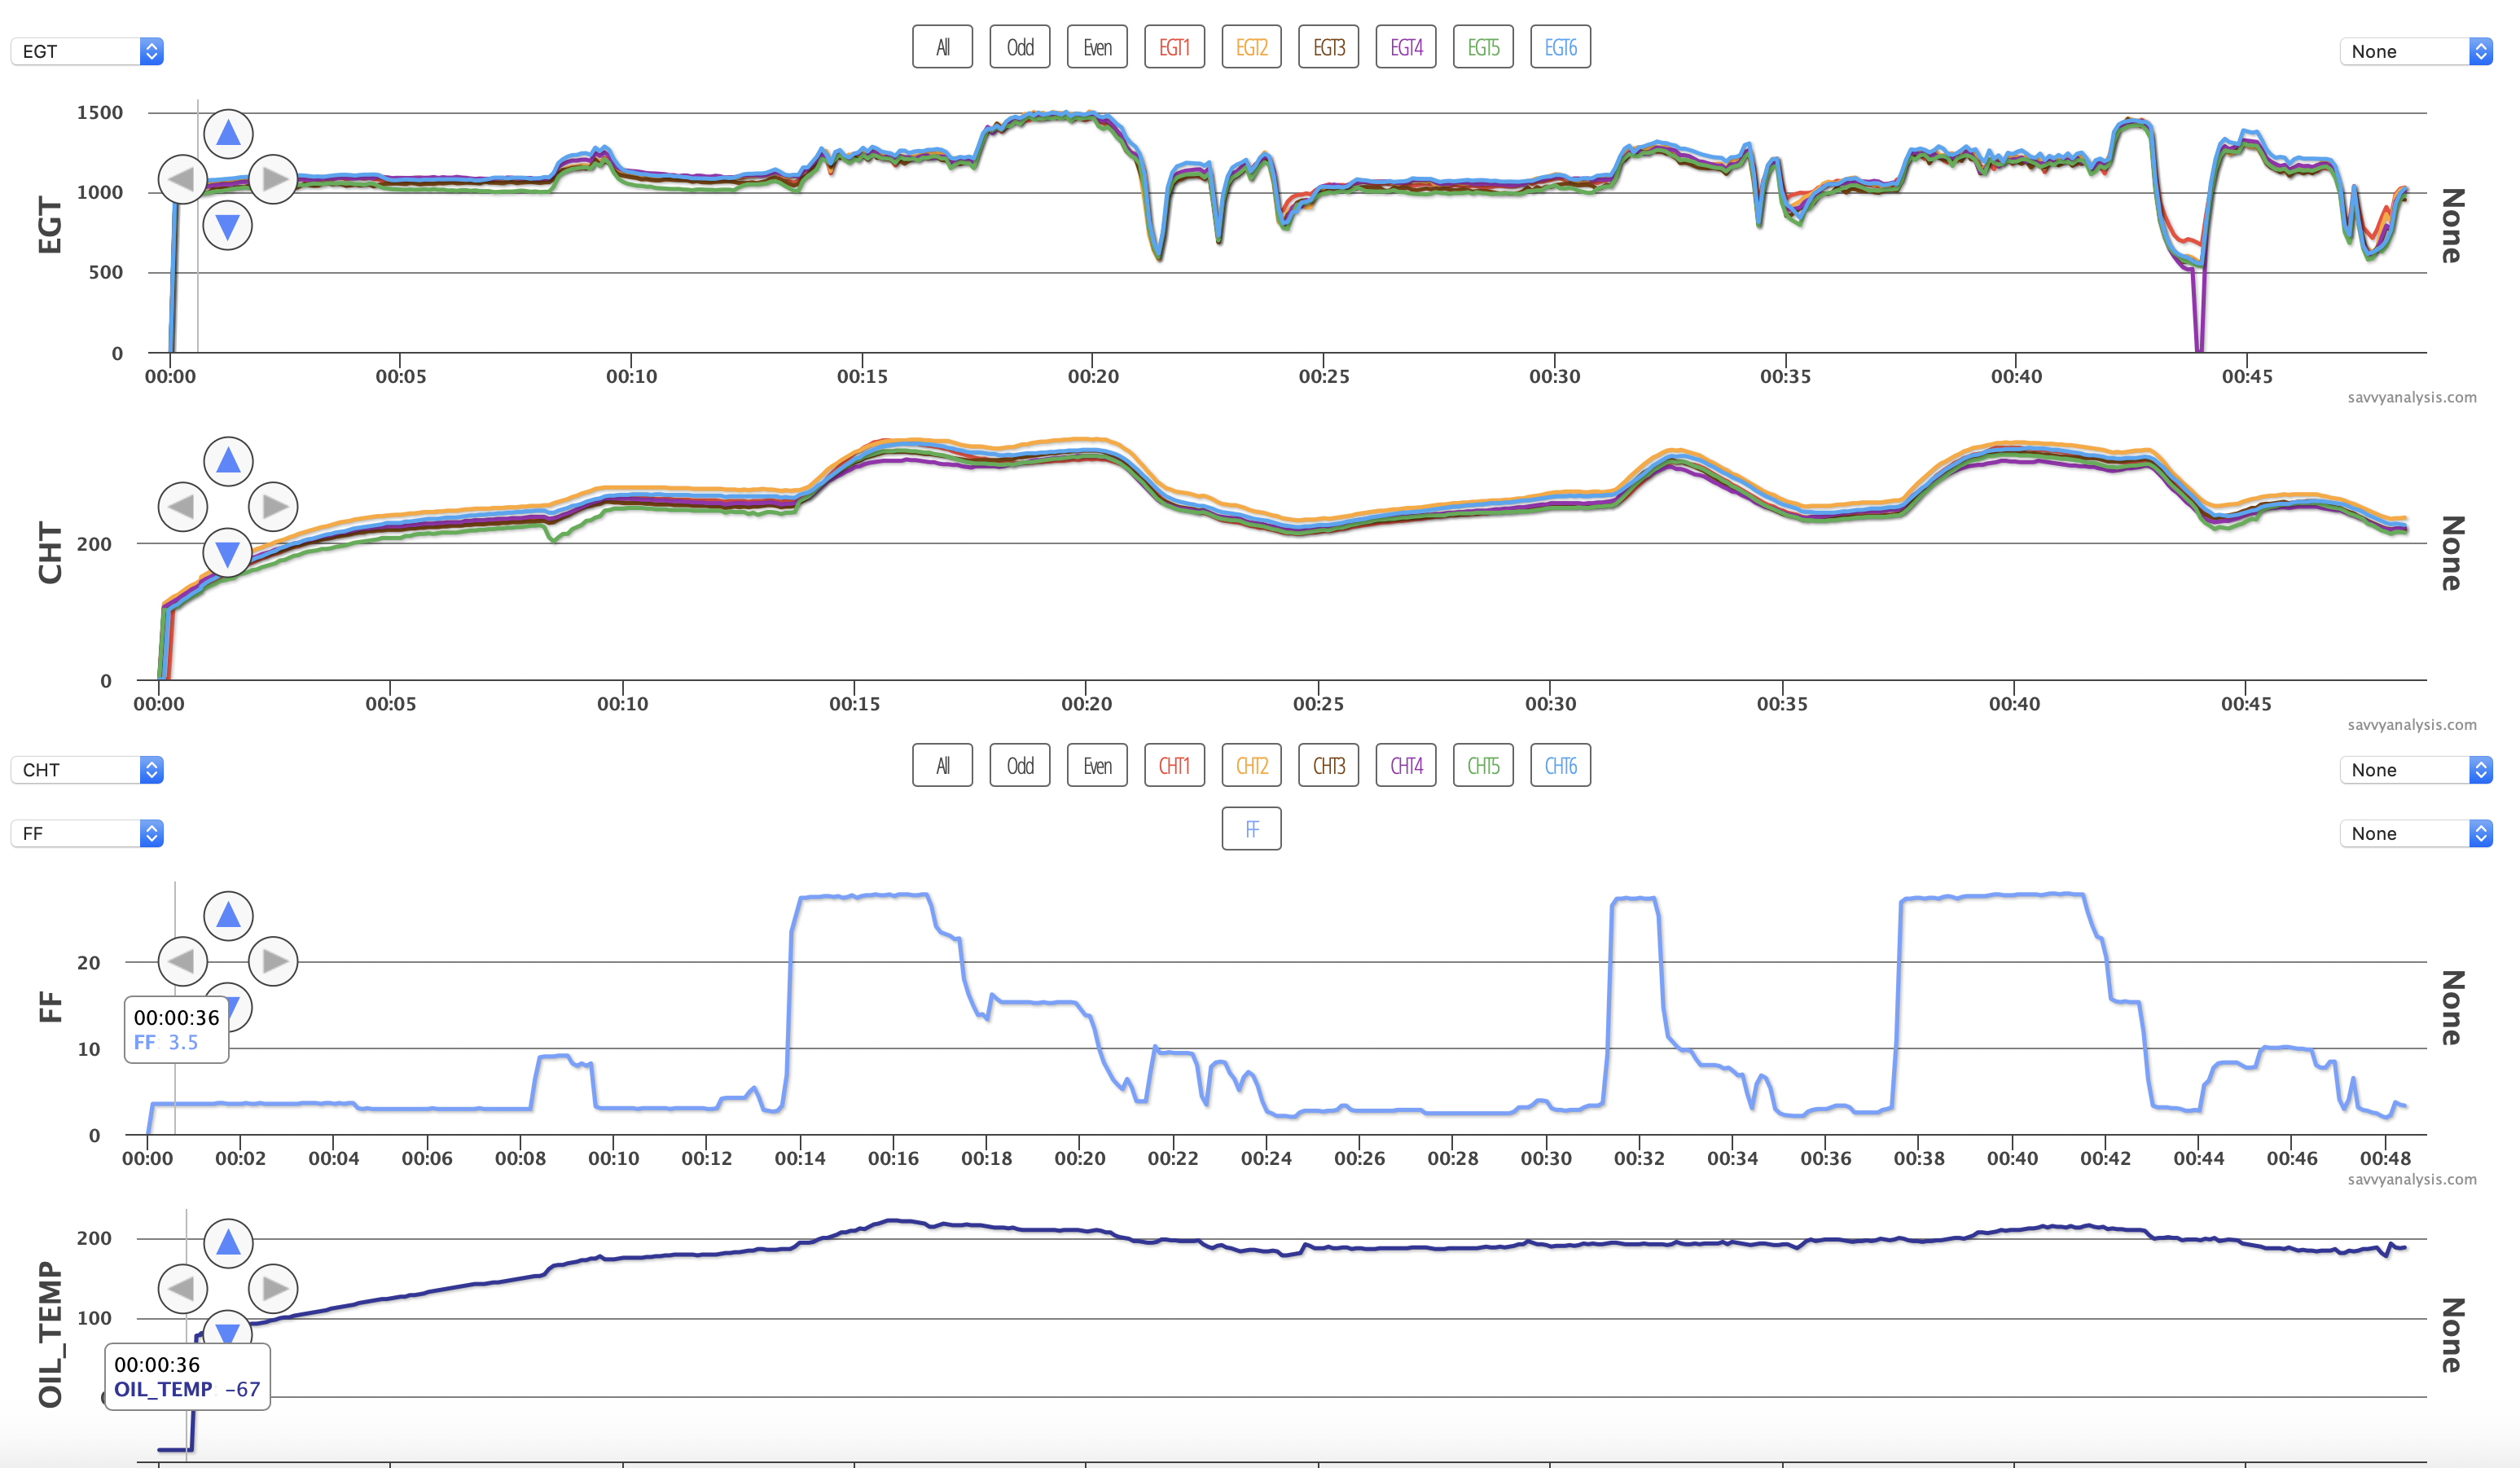
CHT 5 drops a little during gate mag check, then looks normal. EGT 4 drops to zero when power is reduced for the final landing. Not sure why FF gets up to 10 GPH during taxi-in – maybe it was uphill? And the EGTs look jittery during the first and third takeoff – second is short so it’s hard to tell. So we’ll keep an eye on CHT5, EGT4 and EGTs during takeoff and climb on the next flight.
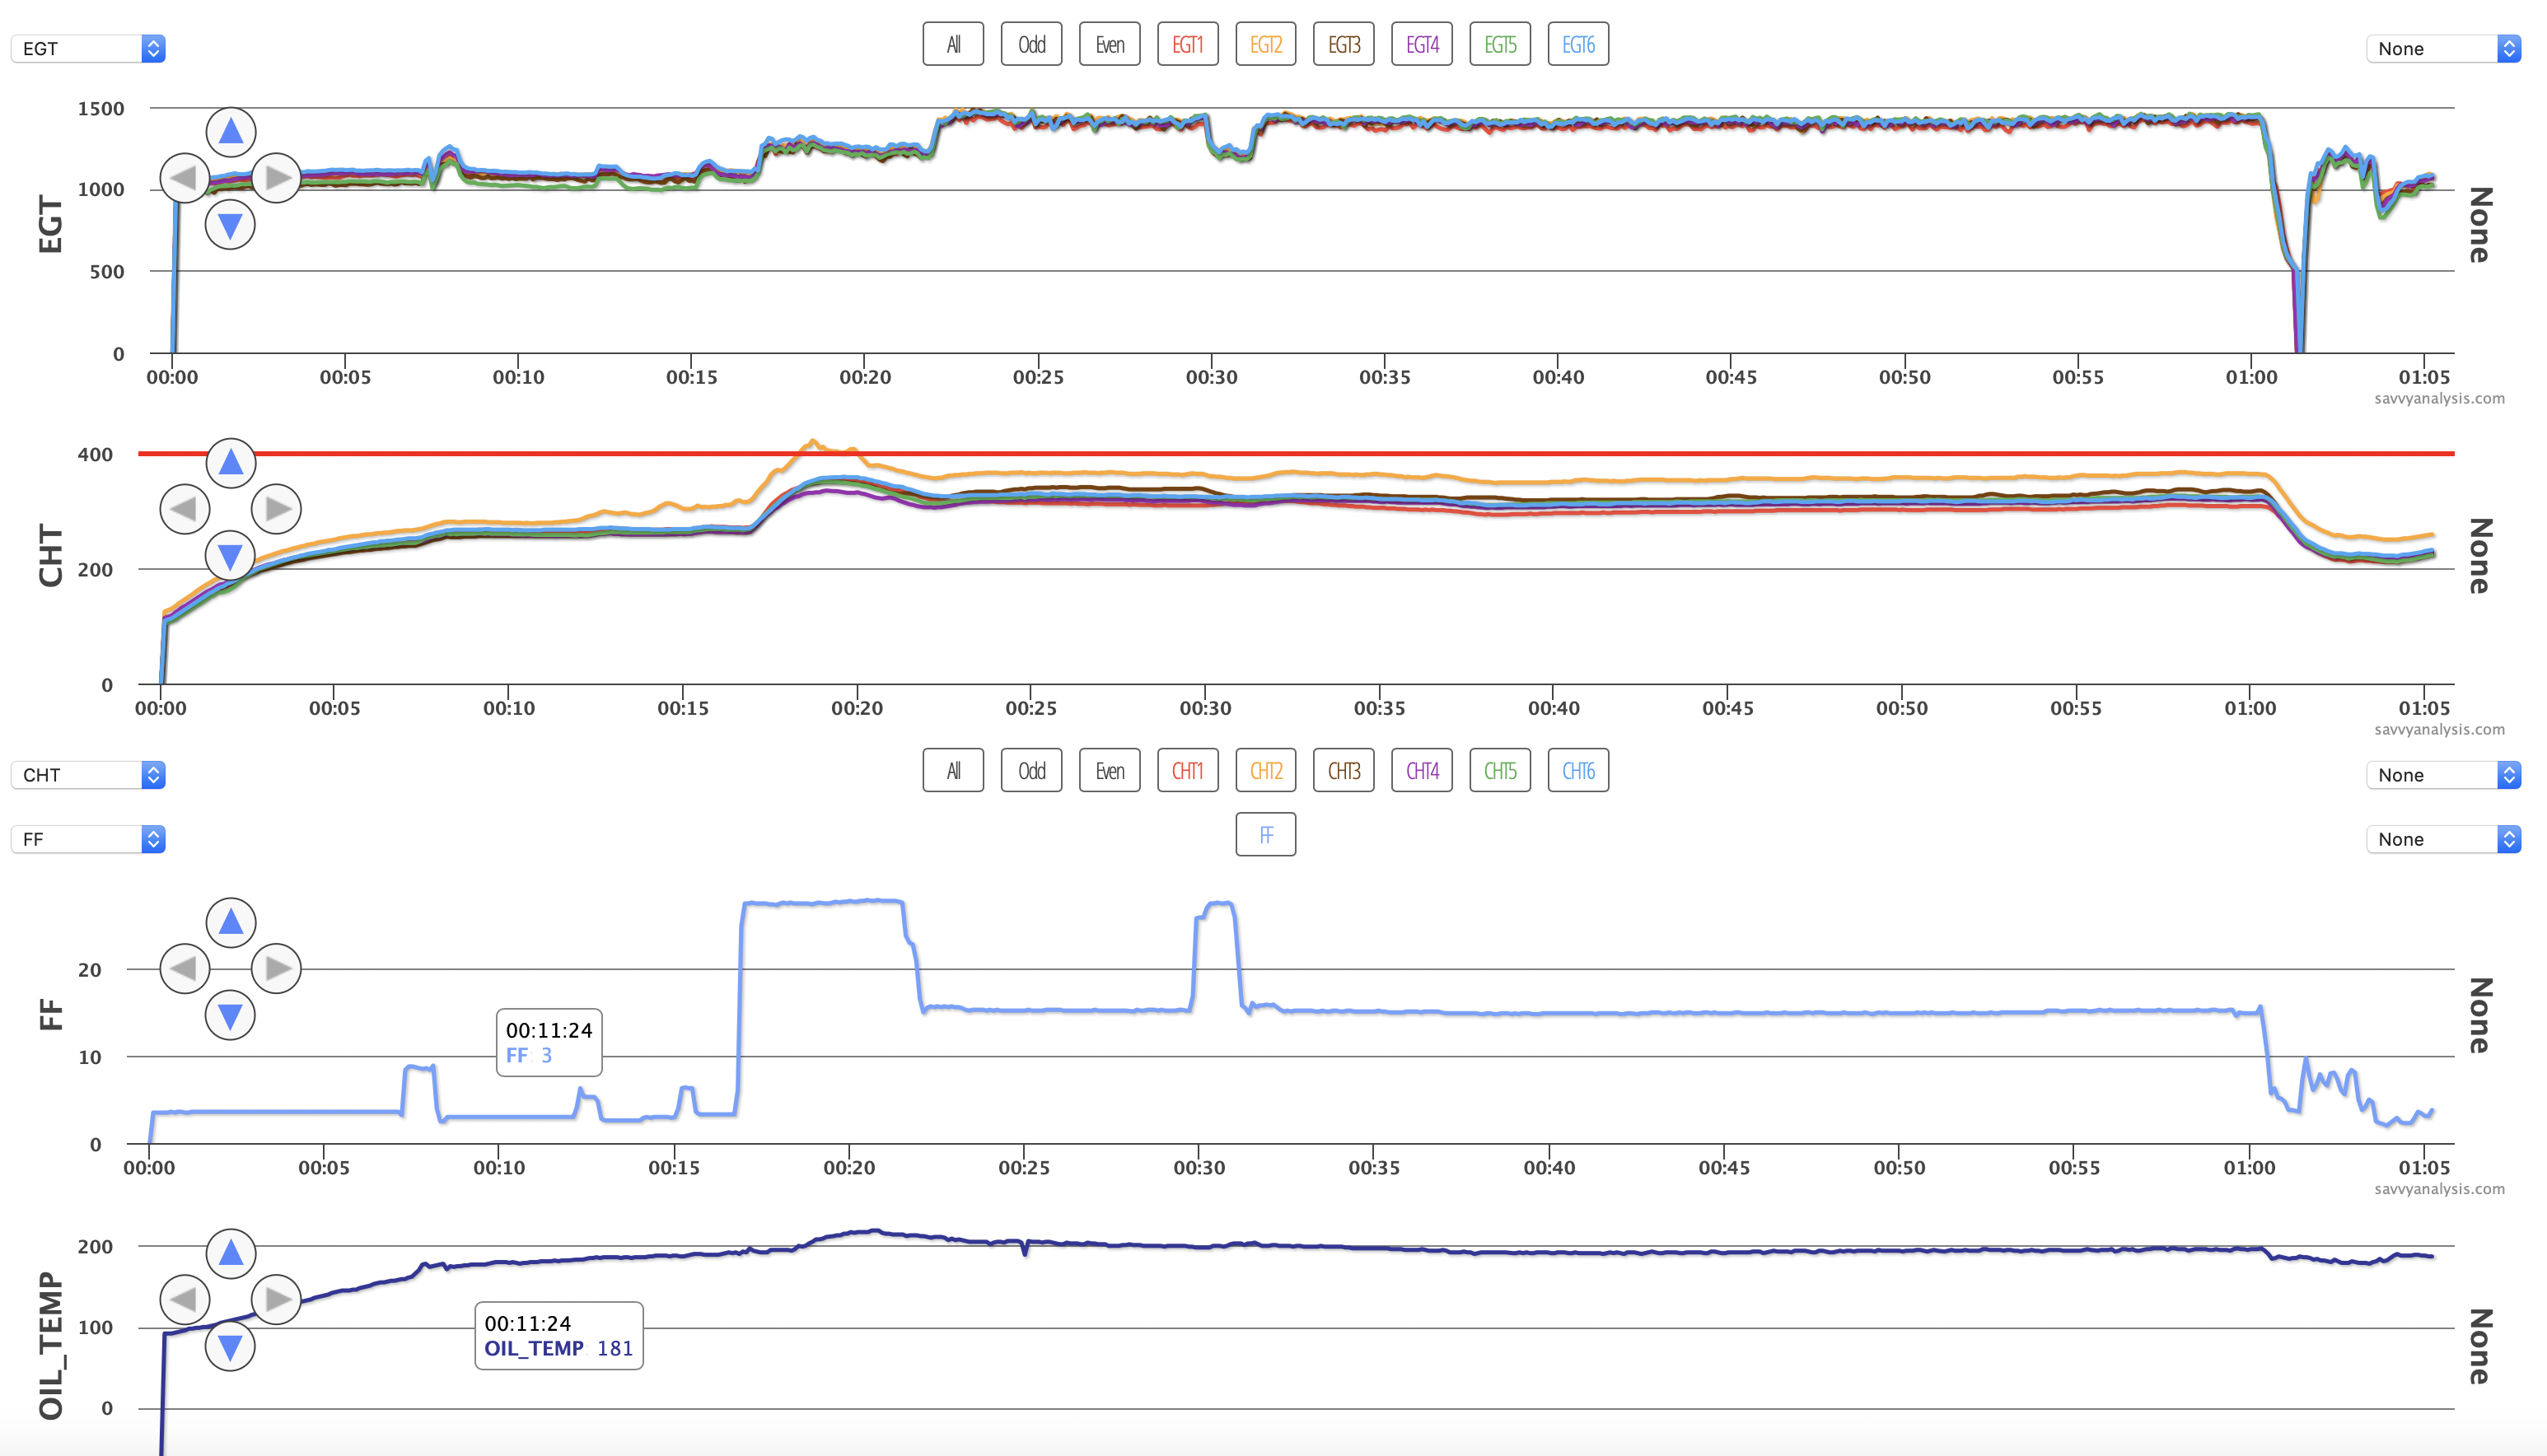
This time, nothing from CHT 5 and EGT 4, but CHT 2 is worrisome and those jittery EGTs are not just in takeoff and climb now. What’s different about this CHT 2 spike and the one from the Diamond we saw earlier? This time, EGT 2 looks normal – no big drop. And couldn’t it be a loose baffle like we saw with the Diamond earlier? Can’t rule it out, but because it starts climbing at about 12 mins – before takeoff – we can’t blame it on the wind. And CHT 2 stays high after the airplane has landed – so we can’t blame that on the wind either. It’s a little too soon to just write it off as a probe beginning to fail, but right now that’s our best guess. Let’s look at the next flight.
On the next flight, our suspicions are confirmed, as CHT 2 starts out high, then does a thermodynamically-impossible drop at the 6 min mark, then tracks high as before. The odd tracking of CHT 5 is back – you might wonder if it’s a failing probe why is it dropping while the one is going higher? Good question and probably means it’s not a failing probe – more likely a loose connection. So far we haven’t observed a pattern – it always does it when ___ or never does it when ___ . But the three events so far – on the first flight and the two events on this flight – seem to happen when FF is in the area just below the 10 GPH line. Something to keep an eye on but no recommendation for maintenance yet. Before we could recommend checking the connection and probe for CHT 2, we got this flight.
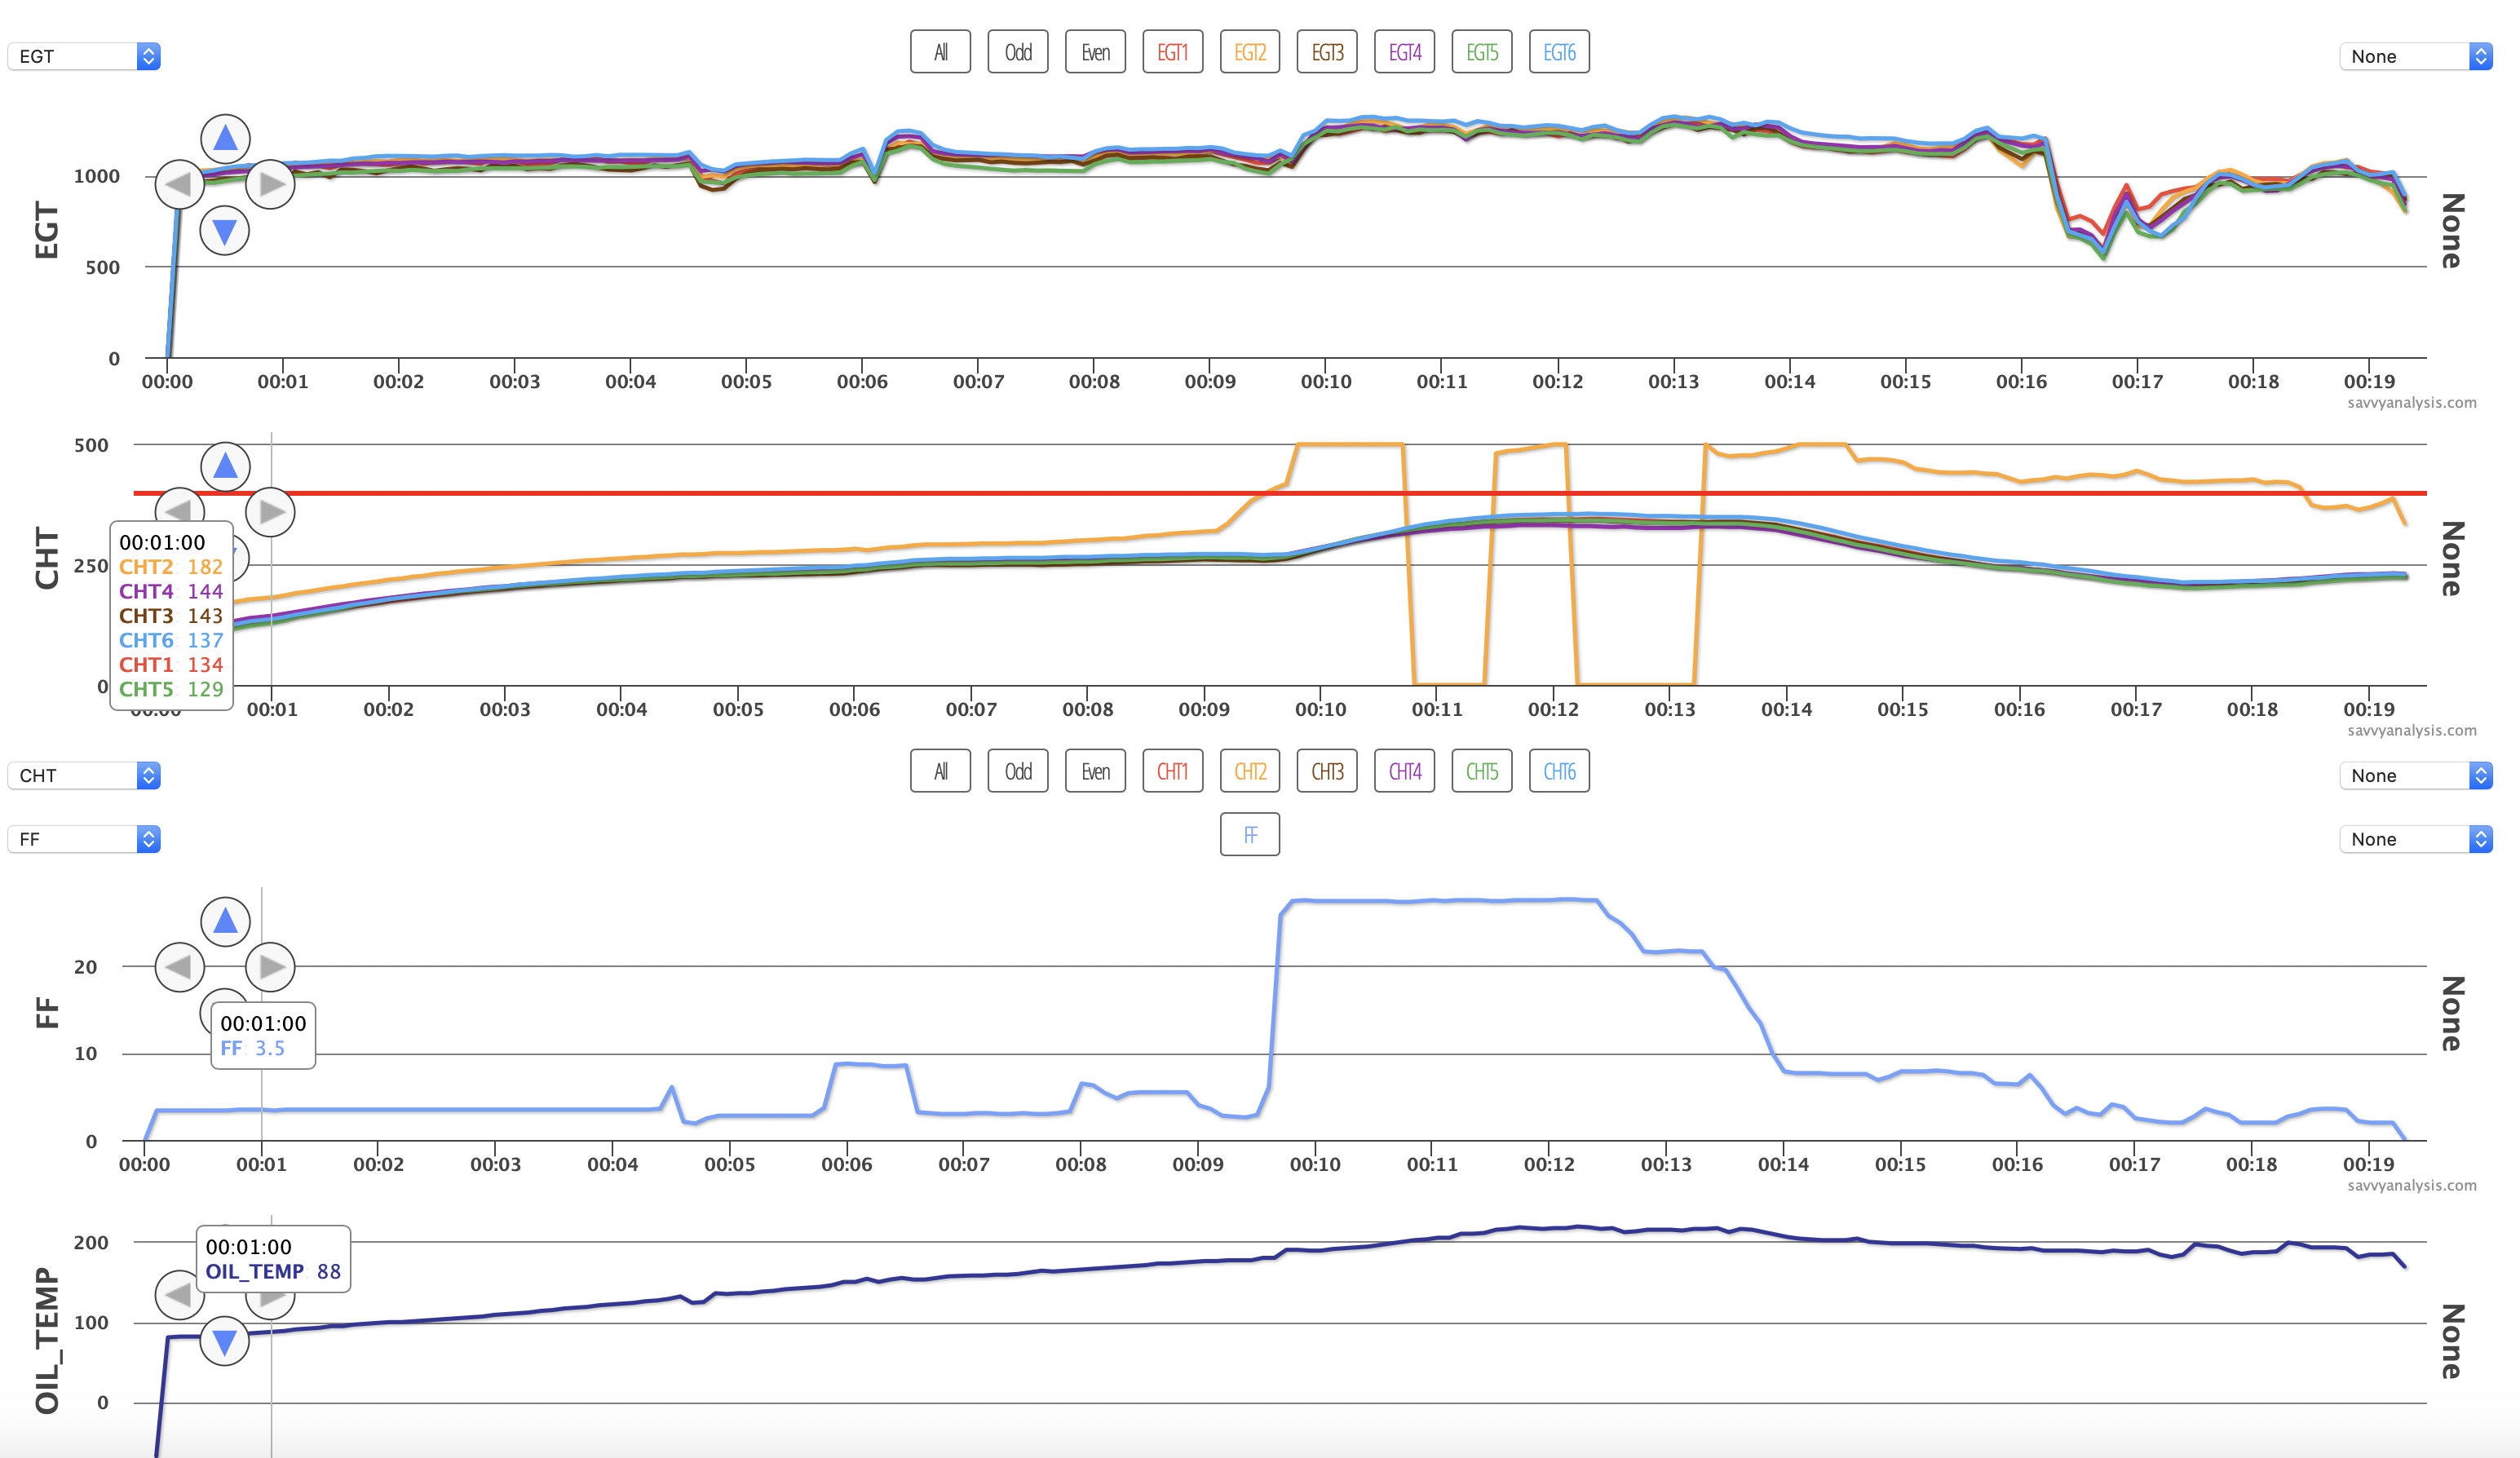
I don’t know if this flight was planned for 19 mins or if the pilot changed plans when CHT 2 started acting up – guessing the latter. Not only do we have a resolution on CHT2, but the earlier jitters we saw in EGTs aren’t there, at least not as much.
Bob Dylan didn’t need a weatherman to tell which way the wind was blowing, and you don’t have to be an analyst to know this is a failing probe. Avidyne probes fail to the high side, and they can’t handle anything beyond 500º, so they just post a zero. From the pilot perspective, it would be nice if failing probes just cut to the chase and gave us clear indications like this, or better still fail to 001º or some other easily identified code, so we can keep flying without becoming distracted. From the analyst perspective I’m glad it still takes a human powers of observation to put the volatility in context.
