Okay I’ll admit it. The first time someone showed me the selective attention video – the one where the gorilla walks through the teams passing basketballs – the setup was that there was a really nice prize if you could count the exact number of passes by the white team, and an even better prize if you could count the total passes by the white team and the black team. Being the competitive sort that I am, I wanted to win the even-better prize, so I fixed my concentration on shirts and basketballs and completely missed the guy in the gorilla suit. We have psychologist Bluma Zeigarnik and her research from about ninety years ago to thank for showing that we tend to focus on uncompleted or interrupted tasks better than completed tasks. Could this apply to your approach to processing engine data information while you fly?
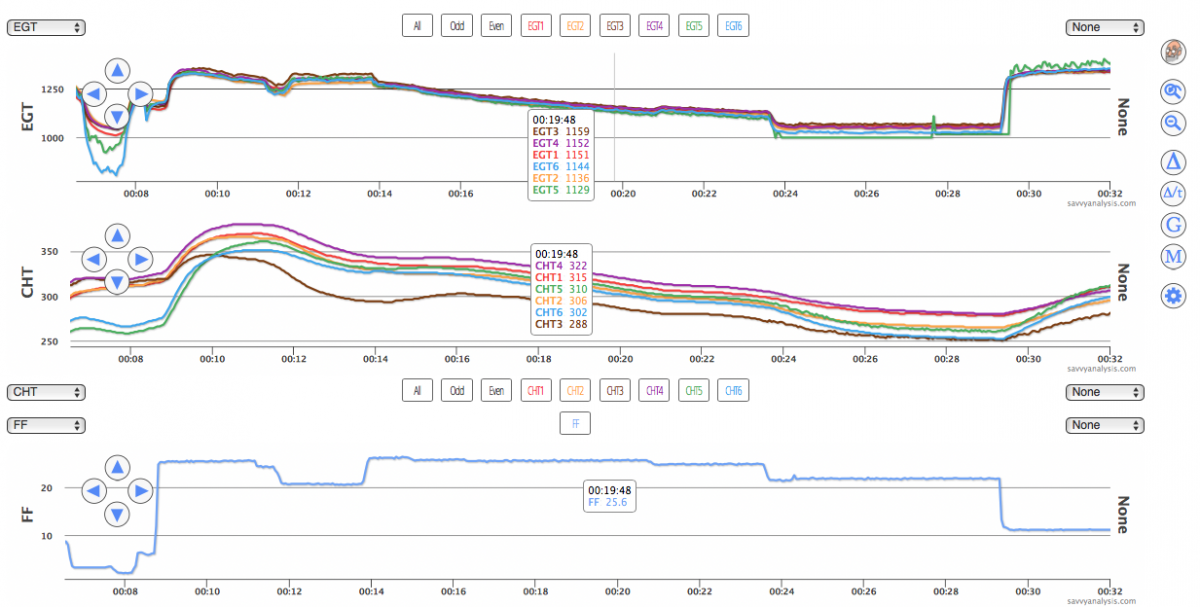
Let’s start this month with data from a Cessna Cardinal with a Lycoming O-360 engine and data from a JPI 700. Fuel flow is not logged, so EGTs on top, CHTs below that – with the red alert line at 400º F – and Oil Temp below that.
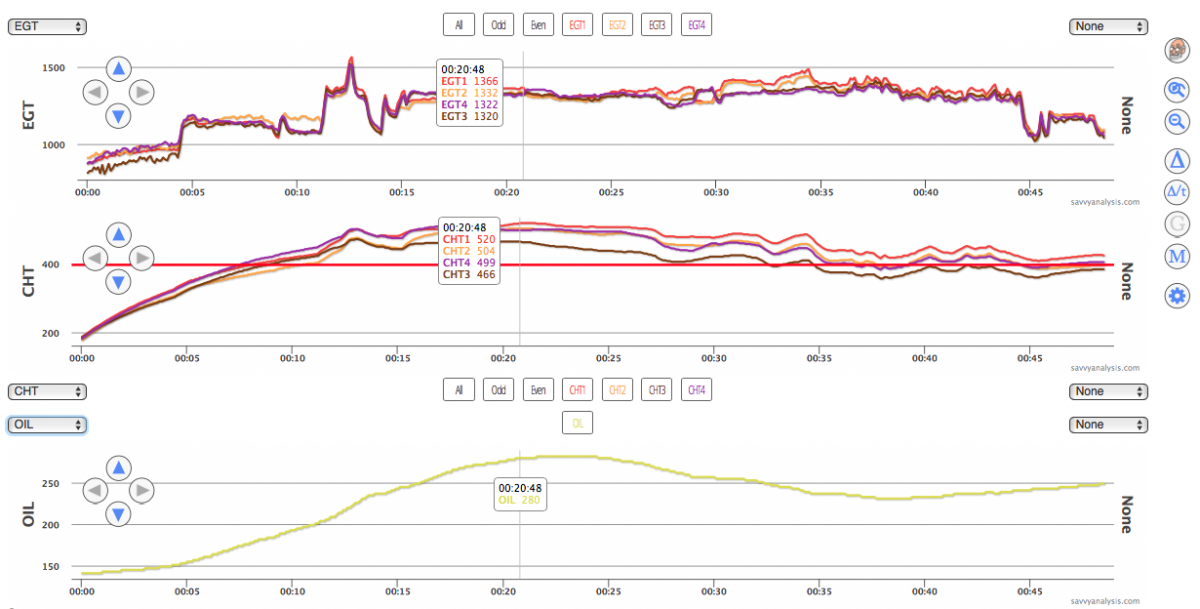
It’s painful to look at the CHTs and how they stay so high for so long. But EGTs are in a normal range – so no evidence of unusual combustion – like running on jet fuel. Around the 27 min mark EGTs 1 and 2 rise, which may have been a fuel adjustment, or maybe carb heat on. It maybe have been the pilot trying different things to bring CHTs down after finally realizing how hot they were.
For the answer to this puzzle, you have to think outside the box. Did you ever walk by an airplane on the ramp and see cowl plugs – also called engine inlet plugs – with a little flag sticking up over the cowl, so that the pilot doesn’t inadvertently leave them in place before starting the engine? Or maybe the strap connecting the plugs is wound around the prop so that if the plugs are still there when the engine starts, the prop will yank them out of the holes and fling them – somewhere…
And you may have thought “gee, how could anybody possible miss two big bright red plugs during their pre-flight inspection?” Let’s try and answer that. Maybe you’re a newly minted pilot, flying a flight club airplane, this 177 is a step up from the other club planes you’ve been flying, you’re based in the LA area and flew to a nearby airport for lunch, now you’re a little nervous about heading back into the busy LA airspace. Since I first saw this data – and realized it wasn’t a night flight – I’ve been trying to imagine how those plugs got left in place and why the pilot continued on, unfazed.
Sidebar – I have met several student pilots lately and after my usual pep talk I’ve been asking if the flight school airplanes they’re flying have engine data monitors. And the answers are some variation of “yeah, there’s one in there but we never talk about it” or “I don’t know, what does it look like?” I know a lot of smart people worked on last year’s revision of the FAA Airman Certification Standards and I know it was a contentious process, and there’s not a word in there about powerplant management – except for emergency procedures.
I know it’s complicated. You can’t standardize training unless you standardize the equipment, and it will add more time and cost to something that’s already time-challenging and cost-prohibitive for many, etc… But there is a safety concern. Would you want to be the next renter of that Cardinal after all of its CHTs got to 460º or higher, one got to 520º, and oil temp spent much of the flight in the 250-280º range ? — End sidebar rant.
In this case the pilot overflew one airport on his route. If he noticed the excessive CHTs – a fact not in evidence – the thinking may have been to get the airplane back home and sort things out, since it’s only another few minutes in the air. Kudos to Williamsport, PA for building an engine that could withstand this inadvertent test flight.
Next up is data from a Cirrus SR20 with a Continental IO-360 and data from an Avidyne with a 6 sec sample rate. From top to bottom, my standard layout of EGTs, CHTs, FF and Oil Temp. The red CHT alert line is set for 400º F.
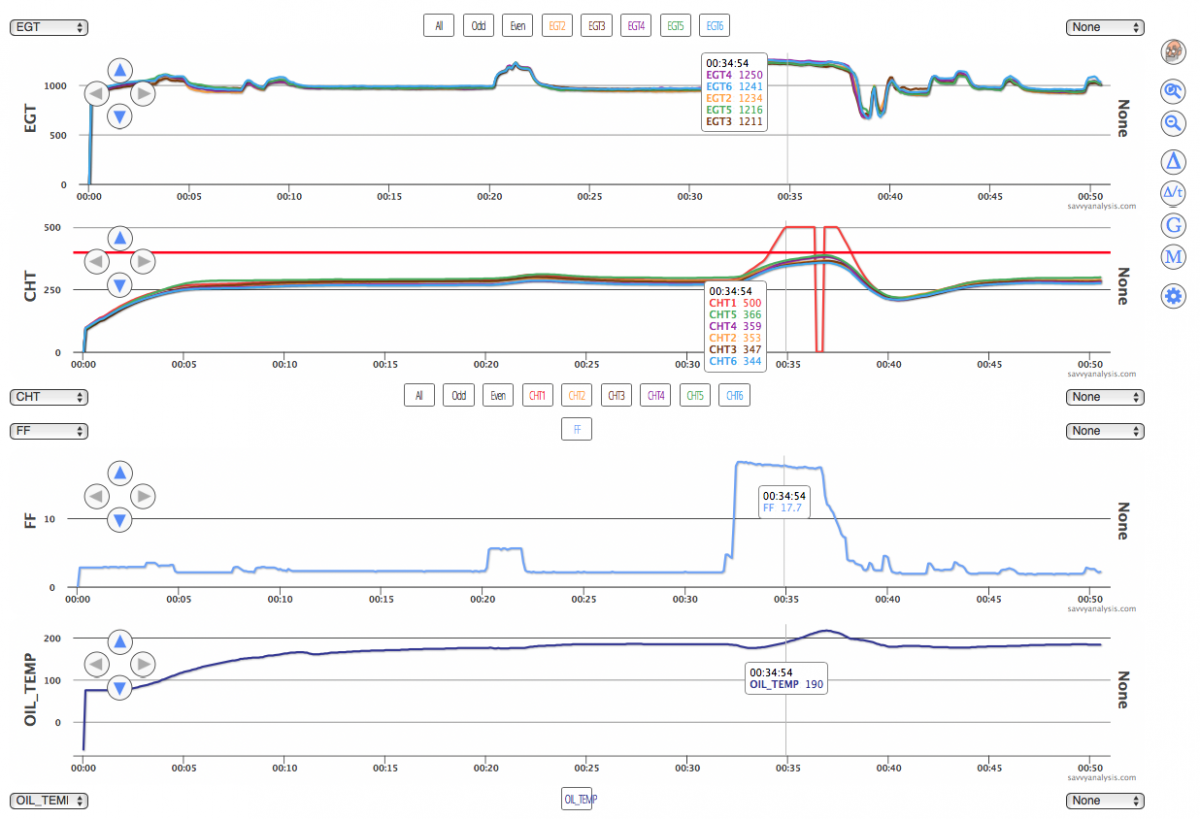
It’s 50 mins of flight data – 32 mins of ground ops, then about 8 mins in the air, then more ground ops. Why 32 mins before takeoff ? Without revealing the location, let’s say it’s one of those under-the-class-B-ring airports where it can take a while to get your IFR release, although the 20 before runup seems like the long part. Nothing unusual in the runup in terms of feel or data.
At takeoff, CHT 1 starts a trajectory that takes it to 500º where it flatlines, then gets so hot it has to drop out, then flatlines again until after FF is reduced to idle. Max FF of 18.2 GPH is good for this engine, and the pilot doesn’t have “more gas” as an antidote for the detonation. Less gas, though – a lot less gas – ends the event.
Of course Murphy has a part in this, having failed the EGT probe on the previous flight, so that if there had been an unusual combustion pattern in EGT 1 in the extended ground ops or the runup that might have telegraphed this impending event, too bad. It’s not even unreliable data – it’s just not there.
Post-flight inspection of the cylinder revealed some signs of detonation, but the quick action of the pilot probably kept it from getting worse.
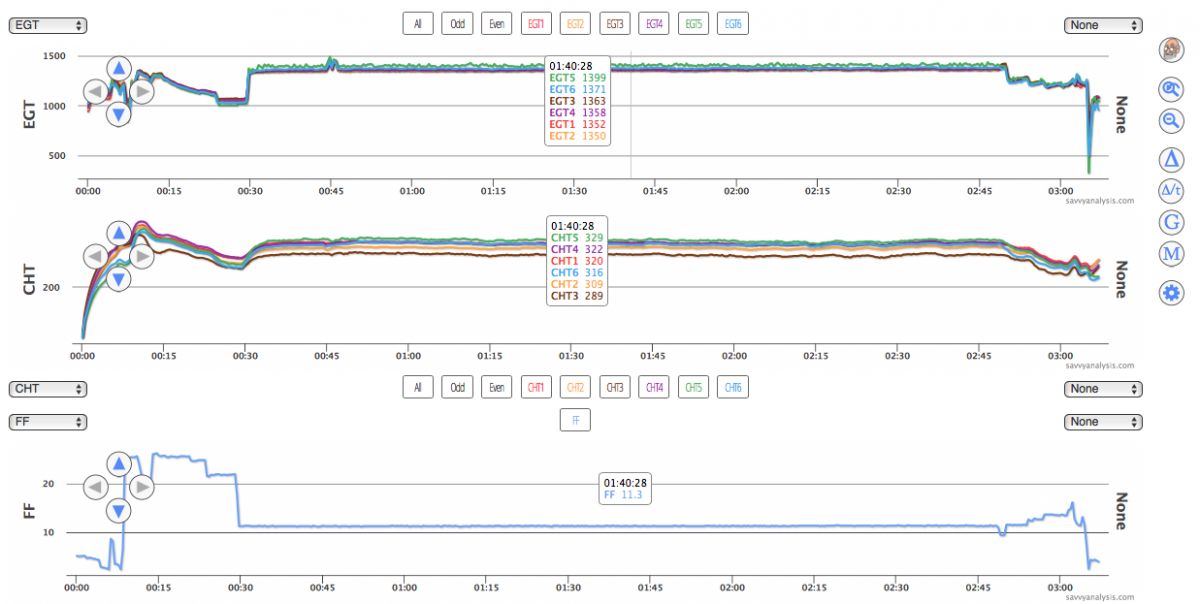
Next up is data from a Beech Bonanza 35 with a Continental IO-520 and data from a JPI 730 with a 1 sec sample rate. Standard layout.
There’s something happening in the green EGT 5 trace. There’s a mag check at about the 45 min mark. Let’s zoom in to there.
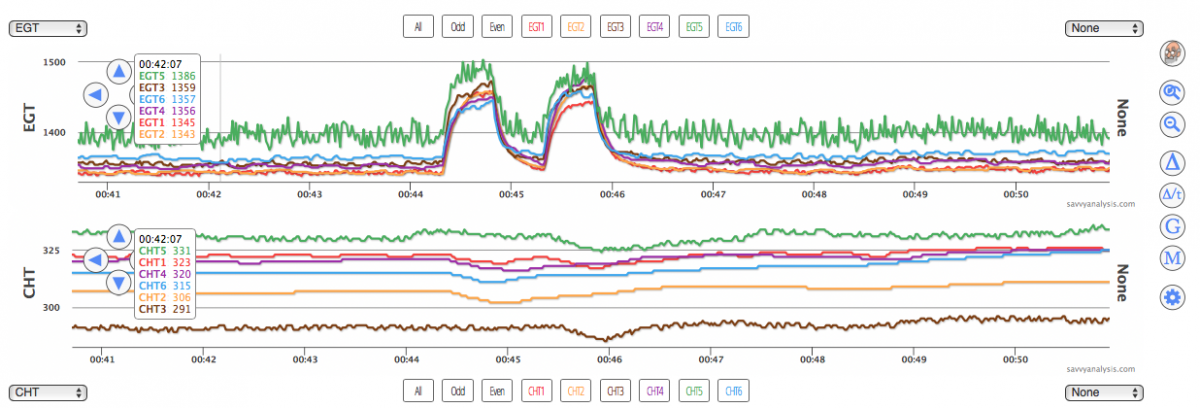
Either both plugs are misfiring, or a fuel issue is effecting the whole cylinder – not just one plug. Or could this be a FEVA pattern from a burned valve? The amplitude and frequency don’t fall within the expected numbers, but let’s see if other data can corroborate or refute the FEVA theory. Here’s data from the early part of the flight from the climb up to the big pull.
The jittery pattern isn’t there. In fact, from about 24 mins to just before the big pull, EGT 5 looks flat punctuated by one spike. Then at the big pull it jumps vertically to the jittery pattern we see in cruise. Of all the options – fuel problem, bad plug, bad harness, burned valve – a loose EGT connection sounds like a bullet successfully dodged.
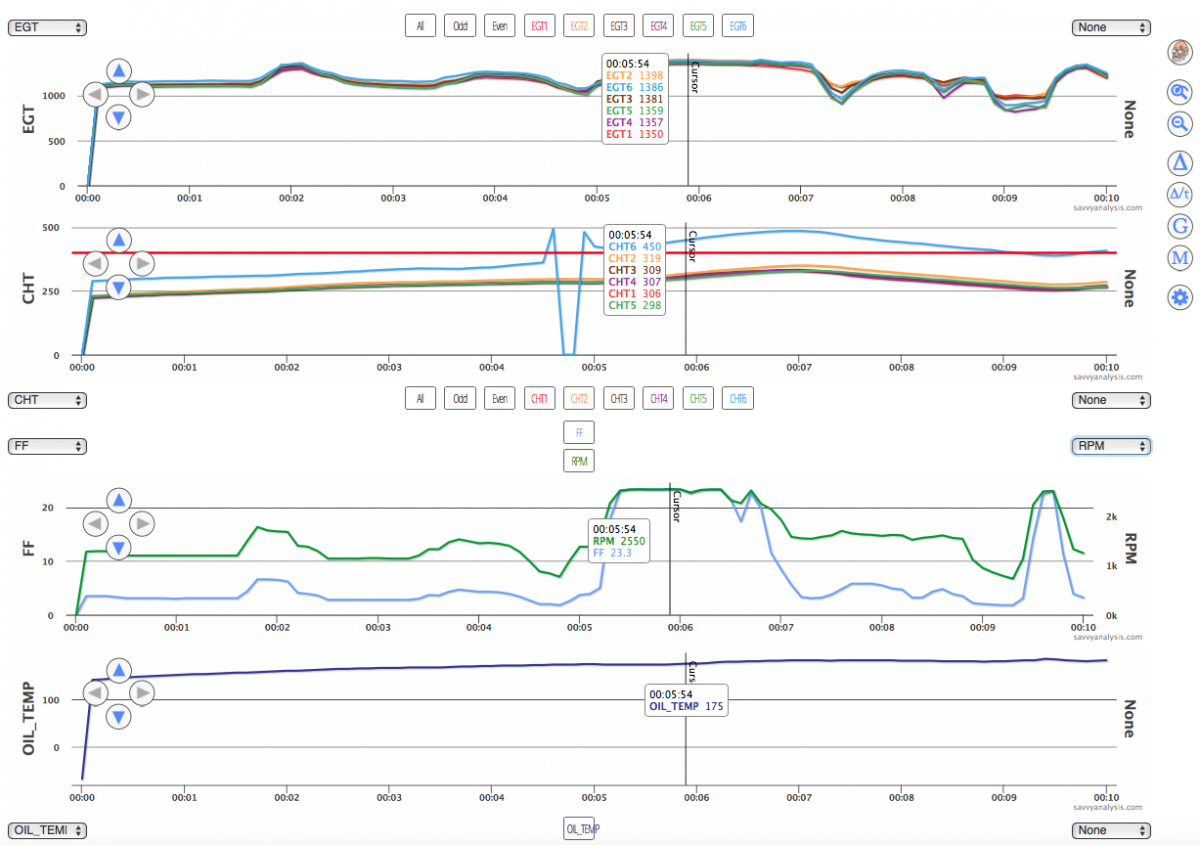
We’ll finish this month with data from a Cirrus SR22 with a Continental IO-550 and data from an Avidyne with a 6 sec sample rate. Top to bottom – EGT, CHT, FF and RPM, Oil Temp.
On this flight, the engine failed to reach max FF and RPM, and CHT 6 looked suspicious. It’s great when probes fail spectacularly with a drop from 500 to zero and back. Maybe you’re thinking hey, not so fast – this looks just like the SR20 from earlier. Why isn’t this one detonation, too ? True, the middle of the CHT pattern does, but there’s no steady ramp-up and cool-down, plus this engine’s idling before takeoff. Back to why it didn’t make power.
After checking previous flights for when the reduced power started happening, we noticed that all was fine until mid-April, then there was a gap in the data, then the problem happened. So our report back to the client asked if maintenance had been performed during that gap. The answer was “yes, we had an ADS-B unit installed but no engine maintenance.” There’s your clue, puzzle solvers.
It helps to know that the Cirrus throttle and prop controls are in the center console, and the cables pass under the radio stack. Aha. When the ADS-B unit went in, the shop had to adjust the throttle and prop cables. The pilot of the return-to-service flight had 23 GPH and 2550 PRMs which was plenty of power, and didn’t notice that the engine wasn’t making full power. Fortunately, when the shop realized the problem they fixed it on their dime.
