Good news! They’re making Spinal Tap 2, with plans to release it in 2024 – 40 years after the first one. Of all the great quotable lines in ST1, it’s hard to top “these go to eleven”. Sometimes we get a set of screwy engine data that makes us wonder if the data came from one of those “eleven” monitors.
When I’m working tickets, I find they fall into three basic categories. First is when I see something familiar, like a clogged injector or weak spark in one of the plugs. Sticky valves are getting easier to spot. Failed and failing probes are usually easy to spot. Second its when I see something that isn’t as familiar, but makes sense in the context of the details on the ticket. Examples are induction leaks, vapor lock, and loose baffles and other cooling problems.
The third category are the ones that require a deeper dive. Something is happening and we’re not seeing it in the data. At least not initially. Well start November with one of those.
First up is data from a Bonanza 35 powered by a Continental IO-520 engine with data from a JPI 900 with a 1 sec sample rate. Here’s a typical 3+ hour cruise fight depicting EGTs, CHTs and FF.
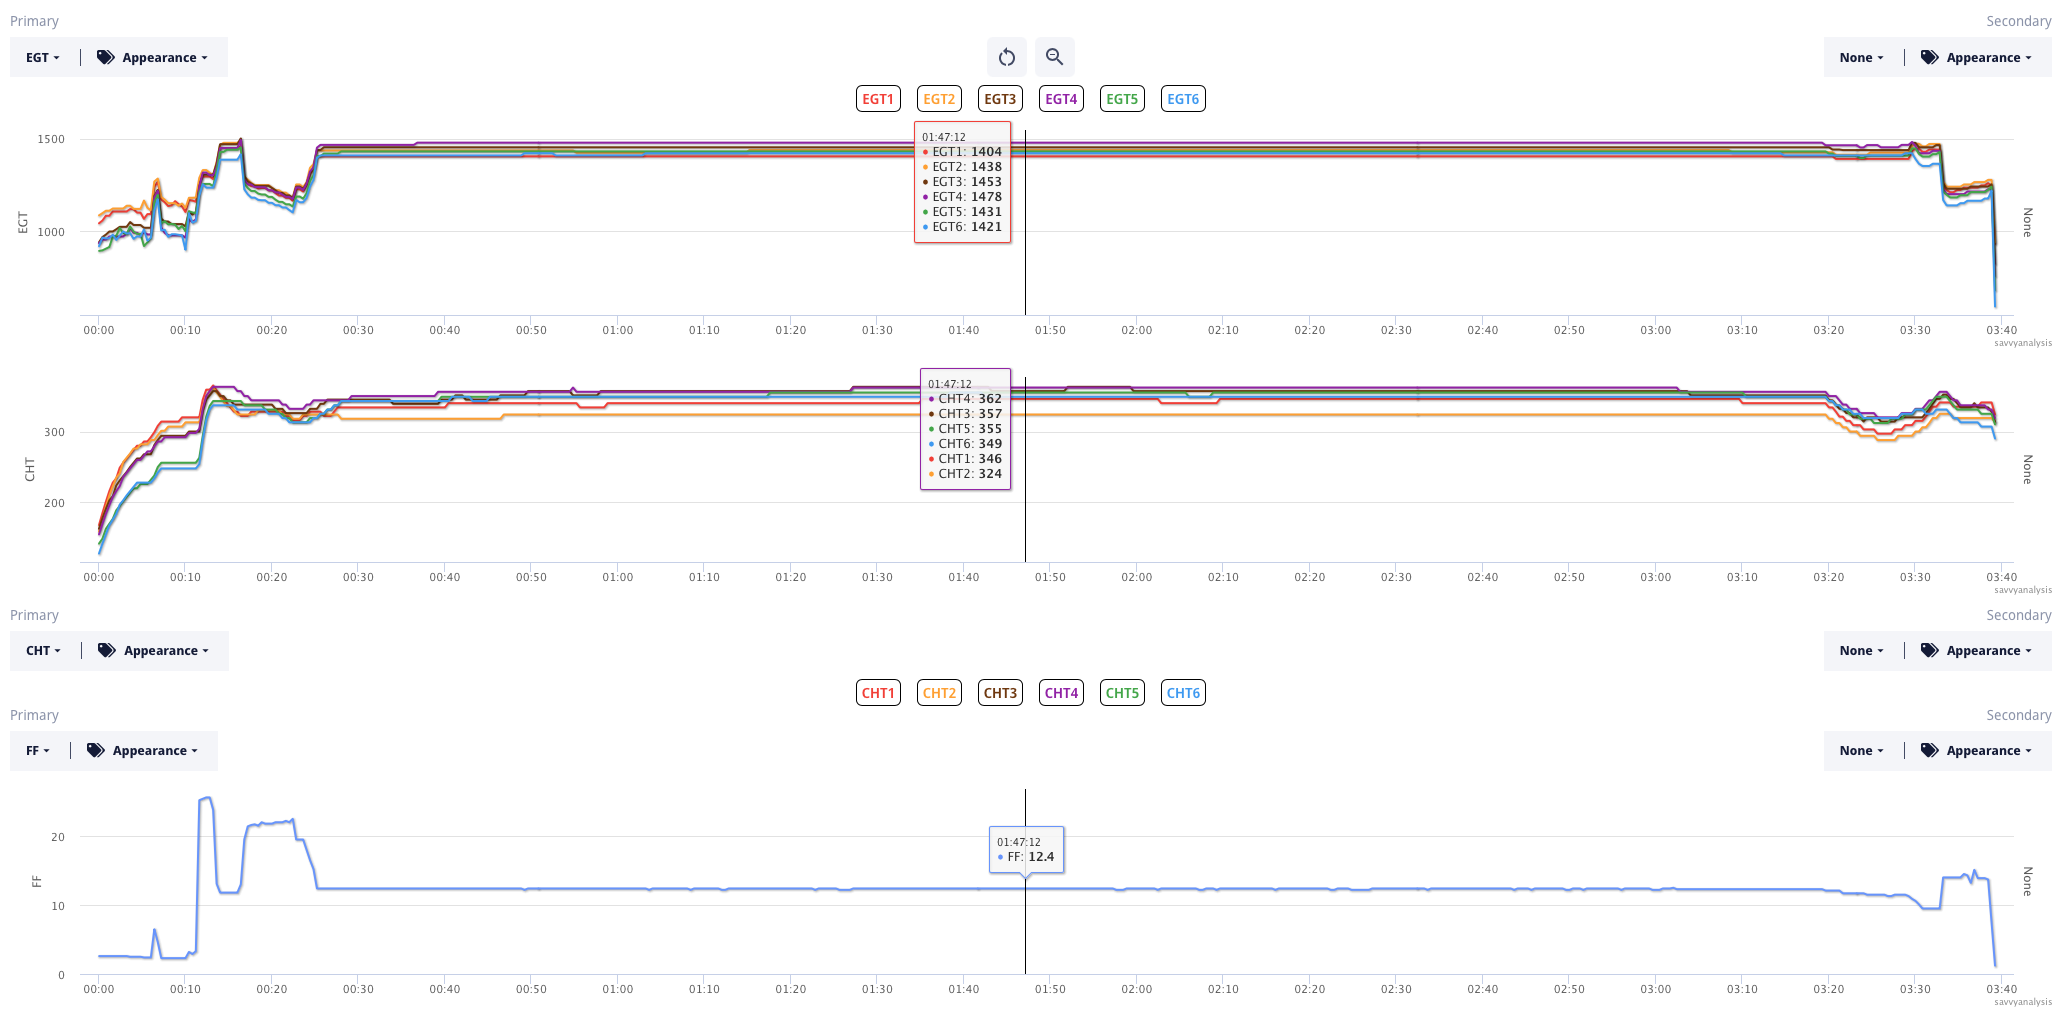
Here’s the context.
I have owned the A/C since 2013 and have put on about 1,000 hrs. Jan. 2017 I topped the engine with 6 Superior Millennium SA52006-A20P Cylinders. Engine has run very smooth since with NO issues. Engine has about 500 STOH. Few months ago engine started to run very rough on Takeoff climb at WOT. Problem was intermittent and only at WOT, after good amount of trouble shooting my Mechanic replaced Rt Mag on 10/26/21. That problem has not reoccurred, but still in the back of my mind, something is still amiss. (I’m a Mechanical Engineer) Let’s call it a minute surge, and not see in the engine logs, almost just a slight change in engine frequency.
I’m pretty data-driven, which you’d expect from an analyst, but I can relate to that “something is amiss” feeling. Nearly everyone on the analysis team has an airplane they know very well and know when things aren’t right. In this case, we thought the “slight change in engine frequency” might be in the RPM or MAP data. Here are those two – same flight – but zoomed into the cruise segment.
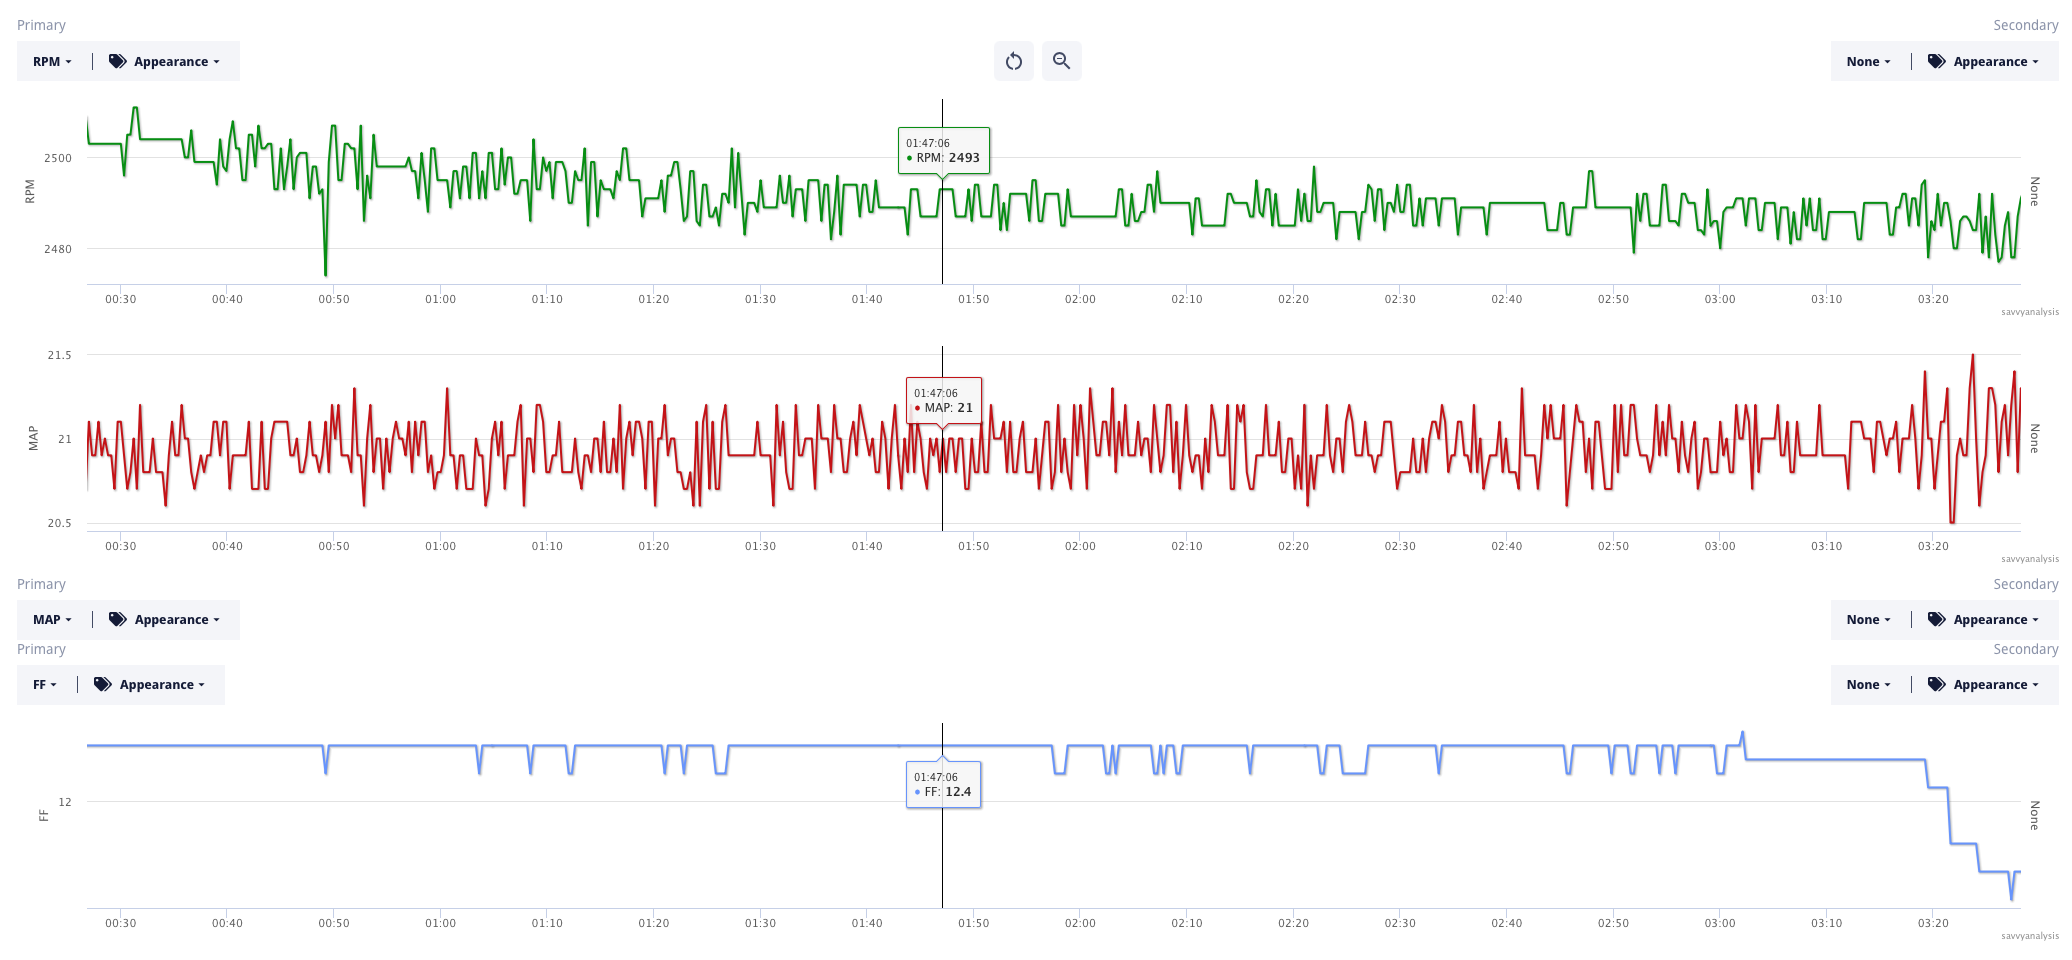
Neither RPMs nor MAP are as stable as FF, but we’re not seeing anything resembling a pattern. There’s a range – but not a pattern. Ray worked this ticket and asked for test profile data and determined that the GAMI spread was high, but it was hard to connect that dot with the engine frequency dot. Then the owner spotted something.
I finally got a chance to fly yesterday I found the cause of the ” almost just a slight change in engine frequency” was a cowl flap. When closed was resting on the exhaust stack. Don’t know why that happened, but I could see maybe a 1/16 to 1/8 rub area on both the stack and the cowl flap.
In this case the value of the data was to help rule things out, so the owner didn’t throw a lot of money at parts and labor chasing something that wasn’t broken.
Next up is data from a Mooney M20J powered by a Lycoming IO-360 engine with data from a JPI-830 with a 1 sec sample rate. Here’s a series of takeoffs and landings depicting EGTs, CHTs and FF.
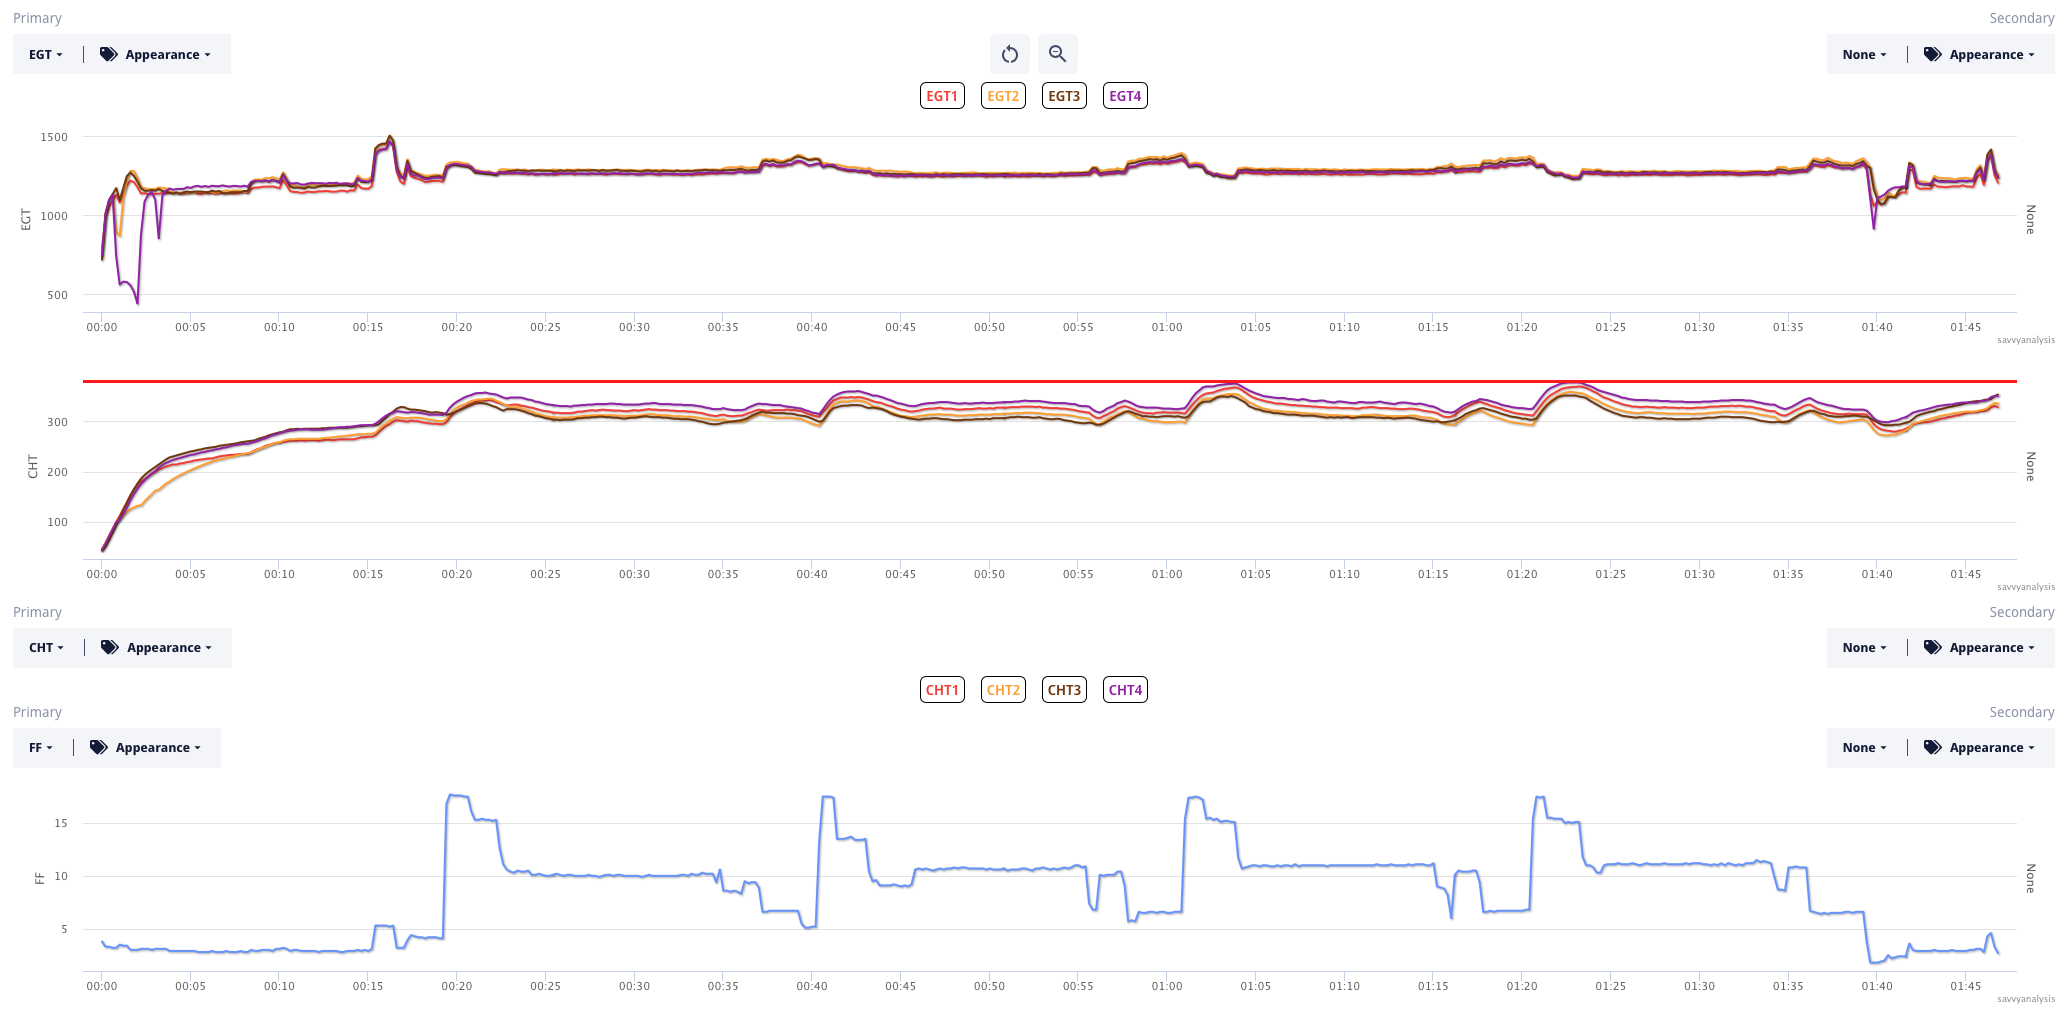
After the 5 min mark everything looks pretty good, except for one dip in EGT 4 after the last landing at 01:40. Let’s zoom in on the EGTs just after engine start.
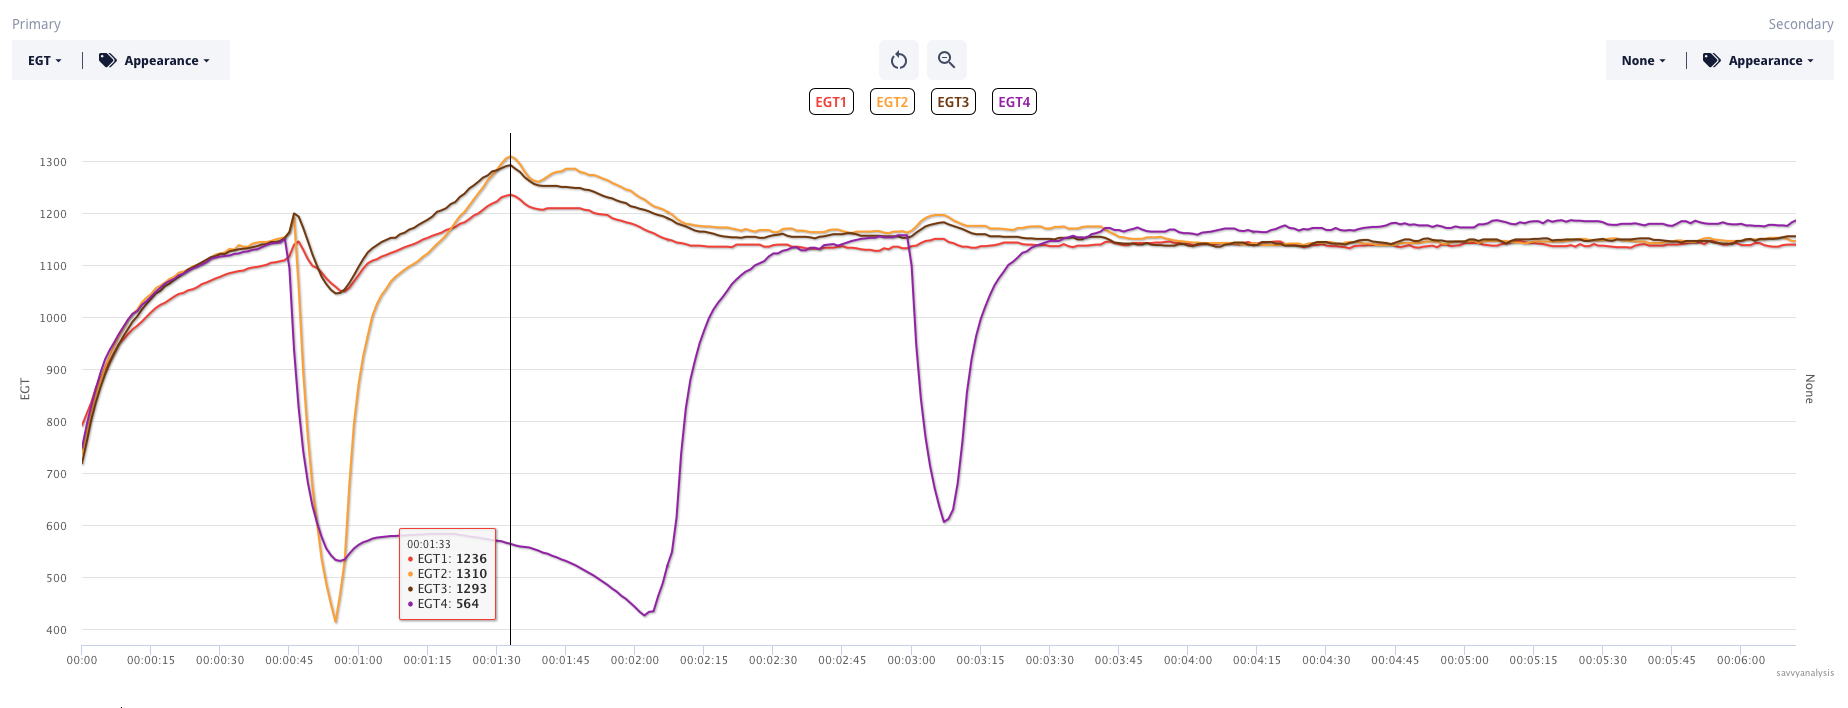
EGTs 1 and 3 look ok, but there’s a big and short drop in EGT 2, and a big and long drop in EGT4, with another short drop to follow. This is a pretty textbook case of morning sickness, with the exhaust valve sticking shortly after engine start as it warms up. After that, both EGTs are normal through the series of four segments of about 20 mins each.
Paul worked this ticket – he’s our Mooney specialist – and recommended the “wobble test“. In this case, cyl 2 failed the wobble test but cyl 4 passed. So could the minute-long drop in EGT 4 have been caused by the quick drop in EGT 2 ? Unlikely. So far our client hasn’t had rough starts as in the past, but we won’t be surprised if cyl 4 needs attention before too long.
Next up is data from a Cessna 310 powered by Continental IO-520 engines with data from a Garmin G500 with a 1 sec sample rate. Here’s a 3-hour flight with a CHT excursion on the right engine during approach.
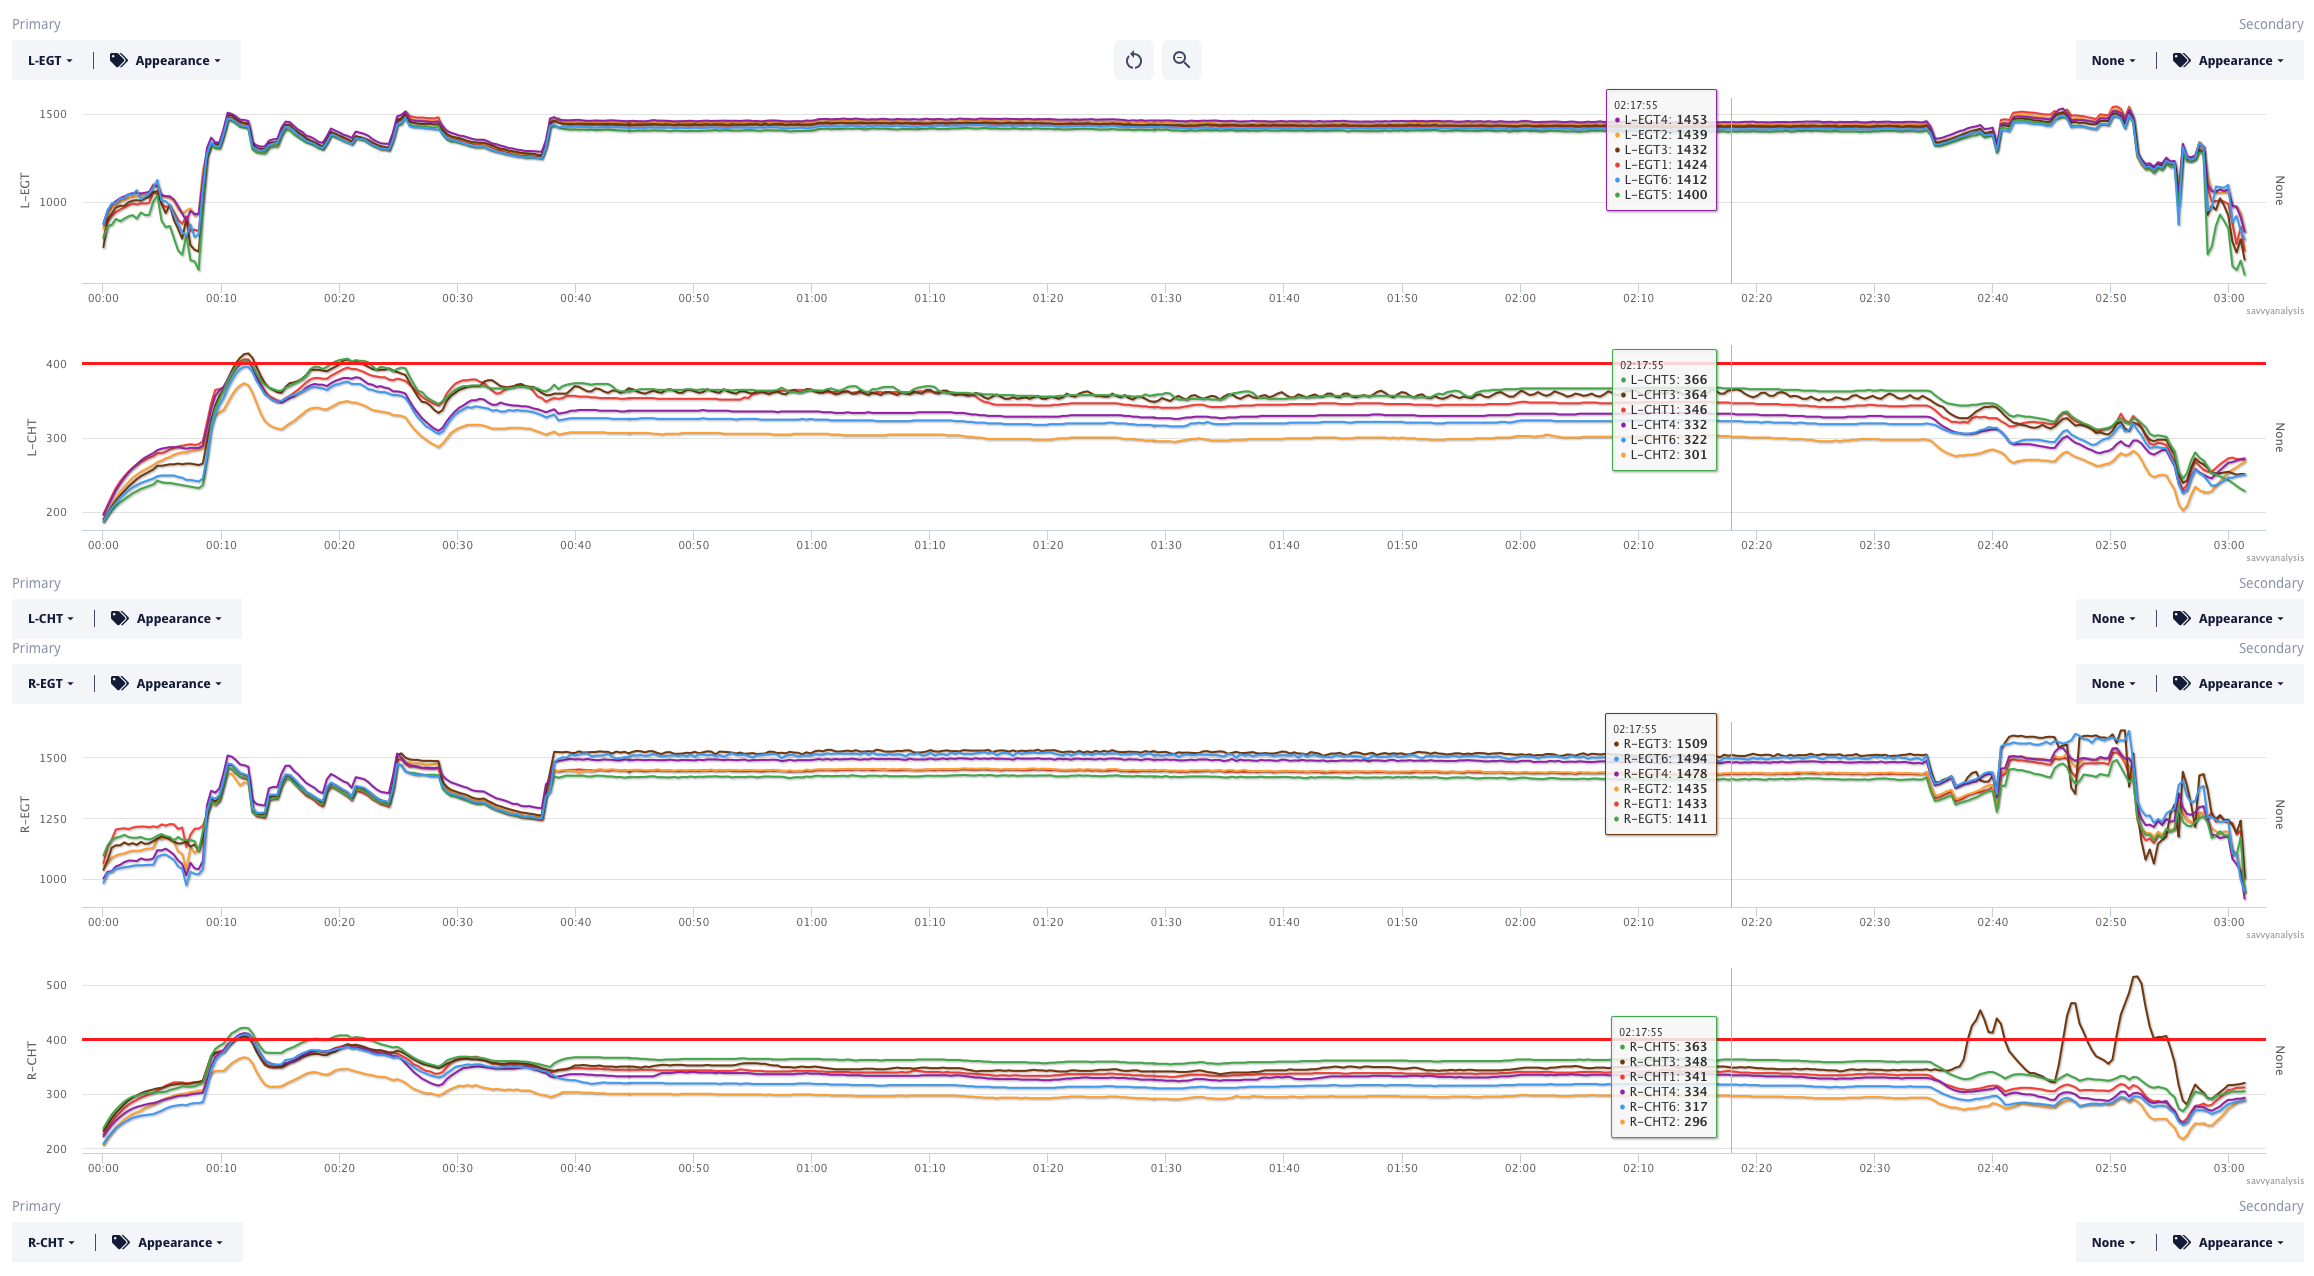
Before we move away from left engine data, let’s talk about the wavy pattern in CHT’s. The small oscillations are confined to left engine cylinder 3, but CHTs 1 and 5 are elevated, so it looks like cooling needs to be checked on that side of the L engine.
Before we zoom in on R engine data, notice R EGT 3 is high throughout, and has more chatter in the data than the others. We’ll see that more when we zoom. Here’s the last half of the flight with R engine EGTs and CHTs, and the bold blue line is R engine FF.
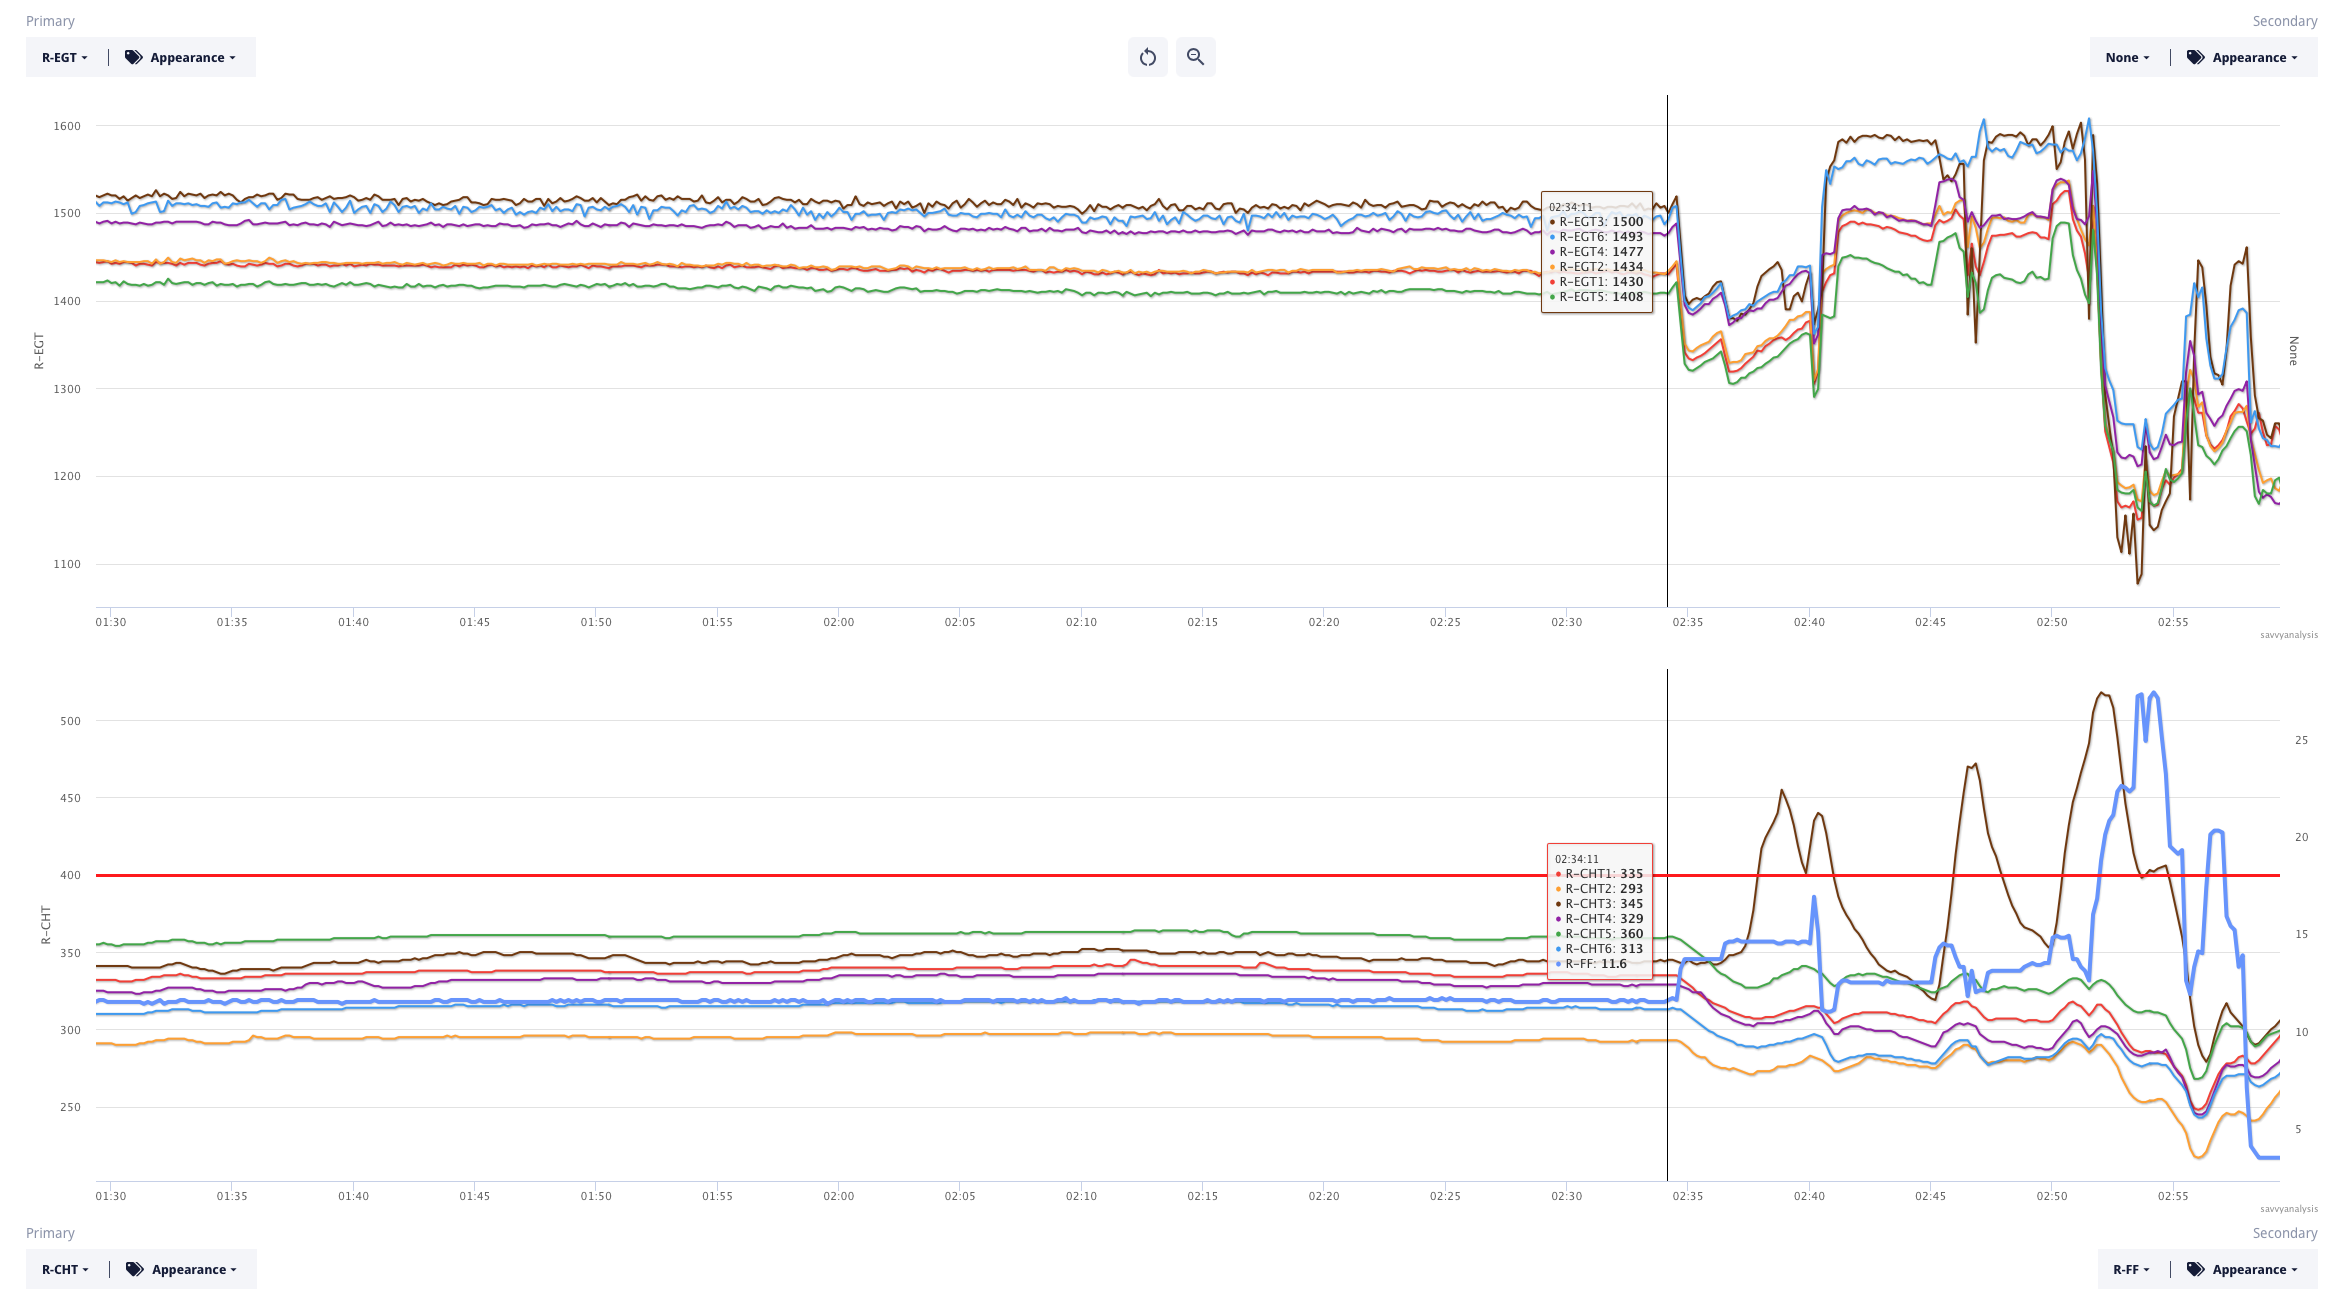
The cursor is on the top of descent out of 17,000 msl. Zoomed in we can see that R EGT 6 also has some chatter, and it climbs during the event with cyl 3, but CHT 6 doesn’t follow suit. Let’s turn our attention to cyl 3.
After cruising with FF at 11.6 GPH, the pilot adds FF for the descent, first a bump to 13.6, then another bump to 14.7 – and that’s where trouble starts. It’s about 3 mins to the right of the cursor. If you wanted a mental picture of runaway CHT, this is it. Our ∆/t tool calculates these runaways as 106º/min, 142º/min and 163º/min respectively. Often with detonation we see EGT peak first, then EGT drops as CHT quickly rises. That doesn’t happen here.
On the first of the three events, EGT rises a little, then drops, then jumps from 1400º to 1600º in a flash. Could the pilot have prevented the second and third CHT excursion by an aggressive move with FF – full rich or close to it ? We’ll never know. FF comes in heavy when it comes, and may have prevented a fourth excursion.
