Strong passwords, frequently changed passwords, biometric scans and two factor authentication are some of the technologies developed to keep information accessible to those who should have it, and away from those who shouldn’t. Every time I have to track down my phone to fetch a number and type it into a webpage, I remind myself what a small price that is compared to recovering from a data hack.
When I train a new engine data analyst, we spend a lot of time on authenticating the data. Is it friend? – useful data that will help engine performance or diagnostics – or foe? – data that will distract and confuse and perhaps fixate. In the quiet of analysis we can usually find data to cross-reference and compare. That’s harder to do with a handful of airplane, but knowing what to look for makes it easier.
While the majority of Savvy’s analysis work detects mixture distribution problems and weak spark plugs, we sometimes get data from unusual events. Let’s start with a static runup from a Cirrus SR22 with a Continental IO-550-N engine and data from an Avidyne with a 6 sec sample rate. EGT on top, FF and MAP below that, and oil pressure and RPMs below that. First, some context.
This is a little over a minute of data just after engine start. The airplane had flown into this airport a few days earlier without incident. On engine start for the trip home, the R mag ran rough during the preflight runup. The pilot taxied back, then contacted an FBO to report the problem. This is the runup on the shop’s ramp.
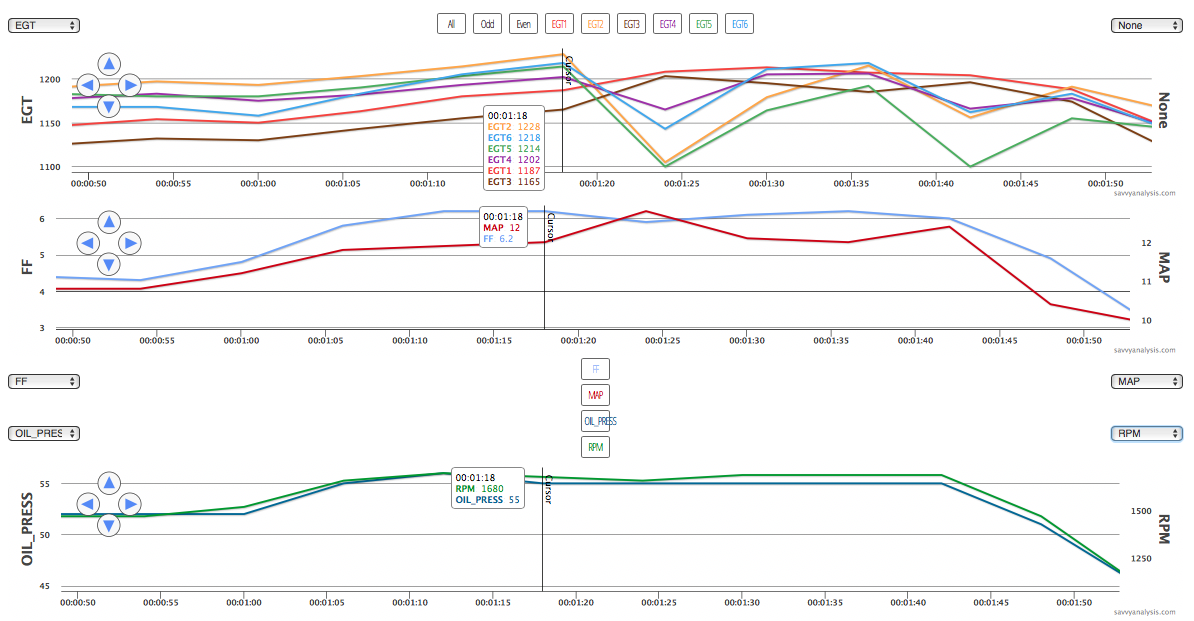
After a minute of idling, at the 00:01:00 mark, FF, MAP and RPMs rise for the runup. Those are commanded – oil pressure rises a little too, uncommanded. R mag is checked first and EGTs rise a little as expected. The cursor is on the switch from R to L mag. EGTs 2 and 5 fall a lot, 4 and 6 a little less, while 1 and 3 keep rising. You might be thinking what we thought, that the drops must correlate to the firing order of this engine. Not exactly – the firing order is 1-6-3-2-5-4. At 1680 RPMs the plugs are firing 28 revs per sec, so the Avidyne is taking a sample every 168 revs. We’d need much more precise sampling to be able to see each plug drop off.
FF drops a little because the drop in power effects the engine-driven pump. MAP rises just as it would if we leaned the engine until it quit. RPMs and oil pressure are steady. The data seems to point to the L mag, except if the mag completely failed, why didn’t EGTs 1 and 3 fall with the others? When the shop pulled the L mag they found a crack in the distributor rotor that would account for a slightly different effect on different cylinders. They tried repairing the parts but in the end changed out the mag, which solved the problem.
Next up is another Cirrus SR22, this one with a Continental IO-550-TN with a Tornado Alley turbo and data from a Garmin Perspective with a 1 sec sample rate. Here’s the entire flight – just short of 4 hours.

Here’s the same data zoomed in to about 20 mins during the approach segment of the flight.
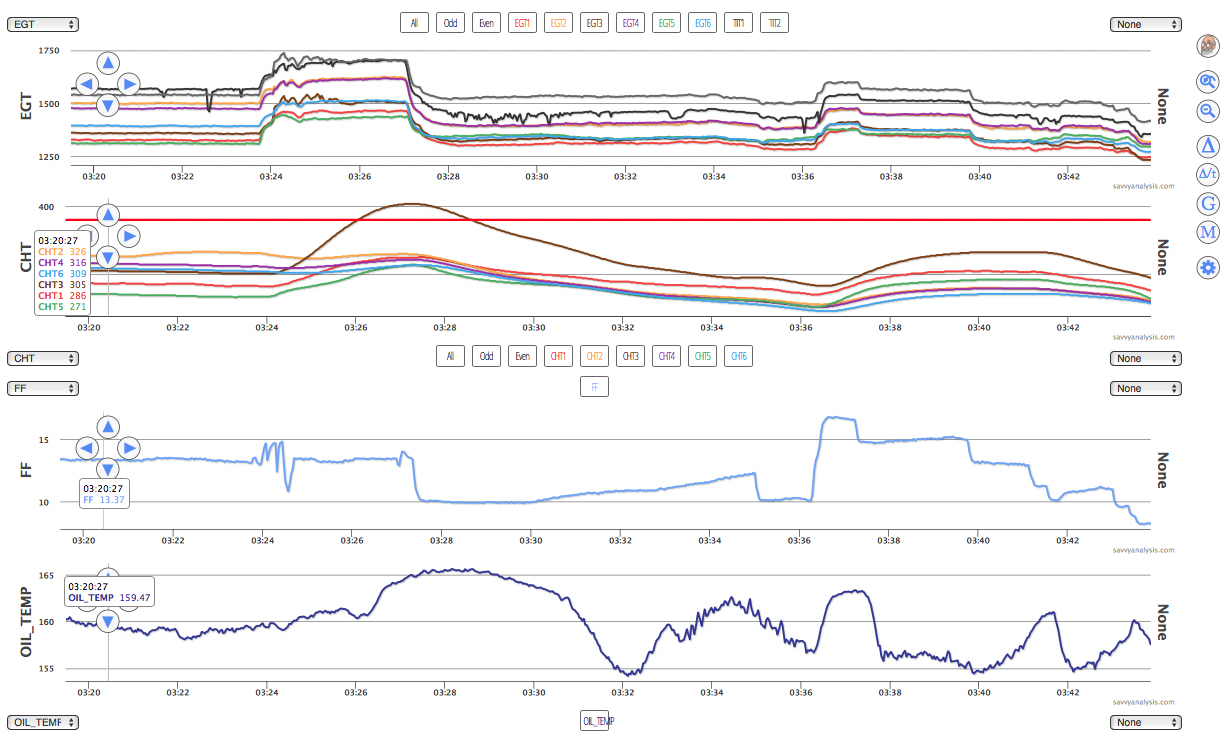
All’s well until 03:24 when there’s a brief wobble in FF, then all EGTs and both TITs rise. CHT 3 begins an excursion to just over 400º, and other CHTs rise a little. FF, RPMs and MAP are all steady until the pilot reduces power about 3 mins into the event. Meanwhile, the EGTs which had been jittery right after the rise smooth out, because the pilot switches from BOTH mags to L mag only. And just when the engine smooths out, CHT 3 takes off. Looking back to the full flight graph, EGT 3 and CHT 3 are both in the pack in cruise – no sign that the cylinder is about to heat up dramatically.
Fortunately, the big power reduction right at the CHT 3 peak changes the dynamic and CHT 3 starts to fall and dissipate the extra heat. We think it was probably a detonation event getting started, but peak CHT was only just over 400º. In any case, the power reduction ended it.
When the flight ended, the shop determined that the L mag had failed in flight, replaced the mag and the engine ran smooth again.
It’s not an all-Cirrus month, but I do have one more as we examine two powerplant management scenarios. This is a mag check from a different Cirrus SR22 with a Continental IO-550-TN with a Tornado Alley turbo and data from a Garmin Perspective with a 1 sec sample rate. Here’s the full flight.
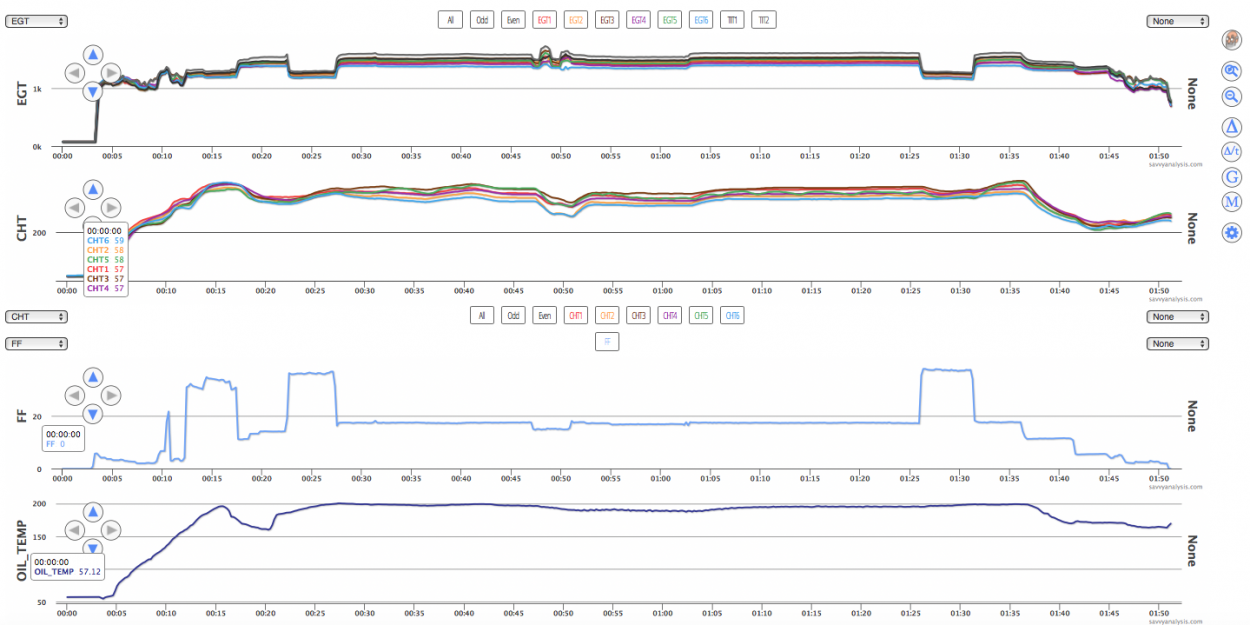
The inflight mag check happens at about the 48 min mark. Here’s the same data zoomed in to the mag check, and using our mag display tool – the letter M in the vertical tool panel.
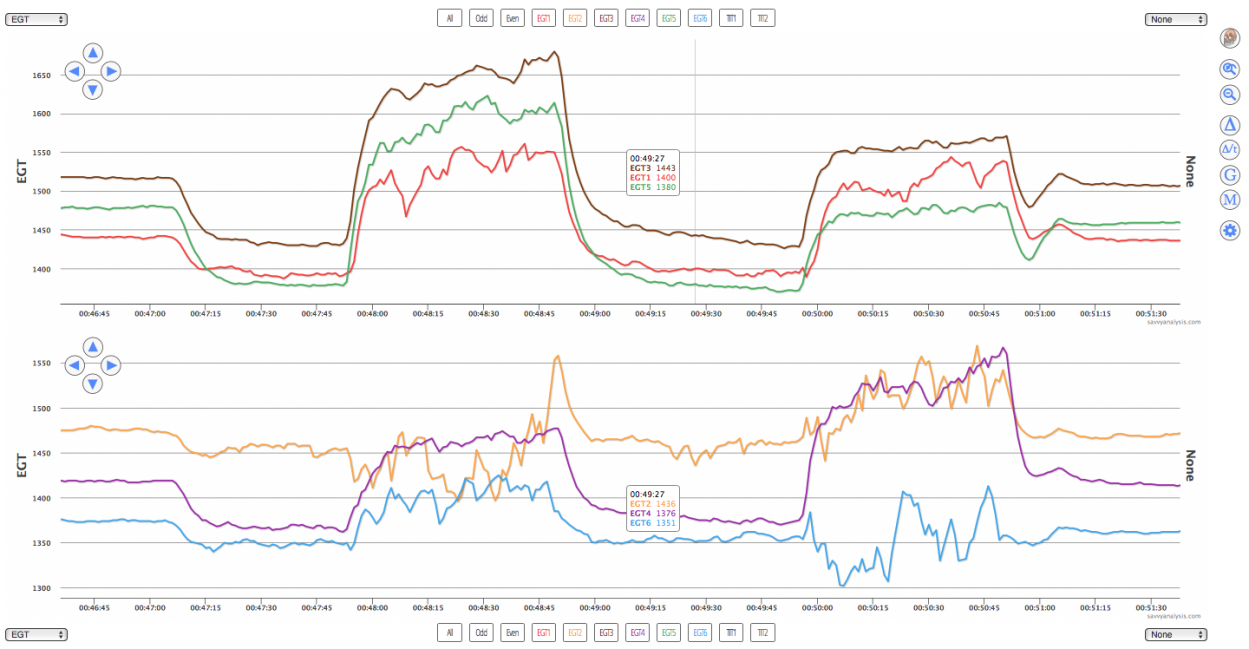
L mag is first, firing the bottom plugs of 1-3-5 and the tops of 2-4-6. Do you agree that we should inspect the top and bottom plugs of cyls 1, 2 and 6 – but the others look ok ? Or does it seem improbable that 6 of the 12 plugs are bad and maybe we should look for that second factor of authentication ?
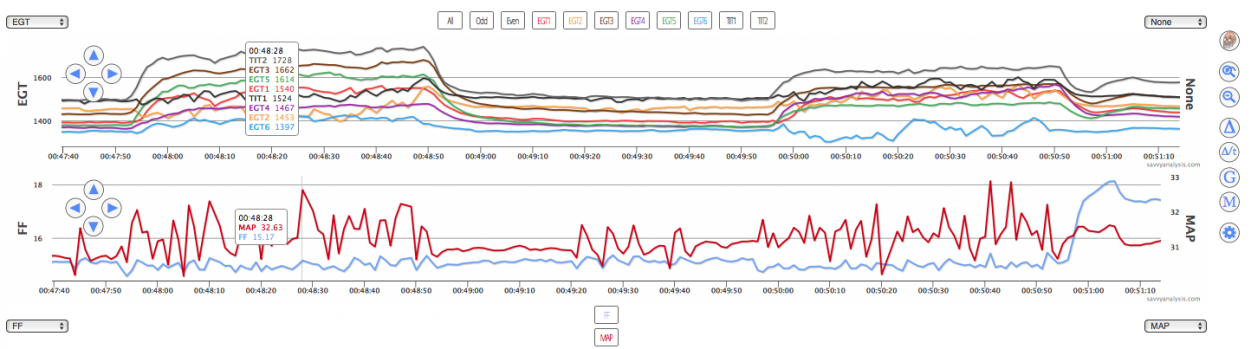
Here’s the same mag check. All EGTs are on top now, with FF and MAP below. FF is about 15.5 GPH, barely – if at all – lean of peak. More problematic is MAP, which when peaking at 32.6″ is over Tornado Alley’s redline. Average MAP for the flight was about 31″. RPMs (not depicted) are about 2500. Our recommendation for the LOP mag check is 65% power or lower. We’re trying to unmask and identify weak spark, not creating a condition which would cause it.
We’ll finish this month with data from a Cessna 210 with a Continental TSIO-520-C and data from a JPI 700 with a 2 sec sample rate. The context is the plane got a top overhaul because inspection showed low compression due to worn exhaust valves and guides. After a few hundred hours one of the partners landed gear-up, and the ensuing inspection again showed low compression due to worn exhaust valves and guides on all cylinders. Our client wanted to know if the data could explain the early failure.
EGTs are on top, CHTs below that and FF below that. RPMs and MAP are not logged.
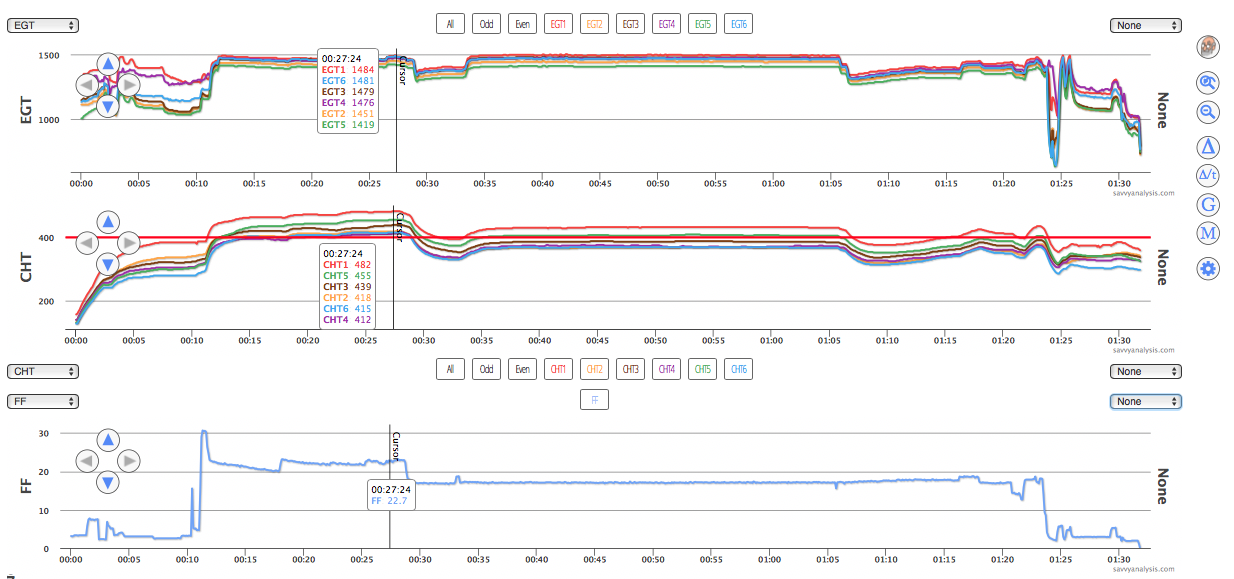
Starting on the far left, CHT 1 has a different heating profile than the others. It starts high and stays high. Until we find out, we might suspect this cyl is using a piggy-back spark plug probe and just reading 30º or so high. EGT 1 is high throughout – regardless of FF – so it doesn’t appear to be a mixture issue. CHTs 1-3-5 are higher than 2-4-6, which could suggest an induction leak, but EGTs don’t reflect that. Maybe there’s a cooling problem with cyl 1.
But as bad as CHT 1 is, the others are too high as well. MAP isn’t logged, but we’d guess that takeoff is at full FF, RPM and MAP, then as soon as the wheels are in the well (or whatever you call them on a 210) the pilot brings fuel flow way down. Let’s give the benefit of the doubt and assume RPMs and MAP are reduced from max to the allowable limits for climb. Let’s also give the benefit of the doubt and assume the pilot’s bringing FF down in an attempt to bring those already-high CHTs down. If so, that didn’t work.
It’s interesting that at just after the 01:05 mark EGTs and CHTs drop, but FF doesn’t, and creeps slightly higher. We’re guessing that was a change in MAP. Whatever it was, CHTs liked it, at least for a short while.
Looking over months of data for this airplane, this was pretty much standard ops. There were lots of 15, 20 and 25 min climbs at these CHTs.
When I looked at the list of flights, almost all of them were flagged HI CHT, with the alert set at 410º. The alert is triggered when any CHT reaches that number at any point in the flight – whether because of real heat or bogus data. The analysis team does receive a message when flight data triggers a FEVA alert. But we don’t get a message when any of your flights triggers a HI CHT alert. We will, of course, spot it when we manually review your data for analysis, but in this engine’s case that was too late to help.
