A lot of analysis requests begin with “Something bad just happened and we had to divert and land. Is there something in the data that would’ve told us this was about to happen?” Our first reaction is usually relief – that the pilot got on the ground safely and is able to make the request. Then the forensics begin and we start looking through the data for clues. Sometimes the warning signs are obvious. January’s Puzzler tells the story of a 172 making a cross-country trip, with oil pressure dropping at every stop. Eventually the engine quit and the airplane landed in a field.
Sometimes the warning signs aren’t obvious, at least to the trained human eye. Savvy Ai is using machine learning to look for patterns and trends that elude detection using our current graphic depictions. Meanwhile, let’s look at some recent events and see what the data can tell us. You’ll notice a different look to the screenshots this month. I’m using the new beta version of the flight data page.
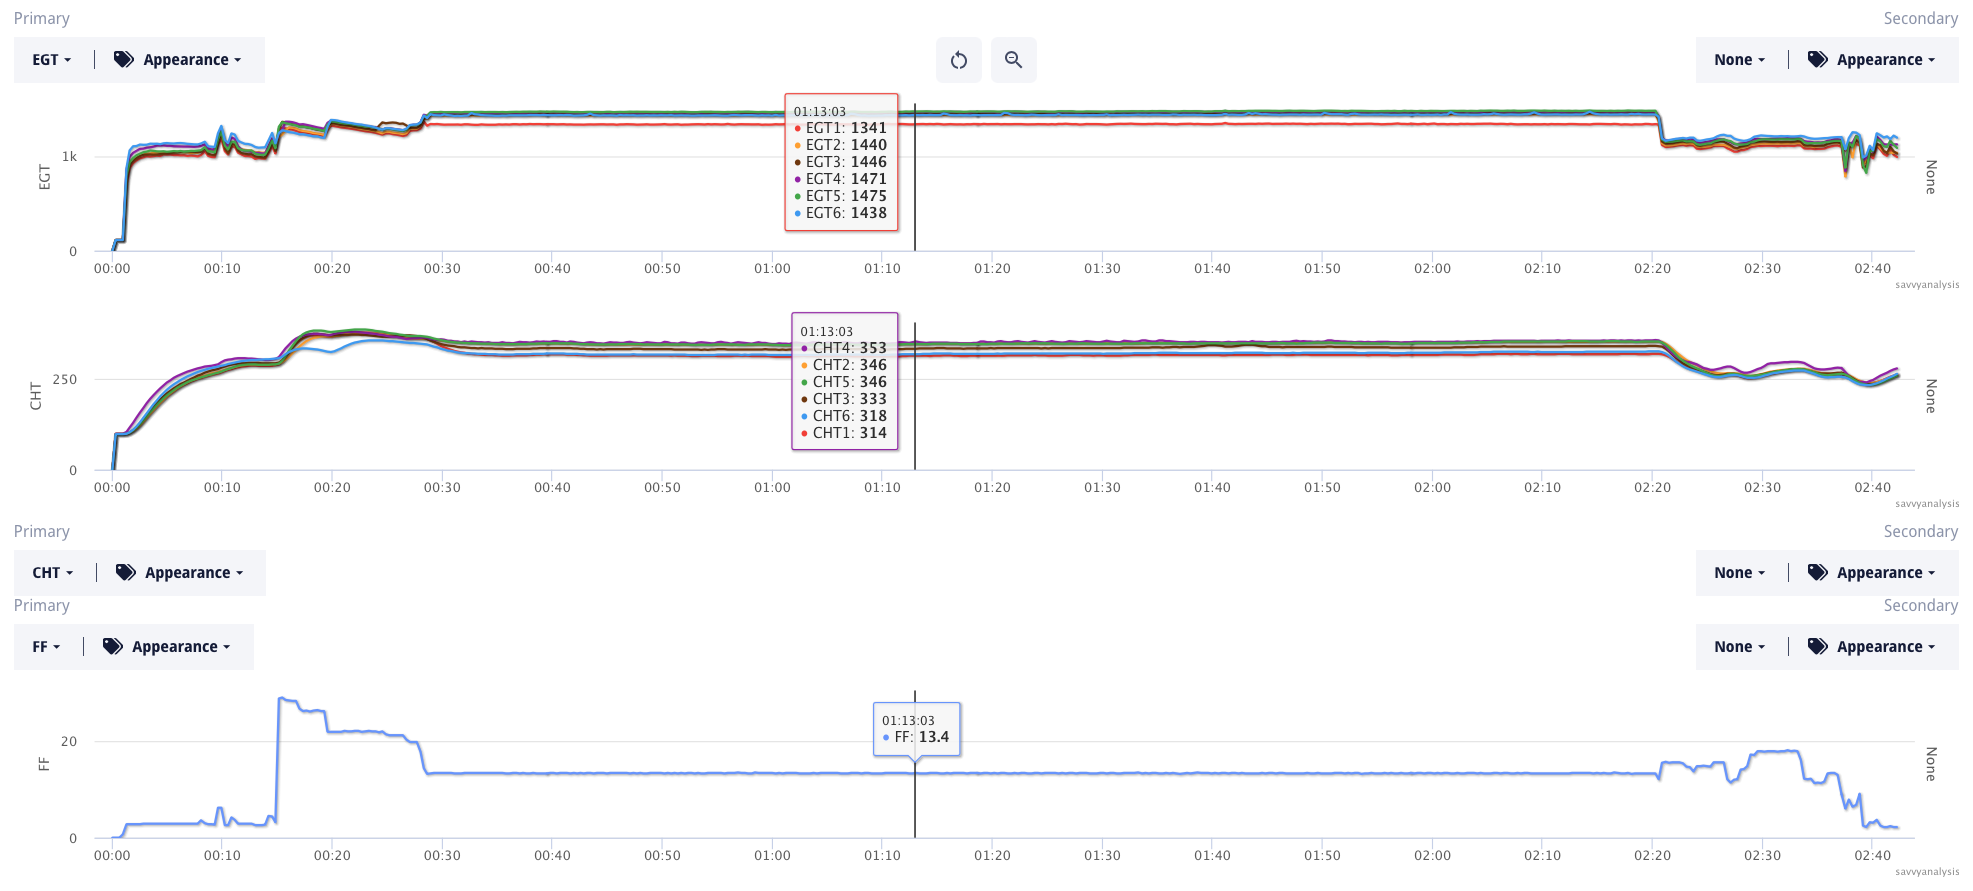
First up is a Cessna Turbo 206 powered by a Lycoming TIO–540 and data from a Garmin G1000 with a 1 sec sample rate. This is the flight before the event with EGTs, CHTs and FF.
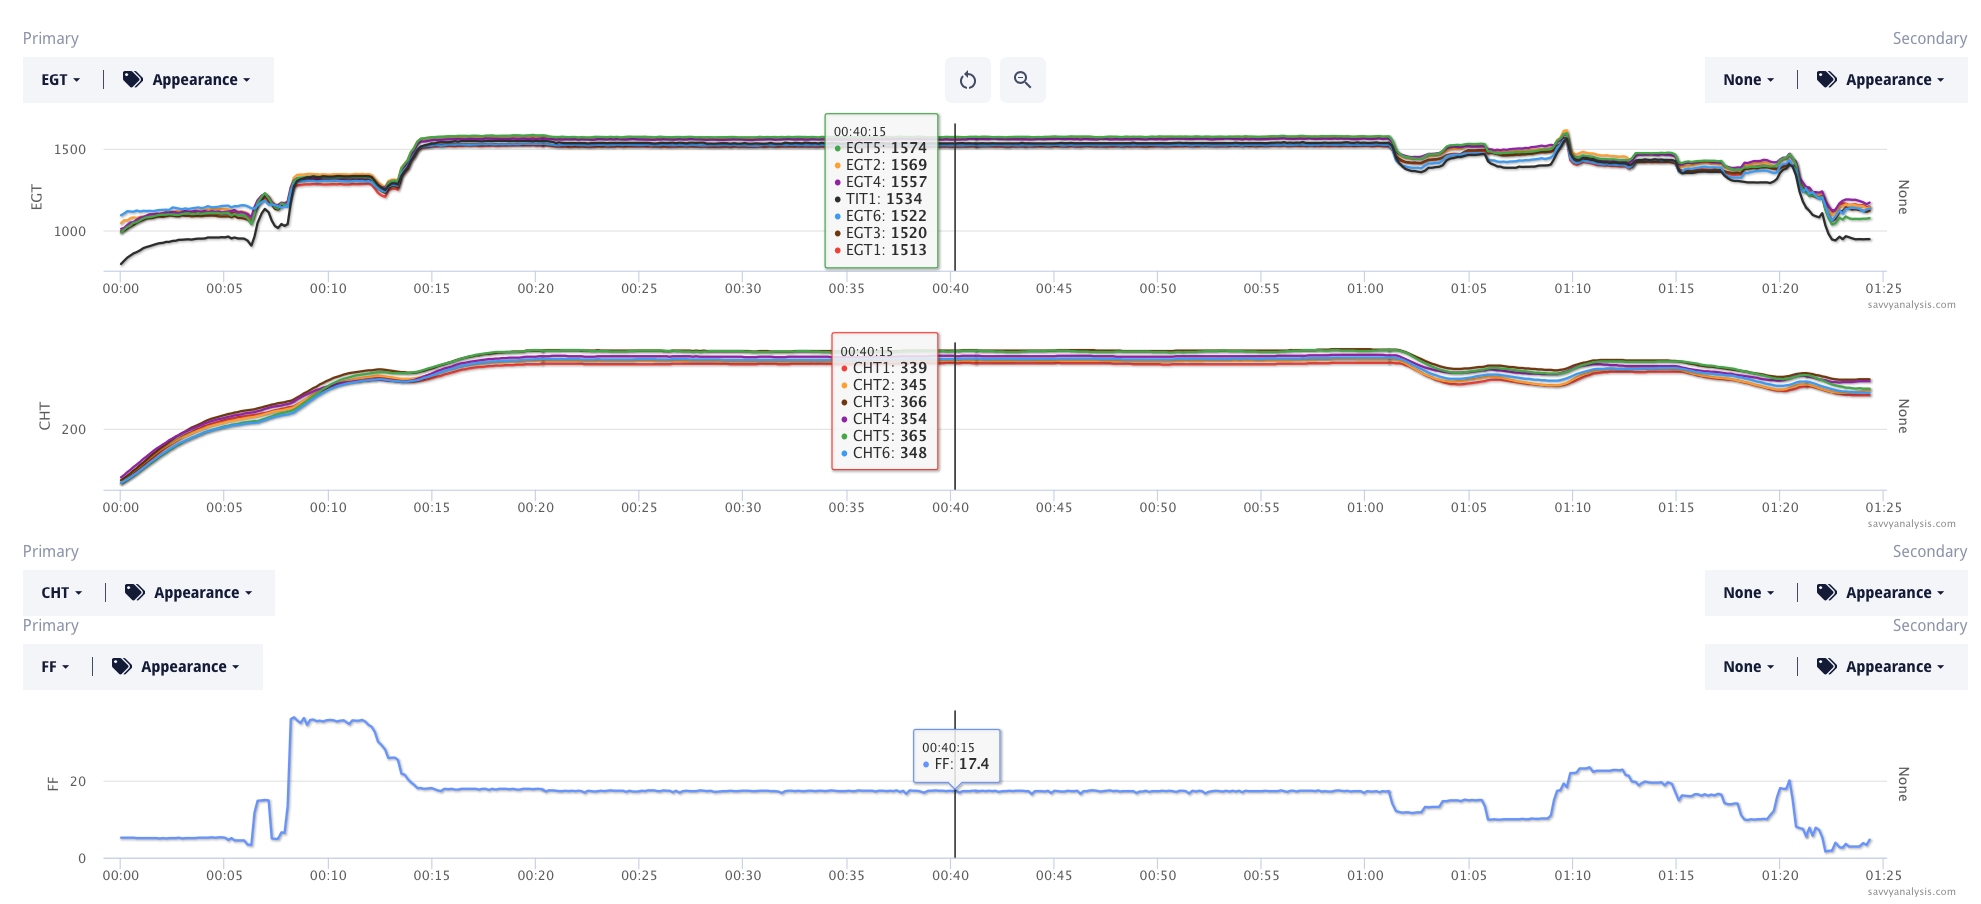
EGTs are stable and uniform in cruise and CHTs are in a good range – the 9º spread at the cursor indicates very uniform cooling. Cruise FF is 17.4 GPH which is too high to be LOP, but this ROP setting looks like it’s working well. Even knowing that something bad is about to happen, it doesn’t look like this data is trying to tell us about it.
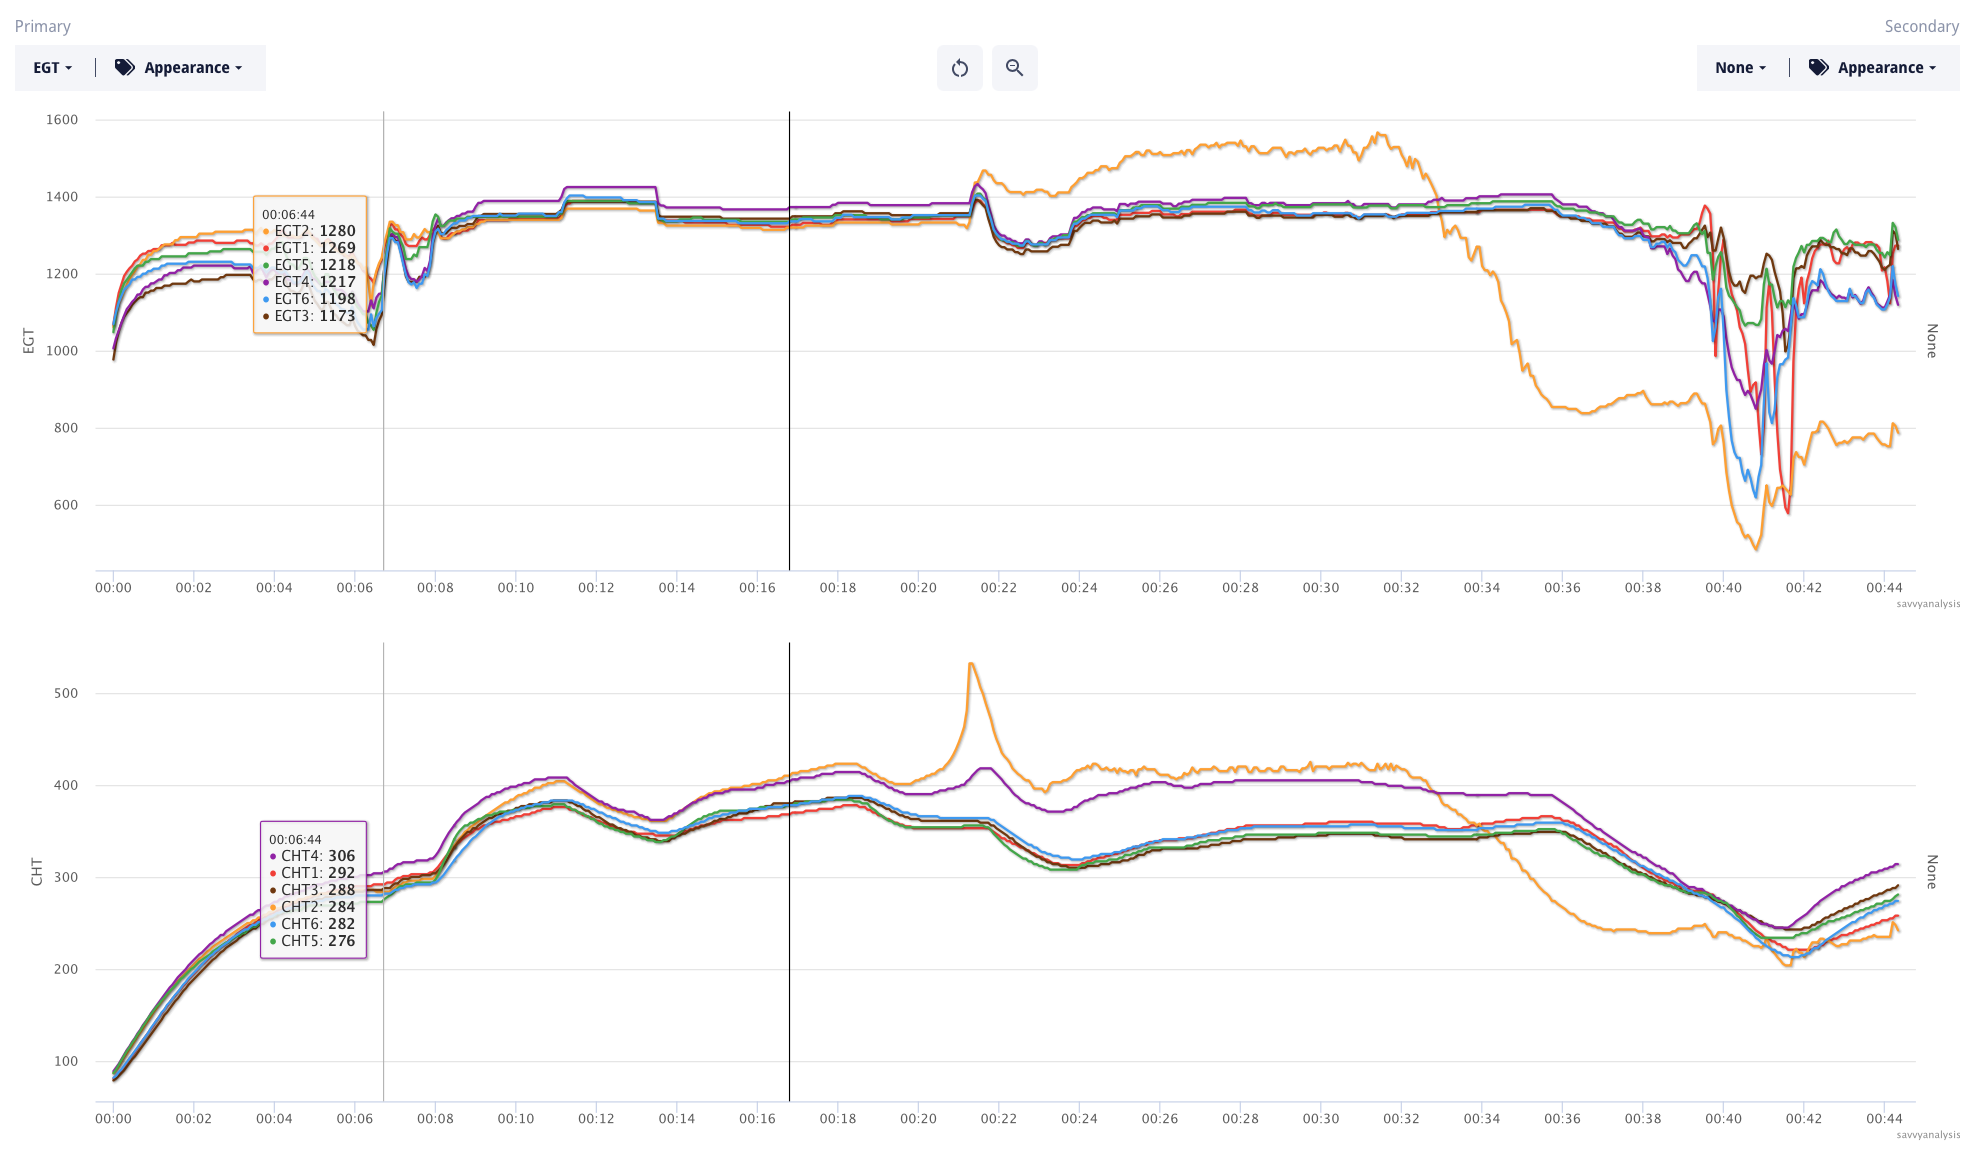
The airplane landed, sat on the ramp for about 5 hours, and here’s data from the return flight.
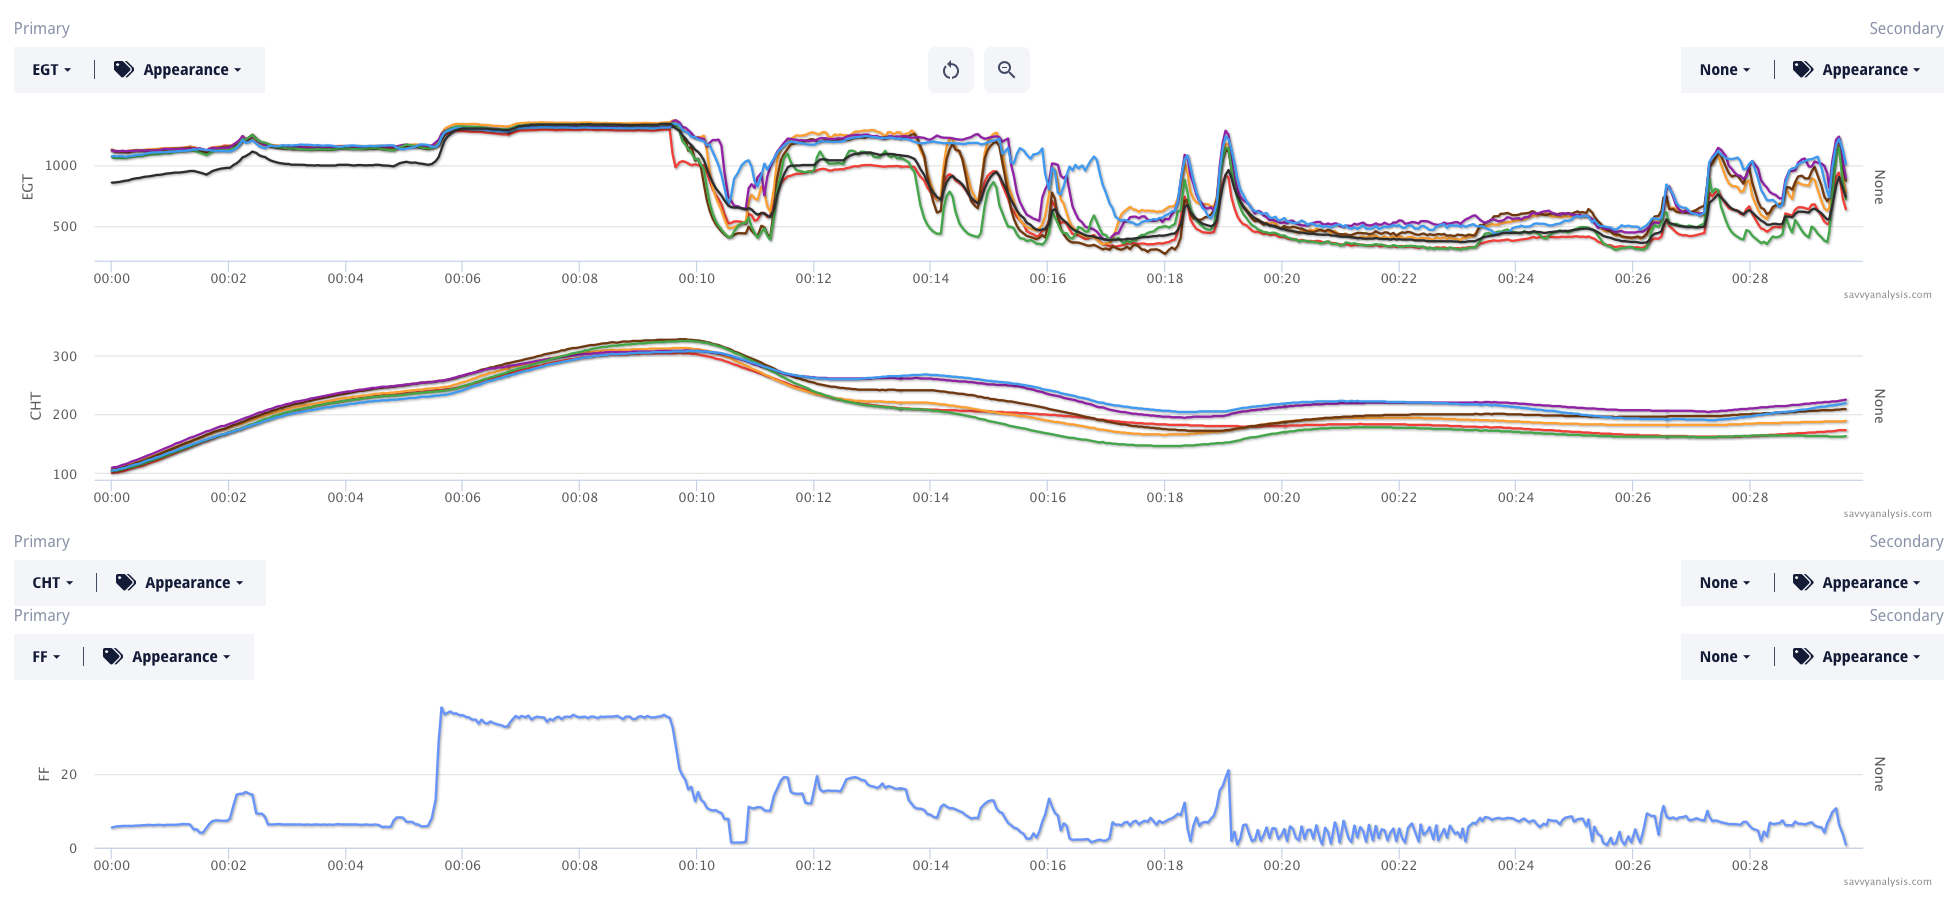
Takeoff is just before the 6 min mark in the timeline. About 4 mins later EGT 1 drops, then the pilot pulls power to idle. Because CHTs don’t tell us a lot, let’s look at EGTs, GPS ALT and FF, and zoom into the time in flight – from 6 to 16 mins in the timeline – with the cursor on the drop in EGT 1.
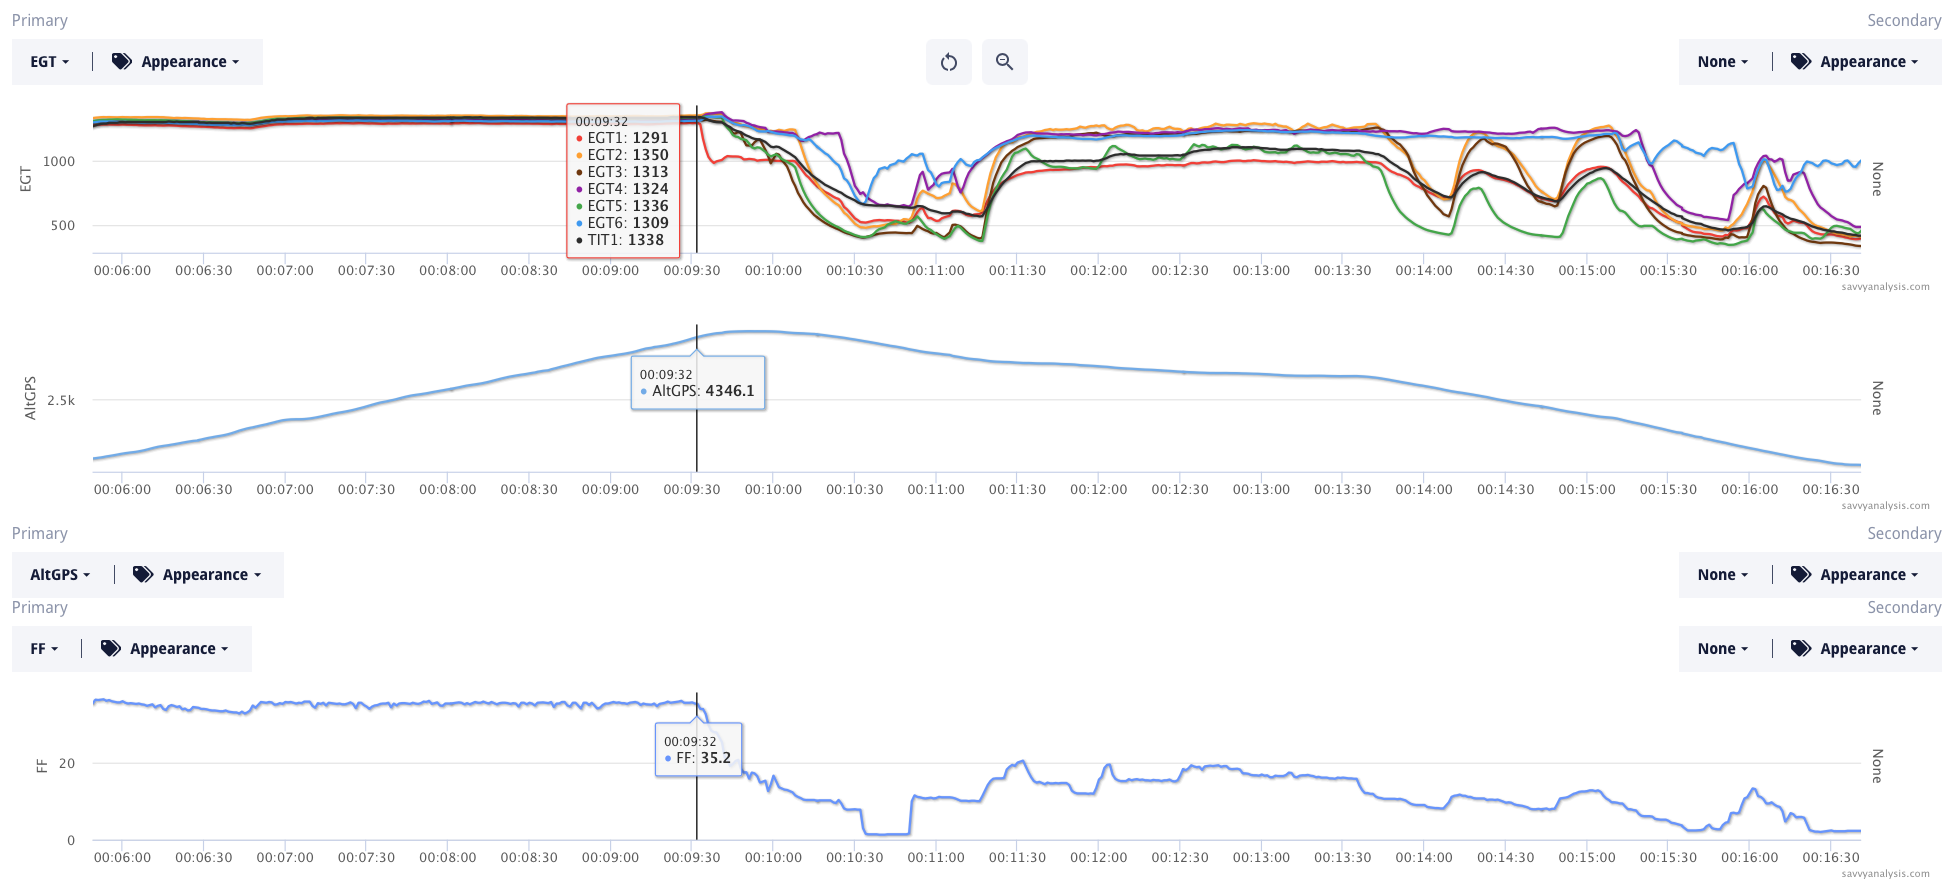
Not only does the data depict a serious engine problem, it depicts a well-trained pilot handling the emergency. Power gets pulled to try and reduce the shaking, as the nose comes up to try and conserve altitude and set up for best glide speed. At about 10:30 the pilot goes to idle power, and I think we can conclude from the EGTs that it didn’t really run better at idle than at partial power – so the pilot adds some power. At 11:30 EGTs 2-4-6 are all firing – not quite stable but not bad. EGTs 1 and 3 are not erratic, but they are lower, and 5 is lower and erratic.
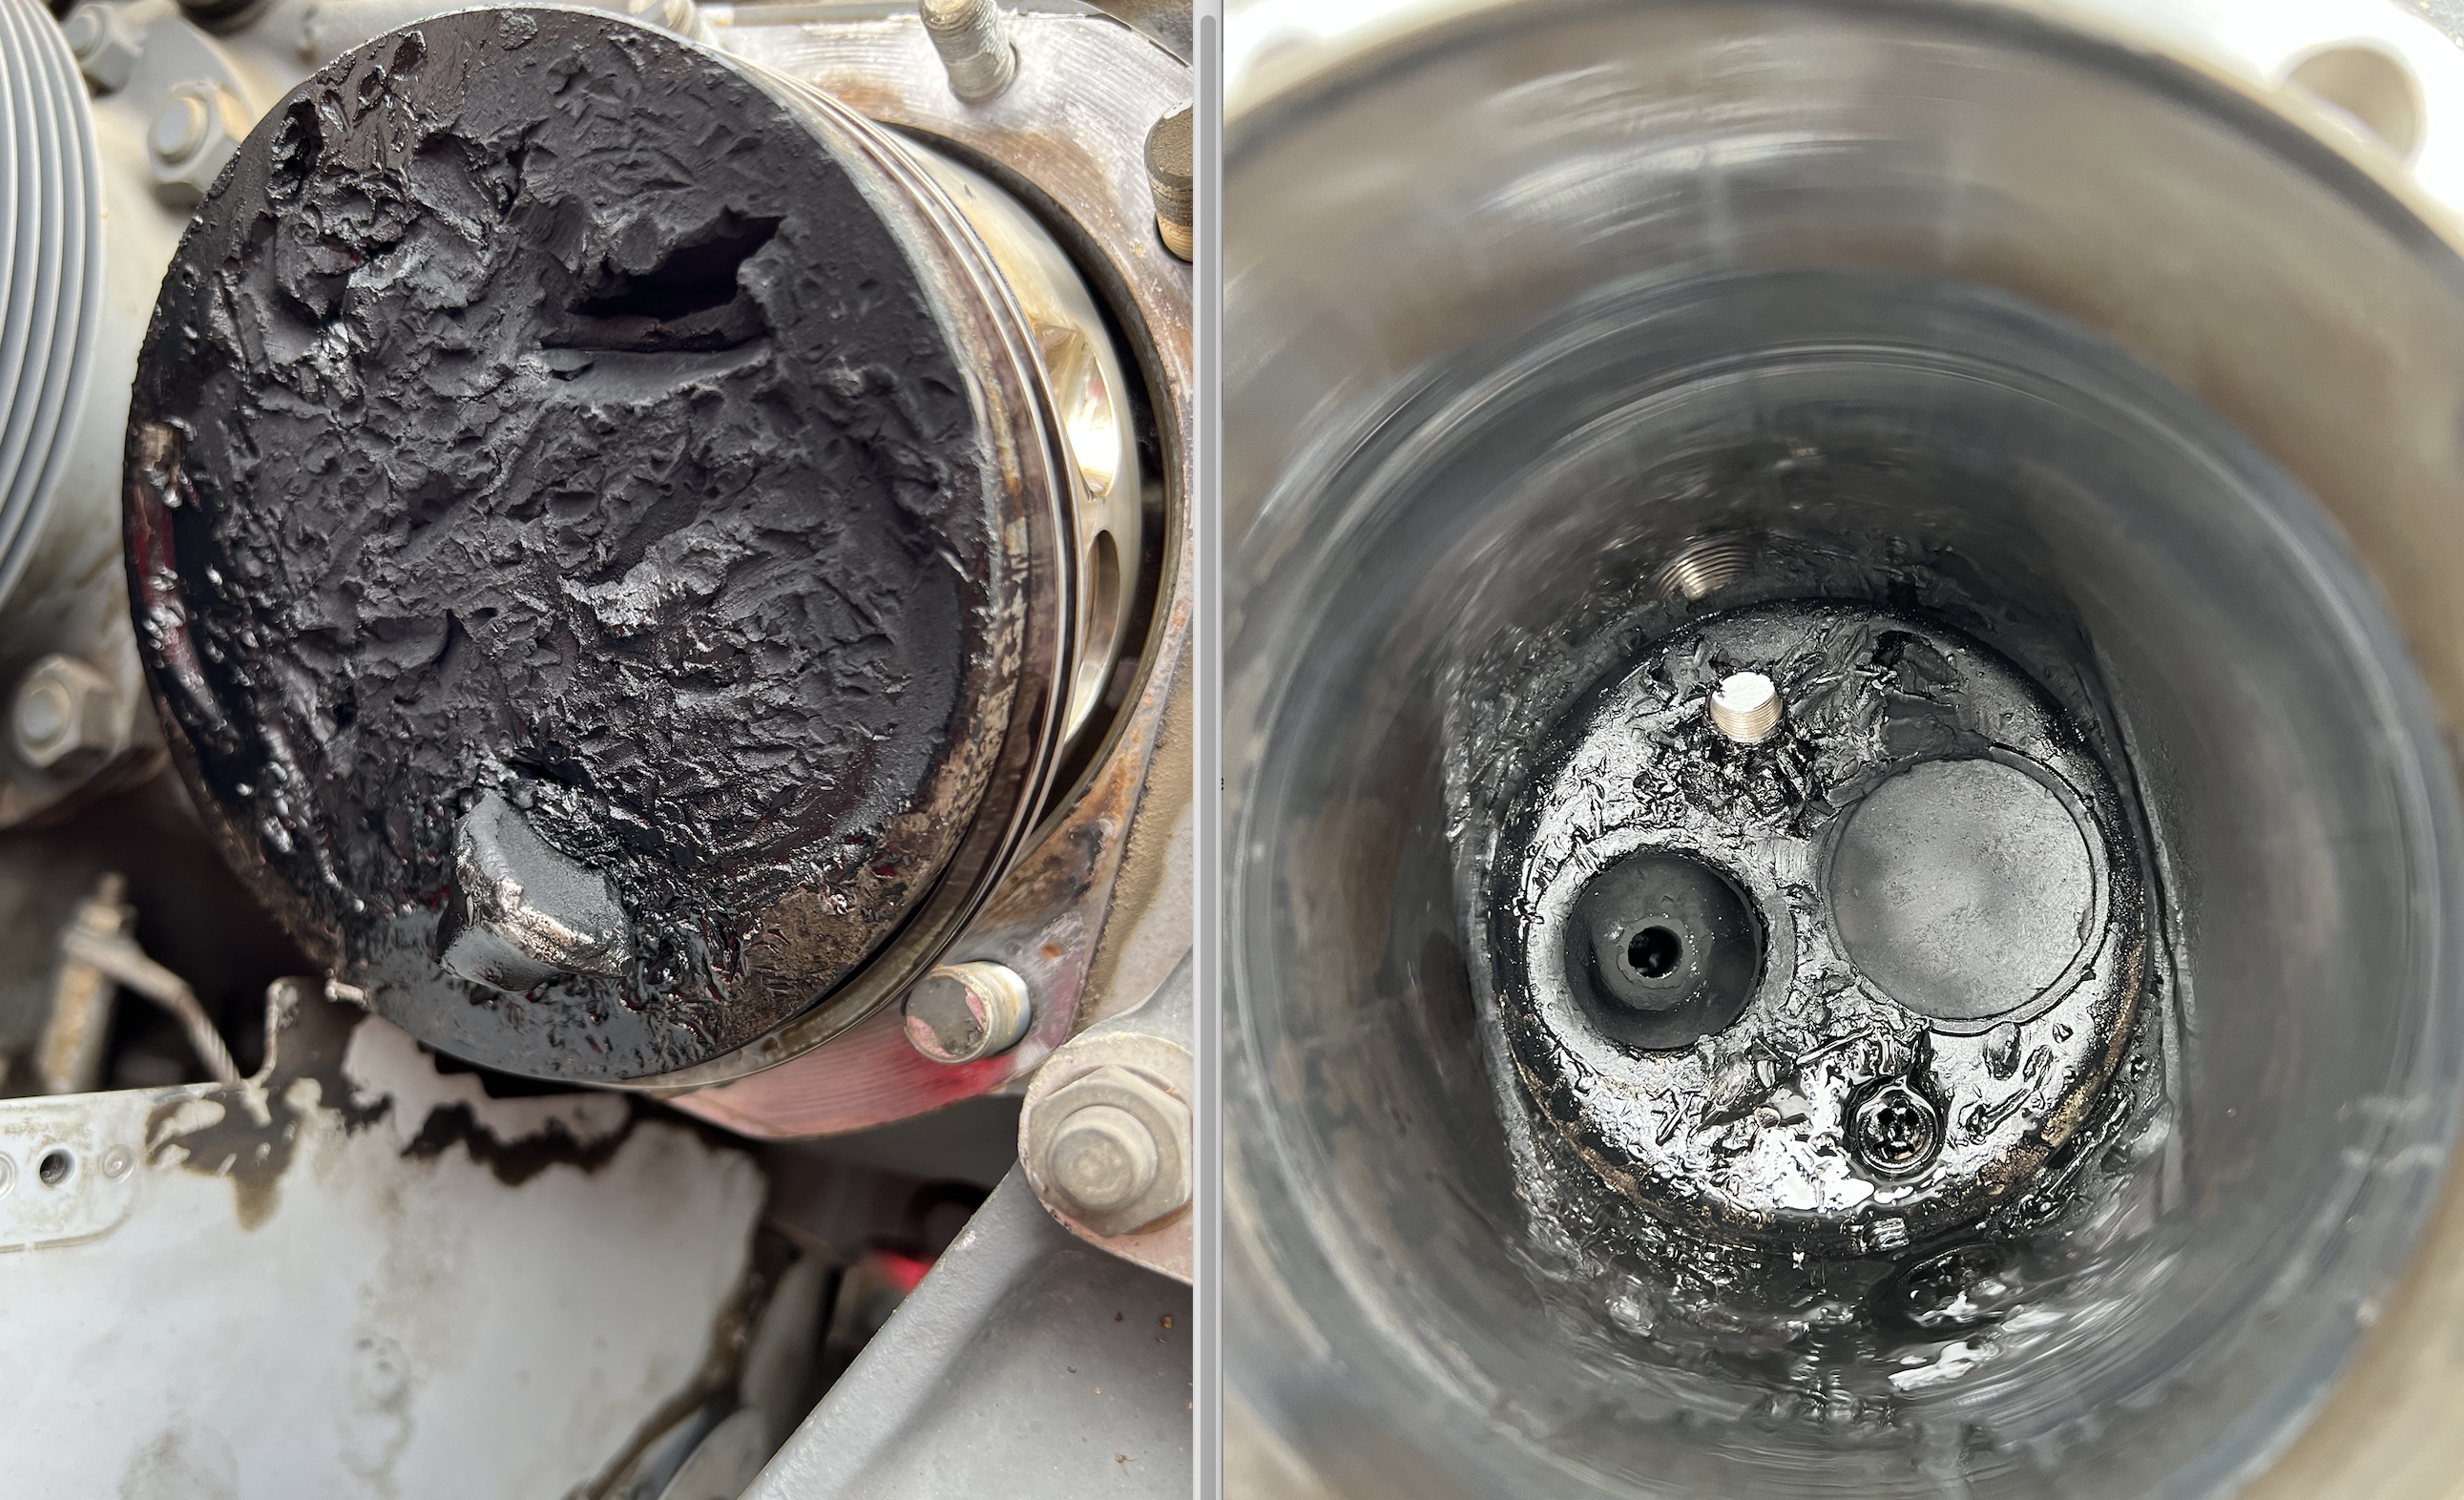
The first sign of trouble was a drop in EGT 1, and that turns out to be the source of the problem. One of the exhaust valve keepers failed, so the valve made its way into the barrel and here’s the result.
Next is data from a Cirrus SR 22 powered by a Continental IO-550 and data from a Garmin Perspective with a 1 sec sample rate. Here’s a typical cruise flight with EGTs, CHTs and FF.
Zoomed out, it’s hard to spot any warning signs. There’s a slight wavy pattern in one of the CHTs until about the 1:40 mark, then it goes away. Typically those are caused by a baffle that’s slightly loose and allowing pressure under the cowl to build then dissipate. Here’s the same data zoomed into the cruise segment with only EGTs depicted.
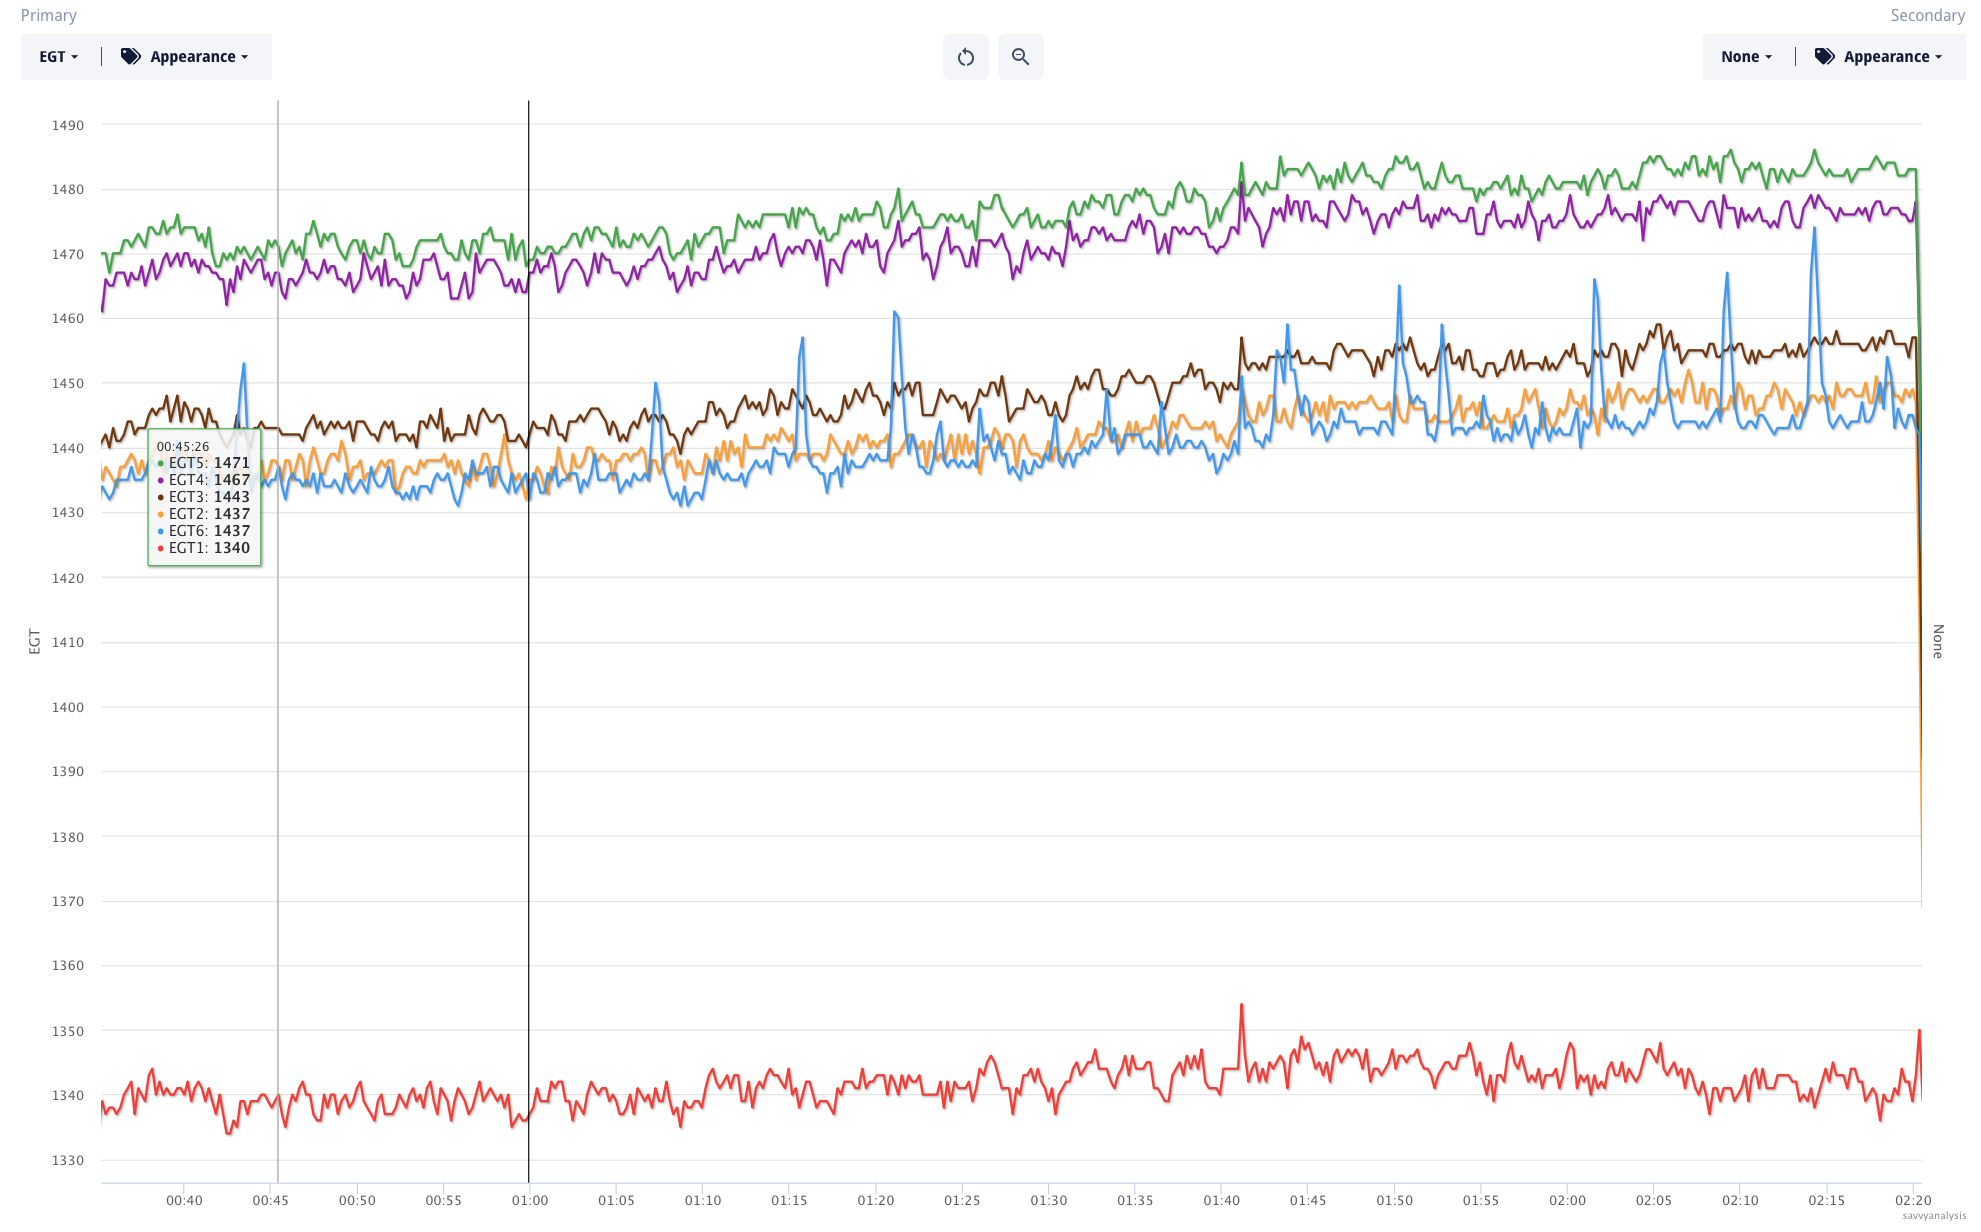
We have to figure out why EGT 1 is so much lower than the others, but let’s put a pin in that for the moment. Those spikes in EGT 6 almost look like electrical noise. They don’t have the shape of FEVA – the oscillating pattern of a burned exhaust valve turning in service. There’s a first time for everything, and this was a first for us.
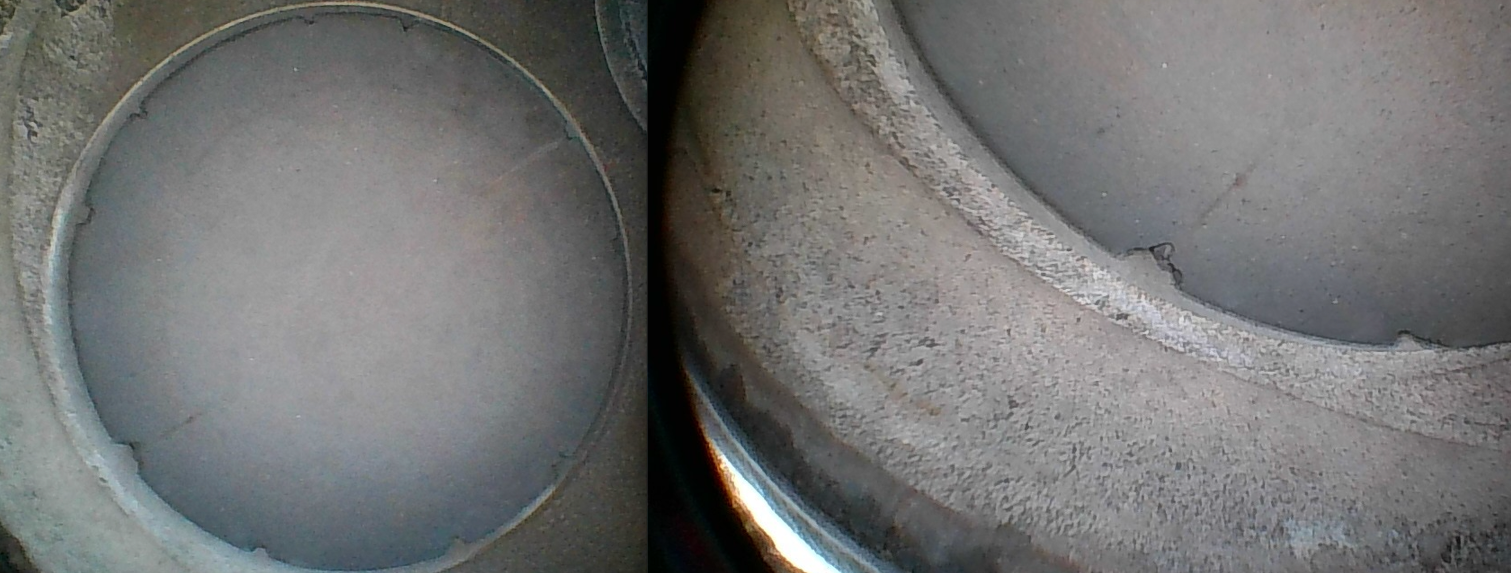
That’s the intake valve for cyl 6. Those chips are likely a result of FOD ingestion. By far, most of the trouble we see in EGT patterns is caused by plugs or the exhaust valve. An intake valve problem is rare. Would this valve have failed if not detected? Hard to say. Borescope inspection caught this one, but the data gave us warning signs.
Next is data from a Beech Bonanza 36 powered by Continental IO-550 and data from a JPI 700 with a 2 sec sample rate. This is the flight before the event with EGTs and CHTs. FF is not logged.
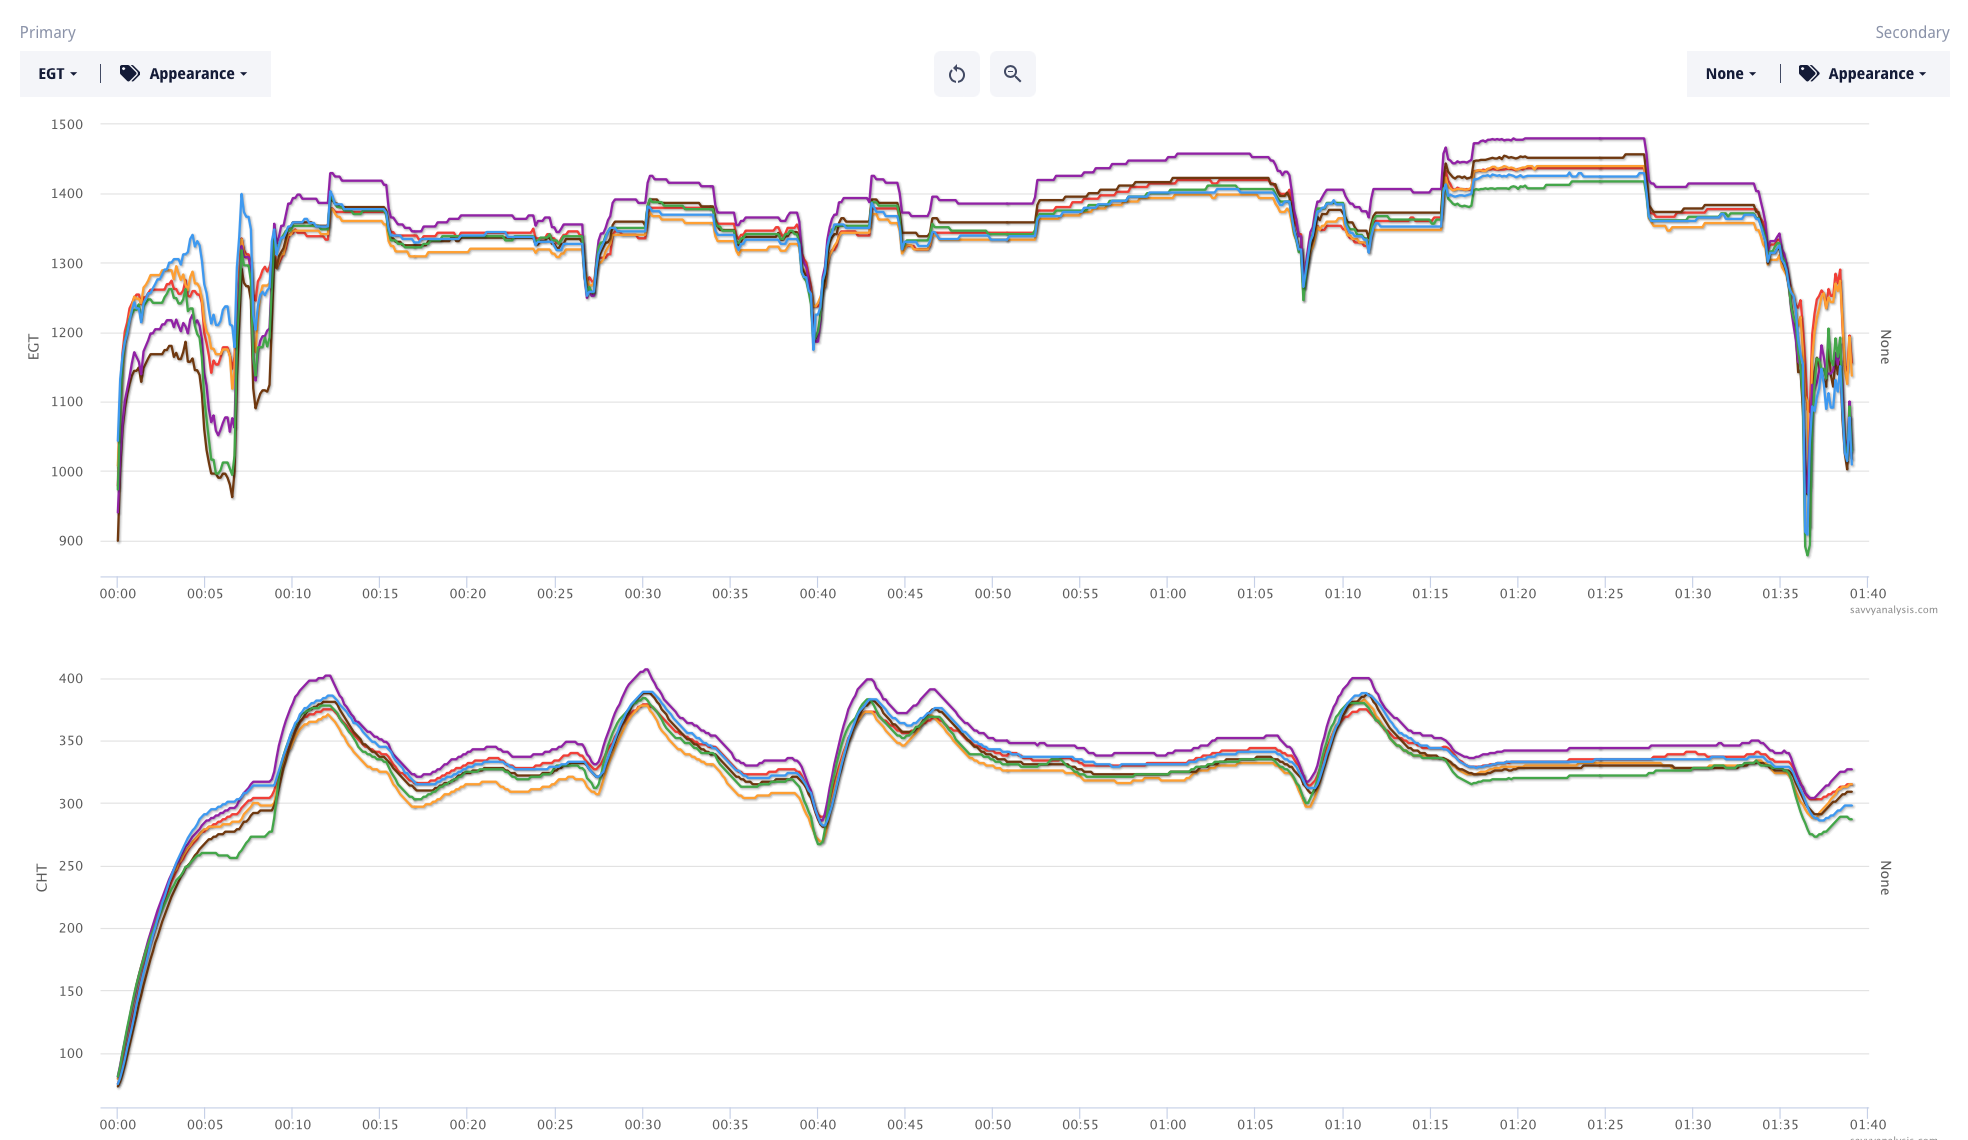
If there’s a warning sign here, it looks like it’s from cylinder 4. EGT and CHT are high throughout. even without FF logged, this looks like a takeoff and some missed approaches with climb outs at 30, 42 and 70 mins. Is there any concern with cyl 2 – EGT or CHT? Doesn’t look like it…
Here’s the next flight.
CHT 2 is a little high in initial climb, which we didn’t see in the previous flight. And it stays high until it makes its move at the 20 min mark. Is this detonation? The textbook detonation pattern is a quick rise in EGT – often from a cracked insulator on one of the plugs – then a steady rise in CHT to a peak, followed by a big drop in EGT after the CHT peak. That’s not what we see here.
(Here’s a textbook detonation event in the first puzzler from June of this year.)
We know from post-flight inspection that the cyl 2 barrel failed. Either the whole circumference was intact one minute then failed all at once – unlikely – or there was a small crack that eventually spread and culminated in what we see here – more likely. If there was a small crack, could that explain the higher EGT and CHT for its neighbor cyl 4 in recent flights? And the lower EGT and CHT for cyl 2, as the heat found an alternate means of escape?
It almost doesn’t seem fair that a warning sign for one cylinder should show up in the data for another cylinder, but we have to heed the warning signs wherever they happen to be.
