Flying is full of great and memorable sounds. I’ll never forget how quiet the cockpit was after lifting off for my first solo – compared to hours of hearing my CFI issue verbal corrections or way-to-gos. It was just the engine and the air. I can still remember the first time Rare Bear flew by at Reno with that giant P3 prop spinning at relatively low RPM – not only did you hear it, you could feel it in your solar plexus. And I still get a rush when I can hear three distinct wheel squeaks during landing – wish it happened more often.
My airplane was built in 1974. Five years before that, Led Zeppelin released their second album, with Whole Lotta Love. It took a lot of guts for the first song on the first side to play for a while, then grind to a halt, throw tons of slap-echo on the vocal – hit two big chords and a drum fill, and jump back in for a big finish. It’s on several playlists of mine, and when I see engine data that looks like CHTs are hot because of baffles and seals – as opposed to running lean – it triggers the ear worm of Robert Plant intoning You Need Coolin’ Baby I’m Not Foolin’.
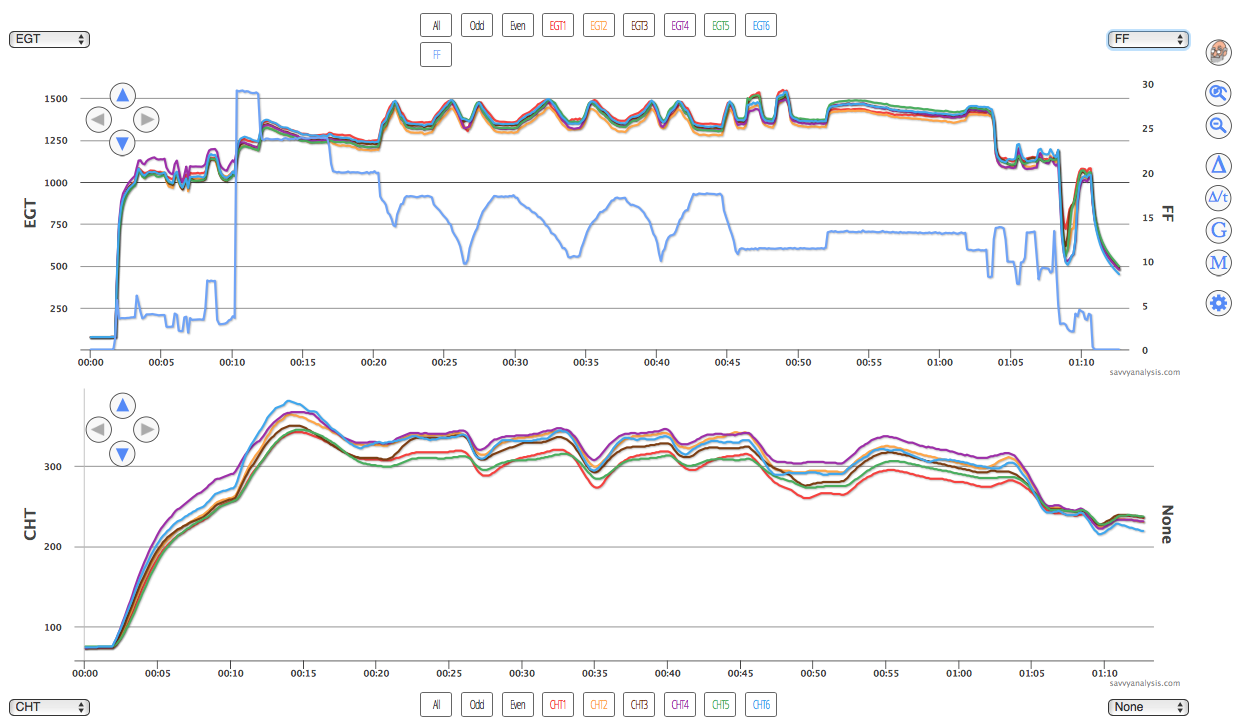
Let’s start this month with data from a Cirrus SR-22 with a Continental IO-550-N and data from a Garmin Perspective with a 1 sec sample rate. Fuel Flow is the blue line in the top graph.
Here’s the same data zoomed in to the mixture sweeps and mag check from about 20 to about 50 mins.
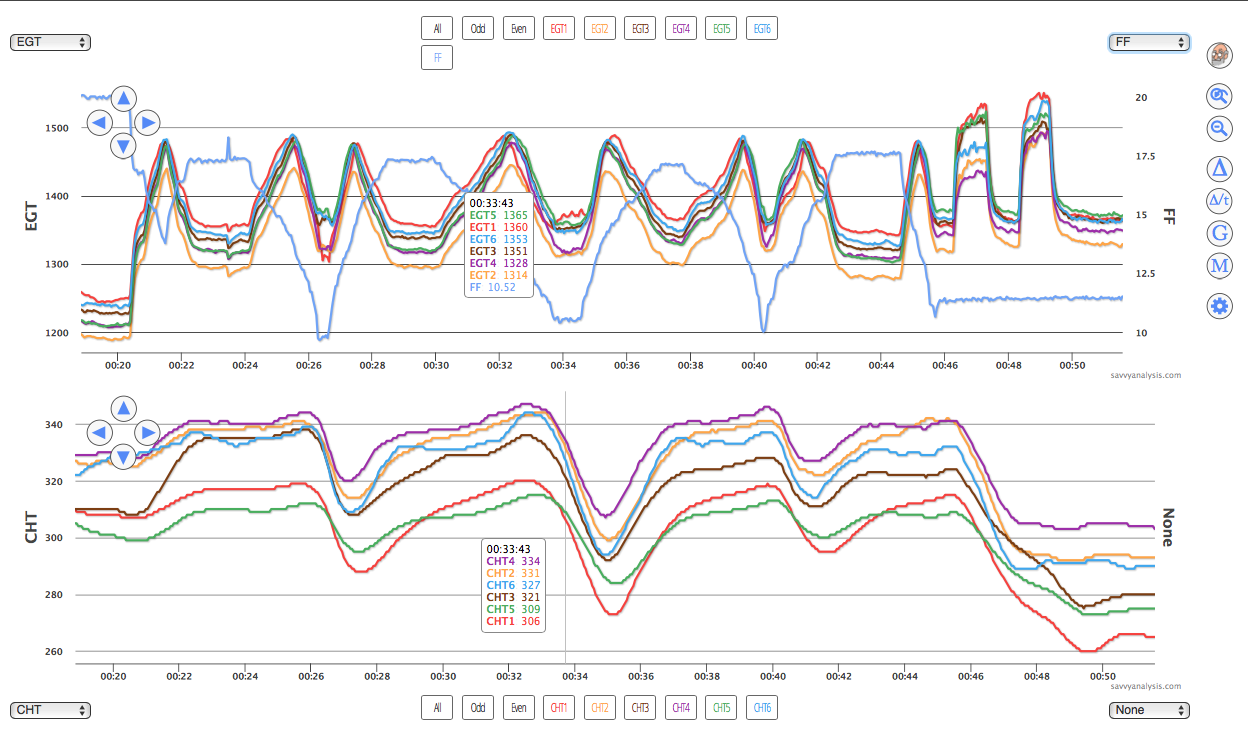
And here is the mixture distribution spread from one of the sweeps.
Time: 00:30:37-00:33:34
EGT1 peaked at 14.06
EGT6 peaked at 13.87
EGT2 peaked at 13.74
EGT5 peaked at 13.71
EGT3 peaked at 13.68
EGT4 peaked at 13.64
GAMI spread is 0.4
Zoomed in or not, it’s pretty clear that CHTs 2-4-6 are hotter than 1 and 5, at all power settings. CHT 3 is closer to the odds at takeoff – at max FF – then moves closer to the evens as the mixture is leaned. Let’s come back to 3 and deal with 2-4-6 first. What’s causing them to run hot? Is it mixture, which could be either fuel or induction, is it spark, or is it cooling? EGTs 2-4-6 are not high, so no evidence to support a lean mixture from either fuel or an induction leak, and the 1-6-2-5-3-4 rank in the spread data corroborates that. This looks like the evens are not getting as much cooling as the odds, or at least 1 and 5. So our recommendation would be to check the baffles and seals for the evens. There’s no evidence to support pulling and cleaning injectors or plugs – keep that money in your pocket.
Now let’s tackle CHT 3. This may take some detective work. Referencing the FF scale on the R side Y axis, CHT 3 travels with 1 and 5 until FF drops below 20, then it’s in the gap between 2-4-6 and 1-5. Must be fuel-related then, right? Except that the mixture spread data shows it’s not lean, it’s closer to richest. What else changes when FF goes from the 20-30 GPH range to the 10-15 GPH range? Speed.
This looks like a case where the cooling isn’t optimal on cyl 3, but at higher fuel flows – and because it’s second-richest in the mixture spread – it’s getting enough fuel to make up for it. Then when FF drops, the cooling problem is unmasked. Admittedly, there’s some dot-connecting and conclusion-jumping here, but that’s what the data suggest. Further complicating the issue, see how CHTs all converge again when the airplane slows for landing? And they were pretty well grouped after engine start during ground ops, except for EGT/CHT 4 – the purple traces – which suggest a slight injector clog that clears itself by takeoff.
If the CHT spread is small during ground ops and wide in flight, that suggests a cooling issue that exists with 100+ knots of wind but may not be loose to the touch on the ground. So in addition to checking the evens, let’s add the inter-cylinder baffles for cyl 3, which could be loose enough to flex in flight and redistribute the air meant for cyl 3 to its neighbors.
Here’s data from a different Cirrus SR-22 with a Continental IO-550-N and data from an Avidyne 5000 with a 6 sec sample rate.
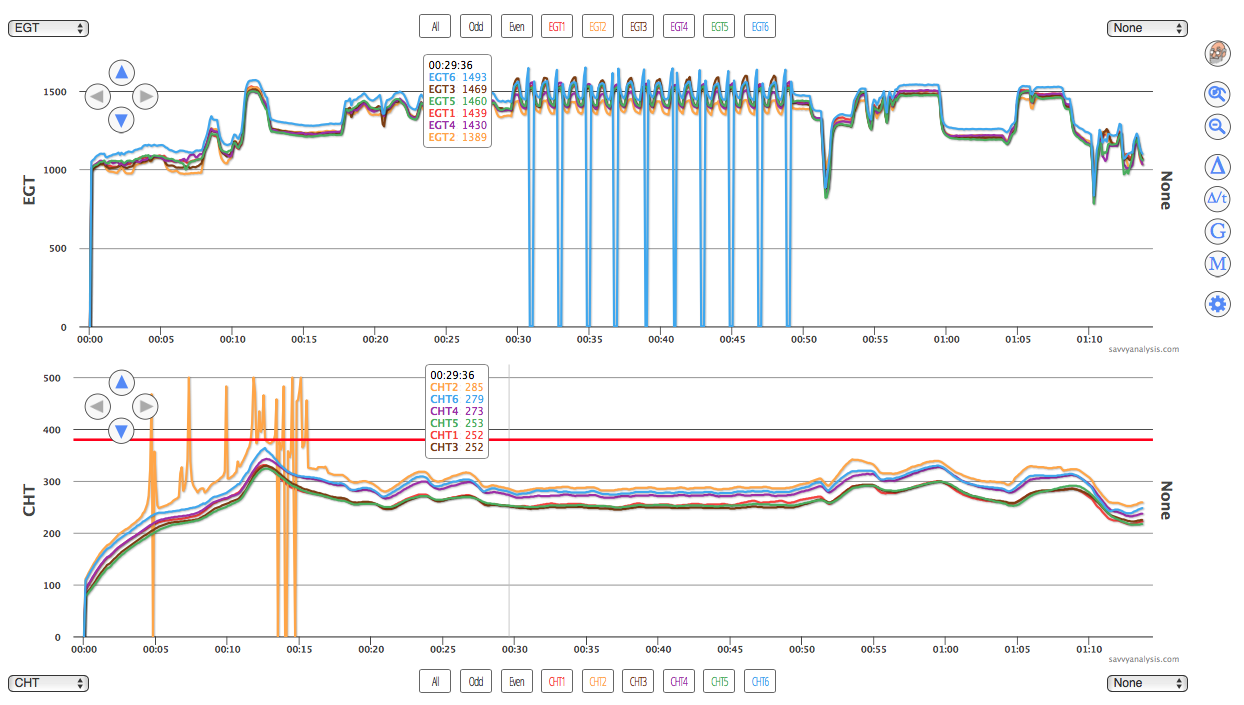
The two elephants in the room here are the spikes in CHT 2 – the tan trace and in EGT 6 – the blue trace. Let’s take EGT 6 first. When a plug stops firing, we expect EGT to rise about 70-100º, and EGT 6 is at the top of or well above other EGTs from startup to shutdown – regardless of FF and power settings. So we’re already suspicious of one of the plugs, and the series of ten mag checks (you would have had me at two, but ok) shows EGT 6 dropping to precisely zero on the second mag checked – which is the R mag firing the bottoms of 2-4-6.
We don’t believe for a second that the residual exhaust gas moving through the pipe drops to 32º below freezing, then jumps back to 1500º like it never happened – ten times in a row. We’re pretty sure that the EGT there is very high and the probe can’t handle the truth. In any case, we know where to look.
We also don’t believe what we see in CHT 2, at least from 5 to 15 mins. After that it looks believable. And like the SR-22 earlier, this looks like the evens are running hotter than the odds in flight. Again we’d suggest checking cooling because combustion looks ok – except for the bottom plug of 6.
Here’s data from a Cessna 400 Corvalis with a Continental TSIO-550-C and data from a Garmin 1000 with a 1 sec sample rate.

As before, CHT 3 is in the pack during ground ops, but hotter in flight. I should note that because the cooling is so good on this 400, and on both SR-22s earlier, even these elevated CHTs don’t get into the red zone that would require significant action from the pilot. Still, you don’t want a rogue CHT or group of CHTs if you can avoid it.
We don’t have a series of sweeps to confirm that EGT 3 is not a lean outlier, but the EGT data itself doesn’t suggest that. So this also looks like a case where the cyl needs cooling. The only hedge on that bet is those two “humps” in CHT 3 at the 2 hour and 3 hour marks in the timeline. Maybe you’re like me and thought those may have been connected to fuel tank switches and some momentary interruption in fuel flow. It’s a great theory but none of the other data supports it.
We also can’t rule out a failing probe, because we’ve seen probes that don’t die with dramatic flair, they just track high for a while before they give up the ghost. CHT 2 – the tan trace – has a couple of smaller humps, too, just before those in CHT 3. CHT 1 – the red trace – looks like noise in the data. It might be picking up noise from a starter cable or other hi-amp source.
Last but not least is EGT 4 – the purple trace – which is jumpy throughout – almost. Let’s zoom in to the mag check midway through the flight.
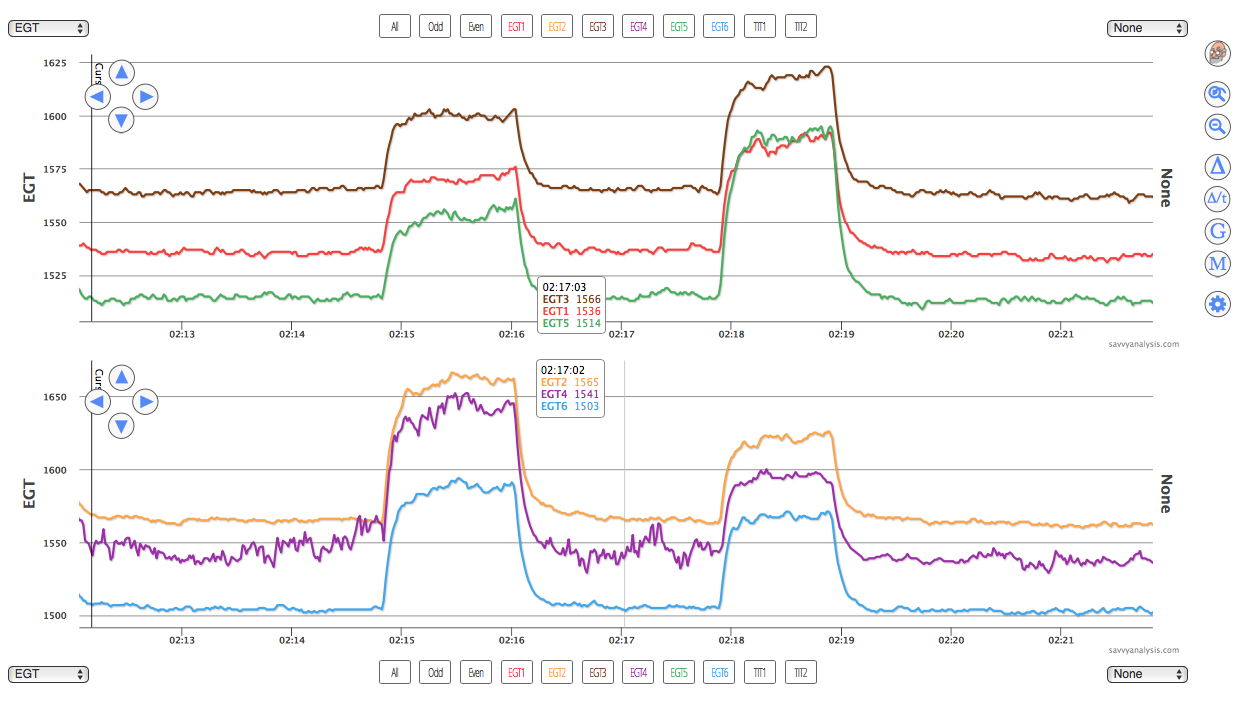
The only time when EGT 4 is not jumpy is during the second mag checked. The first mag checked fires the top plugs of 1-3-5 and the bottoms of 2-4-6, the second mag checked fires the bottoms of 1-3-5 and the tops of 2-4-6. So when the bottom plug of cyl 4 is not firing, EGT 4 stabilizes, so we’d recommend checking the plug and harness for the bottom plug of cyl 4.
We’ll finish this all-Continental month with data from a Cessna 414 with Continental TSIO-520-N engines and data from a JPI 760 Twin with a 2 sec sample rate.
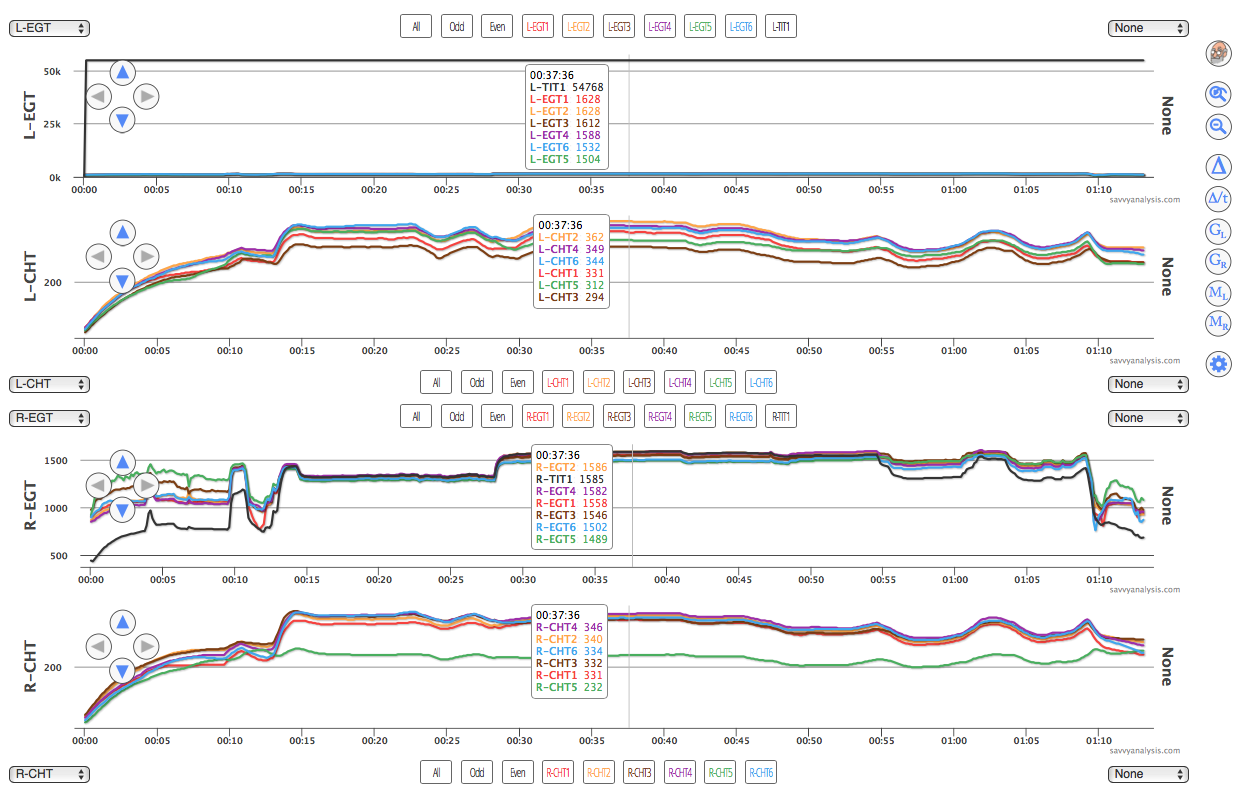
If EGT dropping to zero is hard to believe, what can we say about a TIT temp approaching 55,000º? That’s Fahrenheit – as if it matters. You gotta hand it to our parser software, it obediently changed the Y axis on the left side to 25K and 50K just like it’s supposed to.
When we see a malfunction like this we zoom in to see when it started and did something else change there – voltage spike, power change, any evidence of causation or even corroboration? Let’s zoom in to the first ten seconds of the data.
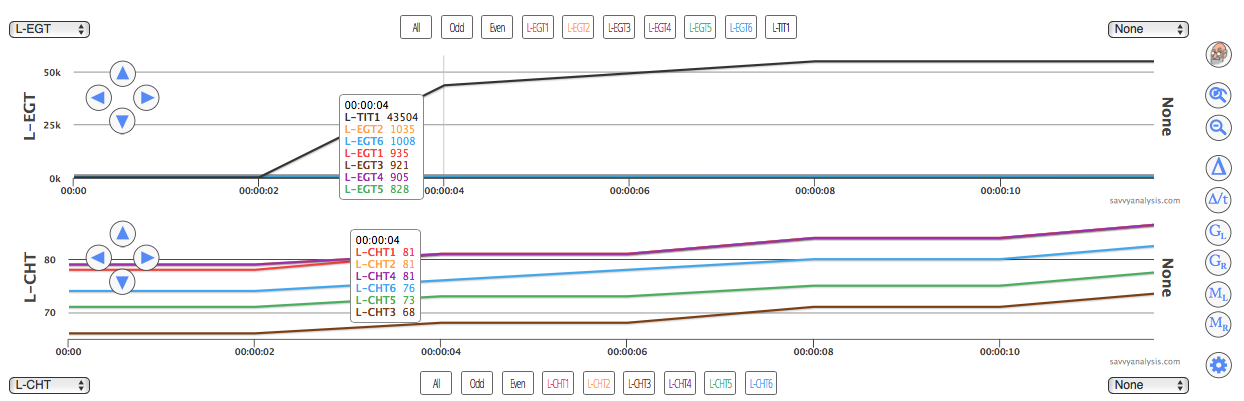
First sample of the TIT is zero, the next sample at 2 secs is zero, and at 4 secs its already 43,504º.
No amount of coolin’ is going to help this failed TIT probe.
