Lately the news is filled with examples of deep fakes. This is nothing new for pilots. We practice partial panel approaches for scenarios where technology is trying to convince us that something phony is real. It’s nothing new for engine data analysts. We start the process with evaluating the reliability of the data.
The difference is the perpetrator. A good deep fake usually has a bad actor or a comedian attached to it. We almost never see either in an airplane – it’s just bad data from a loose connection or a failing part. Or is it?
This month Savvy’s Director of Analysis Joe Godfrey looks at data from a Cessna 182, a Beech Bonanza 36, a Cirrus SR22T and a Cessna 210.
Let’s start with a Cessna 182 powered by a Continental O-470 engine and data from a JPI 900 with a 1 sec sample rate. Rather than take up space depicting CHTs and FF for each flight, let’s stipulate that both looked normal for all cylinders. The is EGTs only for four consecutive flights.


There are a few things in this data that we could examine, but let’s stick with the green trace of EGT five. On the first flight, it appears to track accurately until about the 27 minute mark, with a slight blip around 25 minutes. At that point at looks like it could be a loose connection, as the data jumps between normal numbers and fake numbers. On the next flight it’s flatlined at around 1000° before it starts jumping around.
On the next flight, it’s flatlined around 300° for about the same amount of time as the previous flight. When it starts, jumping, the jumps are a little smaller than before, but unlike the previous two, it ends the flight, not tracking accurately. On the fourth flight, we see the same initial flatline of 300°, but for about half as long, and then a flatline of about 1000° until power is reduced for approach.
It always makes sense to check the connection first. In this case, on the first flight you could make a case for a loose connection. Even into the second flight, you could make a case that there’s no connection initially, then, as the parts heat up, there’s a wobbly connection.
It’s a harder case to make on the third and fourth flights, and the fourth flight looks like the probe has failed, but it tried to start tracking again as the EGT range dropped when power was reduced.
I can’t help but wonder what the pilot was thinking as the numbers bounced around.
Next up is a Bonanza 36 powered by a Continental IO-550-TN with data from a JPI 700. FF is not logged, so this is EGTs and CHTs. Nothing special about cursor placement – just getting it out of the way of the event. CHT 3 peaks at 439º at 16:12.
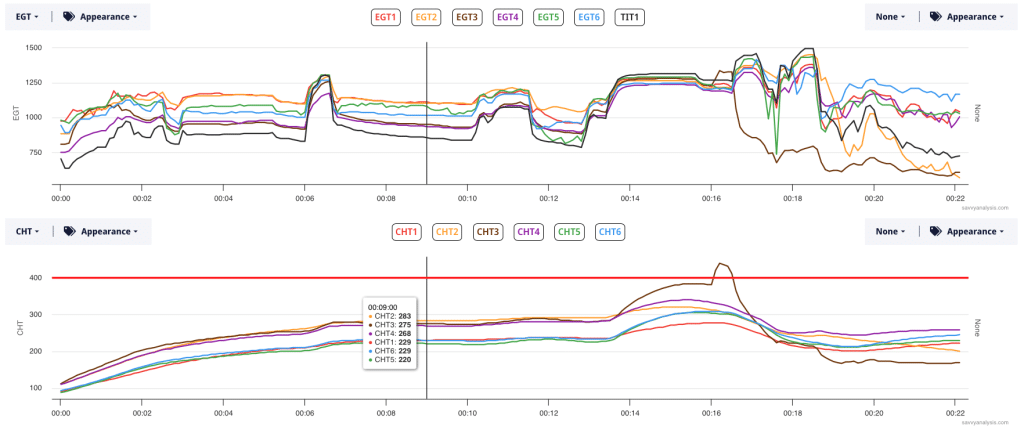
If you’re a regular puzzler reader, you’ve seen several detonation events depicted here. Typically will see a runaway CHT and the peak number is often much higher than it is here. Another symptom of a typical detonation event is a drop in the related EGT, which we see here. But not before that EGT makes a jump, which we also see in CHT 3.
So rather than the pyramid shaped CHT we usually see with a detonation event, we have this unusual pattern – unusual because the thermal mass of a cylinder doesn’t change this fast. Could this be a probe failing in the middle of a combustion event? That seemed a little far-fetched, even for the deep fake era. We weren’t convinced it was detonation but it certainly deserved an examination. And that examination revealed a separation in the cylinder head.
It makes perfect sense once you have the answer. The barrel cracked a little around 14 mins, then stabilized. That’s the first jump and plateau in CHT 3. The second quicker jump is the crack widening, probably enough to heat up the nearby EGT probe. The pilot reported a very bad vibration. GPS ALT isn’t logged, but we can extrapolate the flight path from the engine data. With takeoff just before 14 mins, the airplane wasn’t far from the field when this occurred. The pilot also reported no oil on the cowl or window – easy to image that being the next set of events had power not been reduced.
Next is a quick palette cleanser from a Cirrus SR22T powered by a Continental TSIO-550 and data from a Garmin G1000 with a 1 sec sample rate. EGTs, CHTs and FF, with the cursor out of the way.
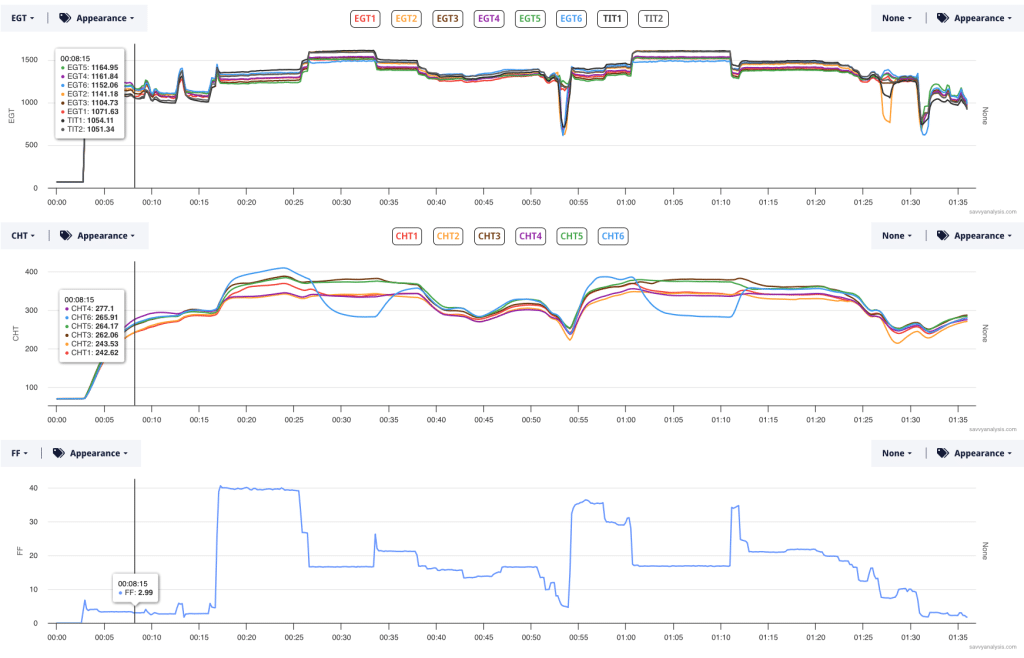
Our job is to figure out why the engine’s running rough when LOP. If you noticed that CHT 6 is high at max FF and moves much lower when FF is reduced, you’re almost there. You might wonder if EGT 6 makes a similar move. Here are EGTs and CHTs for the in-flight segment.
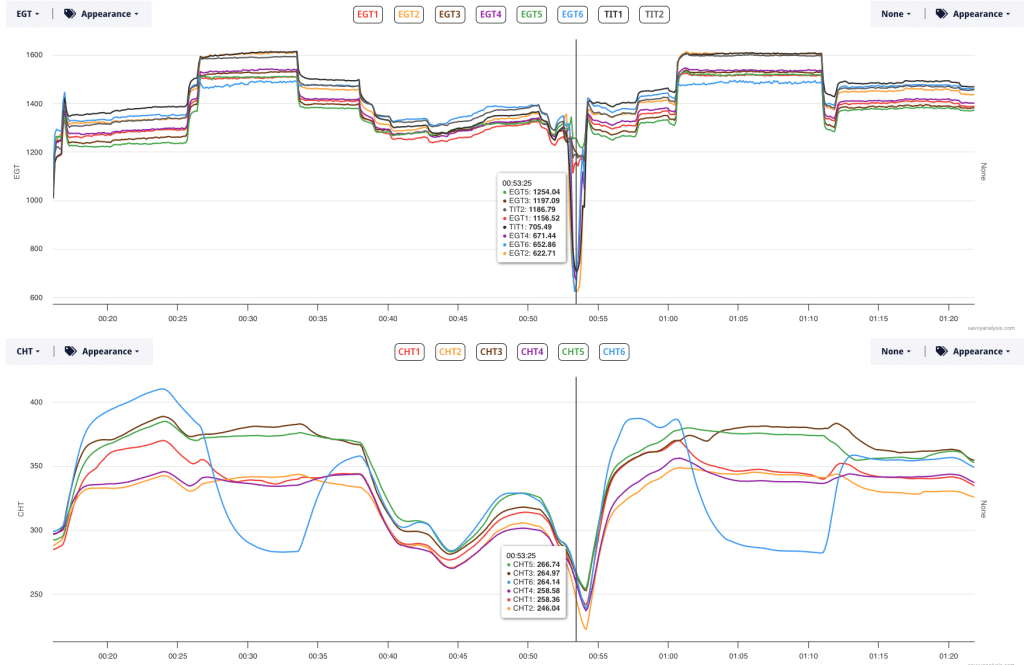
A-firm. EGT and CHT 6 are high at max FF and both move lower when FF is reduced. No fakes here. Textbook clogged injector.
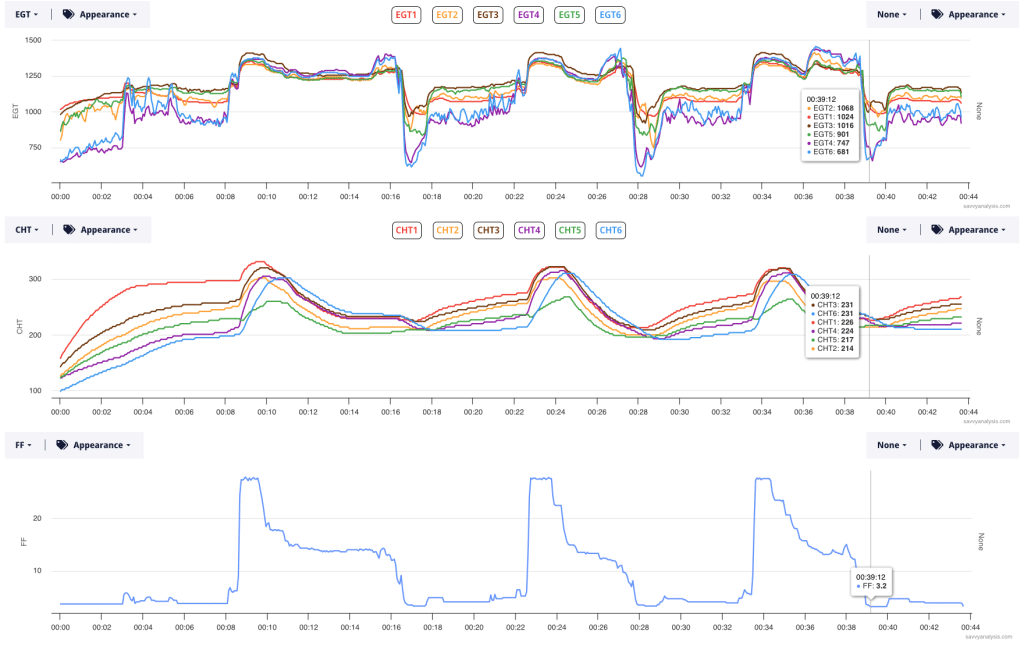
We’ll finish with a Cessna 210 powered by a Continental IO-520 and data from a JPI 830 with a 2 sec sample rate. EGTs, CHTs and FF. Cursor is out of the way.
Here’s a better look at EGTs alone.
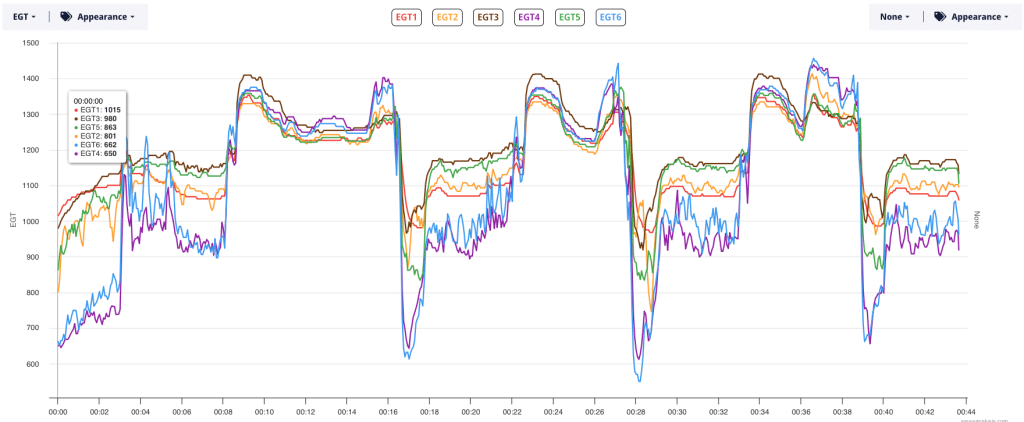
When a bank of cylinders – in this case 2-4-6 – move as a group and differently than the other bank, we suspect induction. EGTs 4 and 6 are problematic, but 2 is more like the others. The worst of the patterns are at idle or low power, so maybe idle mixture ? Except idle mixture effects all cylinders, and this problem is clearly worse in 4 and 6. CHTs 4 and 6 aren’t high at max FF, so this isn’t acting like the clogged injector we saw earlier.
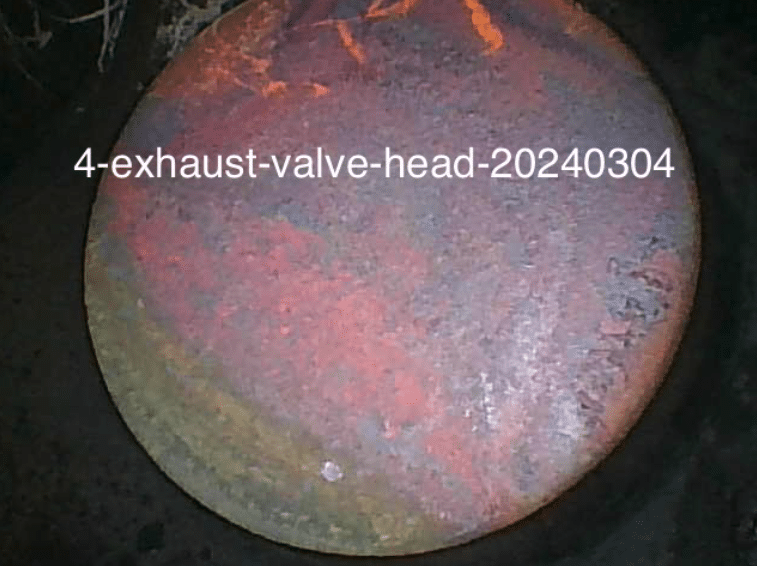
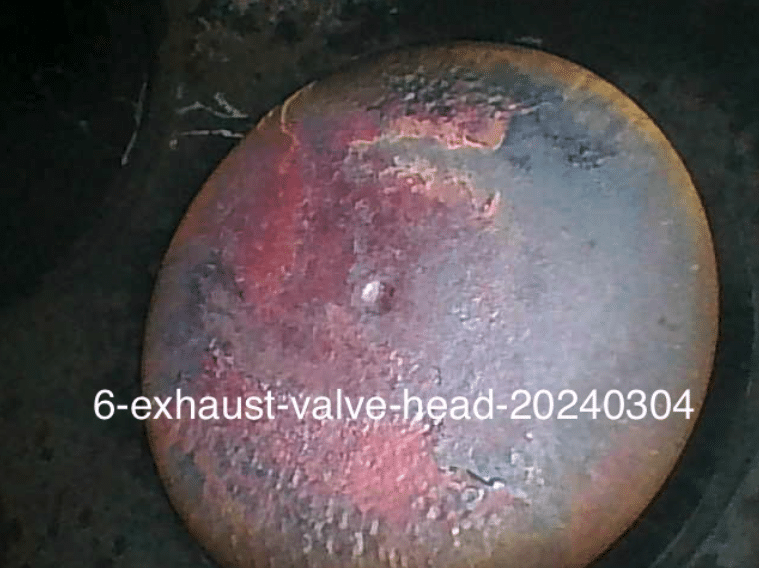
As I write this we’re about 10 weeks into our borescope initiative. We already have tens of thousands of pictures and in this case the pictures helped explain the data.
